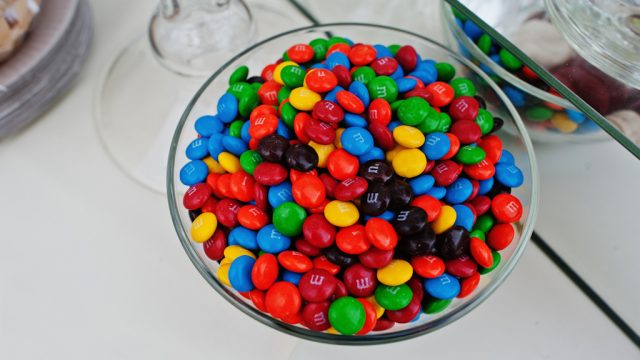
This Is the Rarest Color in Your Bag of M&M’s

One of the most memorable parts of the classic romcom The Wedding Planner is when Steve (Matthew McConaughey) tells Mary (Jennifer Lopez) that he only eats the brown M&M’s because they “have less artificial coloring because chocolate’s already brown.” Granted, Steve, who is supposed to be a doctor, is patently wrong, given that the candy shell is made of food coloring. But it’s a sweet scene nonetheless, because it speaks to the fact that everyone seems to have one color of M&M’s that they prefer to all the rest, and if you meet someone who loves the same color, romcom rules dictate that they’re your soulmate.
But if you’ve ever opened up a packet of M&M’s, poured the candy onto the table, and taken a real, hard look at the heap, it’s clear that some colors seem to be significantly favored to others. So, if Steve only eats the brown M&M’s, how many does that really add up to?
It turns out the answer depends on the time period, as these button-shaped chocolate treats have had quite a few makeovers since their introduction in 1941. The original colors were red, yellow, violet, green, and brown, but the red had to be replaced with orange in 1976 over concerns that the red dye contained carcinogens (which they actually didn’t).
Ten years later, a college student named Paul Hethmon singlehandedly brought them back to life by creating a “Society for the Restoration and Preservation of Red M&M’s” that went viral worldwide and shepherded their return. In 1995, blue was chosen to replace tan M&M’s by popular vote, and since then, a regular pack of M&M’s has contained six colors: brown, yellow, green, red, orange, and blue.
In 1997, Mars’ website went so far as to list the distribution of colors as 30% brown, 20% yellow, 20% red, 10% orange, 10% green, and 10% blue. Then, in 2008, they changed to 24% blue, 20% orange, 16% green, 14% yellow, 13% red, 13% brown. But one day the color breakdowns vanished from the site, and it all became a mystery. Well, until Rick Wicklin—a statistician at the software company SAS—made it his mission to figure the distribution out himself in early 2017.
For weeks, he took two took two scoops of M&M’s from a large jar in his office’s break room, and began counting them up. Eventually, on the basis of 712 M&M’s, he decided the color breakdown was now 19.5% green, 18.7% orange, 18.7 percent blue, 15.1 percent red, 14.5 percent yellow, and 13.5 percent brown, which would make Steve’s beloved brown M&Ms the odd ones out.
However, there is a plot twist. When Wicklin contacted Mars to find out how accurate he was about the breakdown, he was informed that plain (ie., “non-peanut,” “non-pretzel,” etc.) M&M’s are actually made in two different factories—one in New Jersey, the other in Tennessee—each of which had slightly different color distributions.
They sent him their data, and he found that his sample was roughly aligned with that of the Tennessee factory. The color breakdown of the New Jersey factory, on the other hand, was 25% blue and 25% orange, with the other four colors divided up at an even 12.5% each. Whichever way you slice it, brown—which was once the leading color—has now been relegated to the back of the pack, and to date Mars has never offered an explanation why.
So maybe Steve was right and only eating the brown ones is healthier—if only because there are so few of them! And for more silly knowledge you can’t help but read, see these 50 Facts So Crazy You Won’t Believe They’re Actually True.
To discover more amazing secrets about living your best life, click here to follow us on Instagram!