This Is the Most Hated City in America
Quick: what’s your favorite city in America? Maybe it’s your hometown, which you loved so much you never even left. Maybe it’s the city where you went to college, or a place you’ve always dreamed of visiting but haven’t made it to yet. Naming your favorite city probably isn’t too much of a head scratcher, but what about the city you hate the most? Yes, hate is a strong word, especially in our current divisive times. But the fact is, cities get a lot of hate; you don’t even need to ask a New Yorker what they really think about Boston! And long-lasting sports rivalries aside, some cities tend to draw ire from visitors in general, whether it’s because of the attitude of their inhabitants, how dirty they are, poor public transportation, or some other factors. At Best Life, we were determined to find out America’s most hated city overall.
To begin, we narrowed our list down to the 100 biggest cities to find their place on our favorability scale. We examined how often and where exactly these cities appeared on four of the most recent and comprehensive “favorite city” surveys: a 2009 Pew survey, a 2016 Travel and Leisure ranking of rudest cities, and two 2017 Travel and Leisure polls that measured the most underrated city and the nation’s favorite city. That left us with a list of 44 contenders. We combined the scores of these polls into a favorability scale, measuring how positively or negatively people felt about the cities—the lower the score, the more hated the city. (Some were even below 0.)
Then we used Gallup-Sharecare’s most recently published city wellbeing index, which ranked 186 metro areas on their community happiness. We also factored in another recent Gallup-Sharecare poll, which directly asked residents how many of them were proud of their city.
Lastly, we measured the 10-year population change in each city from 2010 to 2019 using data from the U.S. Census Bureau, comparing it to the national population increase of 6.1 percent. That tells us which cities grew more than the U.S. as a whole—and which saw more people move away. We then assigned each of these four metrics a weighted value and ran them through our exclusive algorithm to see how each city scored on our Hate Index.
The results are mixed, with both the most- and least- hated cities situated in the Midwest. And Los Angeles came out with the lowest score on the favorability scale, but scored higher marks in community well-being and population growth. Read on to discover the most hated city in the U.S., and find out where your nearest urban locale falls in the mix. And for the state that gets the most hate, check out The Most Hated State in America.
Read the original article on Best Life.
44
Minneapolis, Minnesota
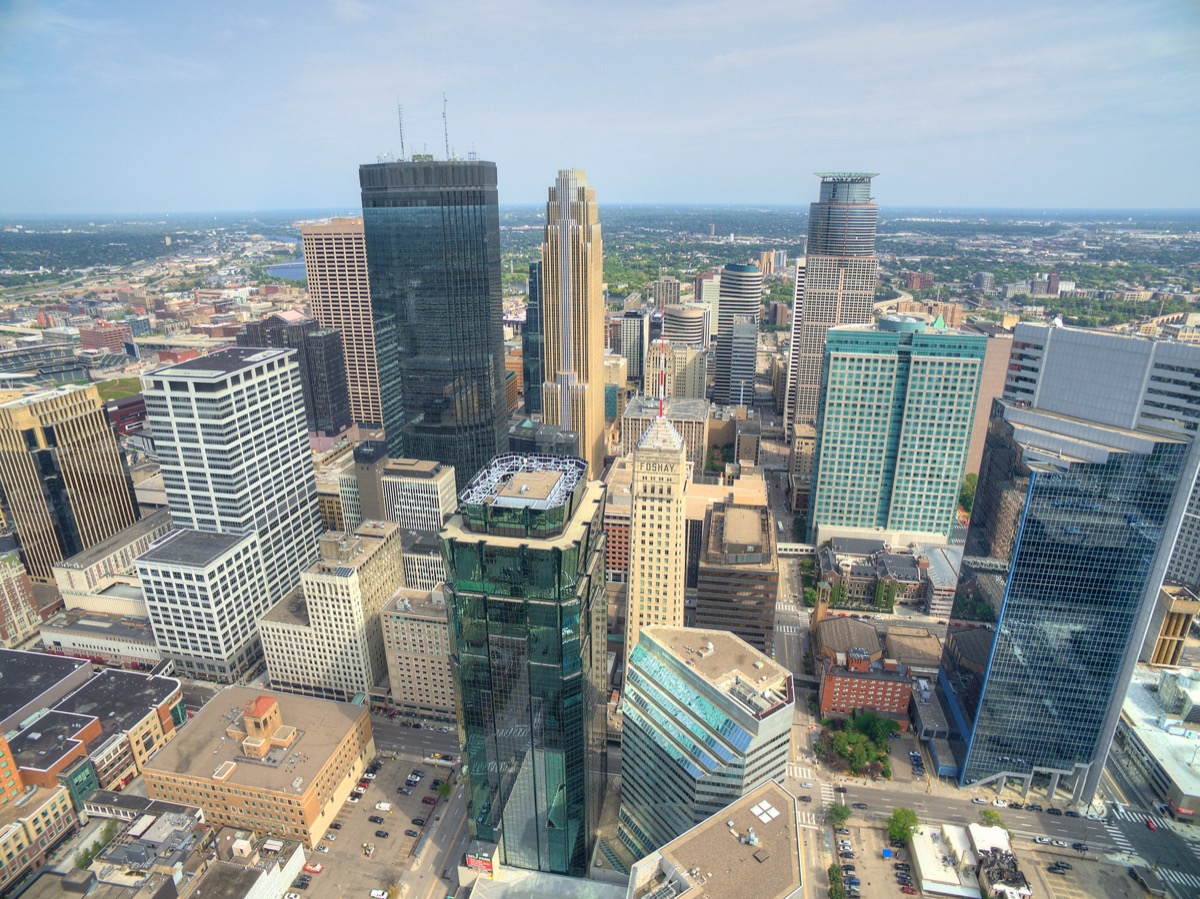
Community well-being rank: 43
Residents who are proud of their city: 67.6 percent
Population change since 2010: +12.29 percent
Favorability scale: 7.0
Hate Index Score: 0.00
43
Fort Worth, Texas
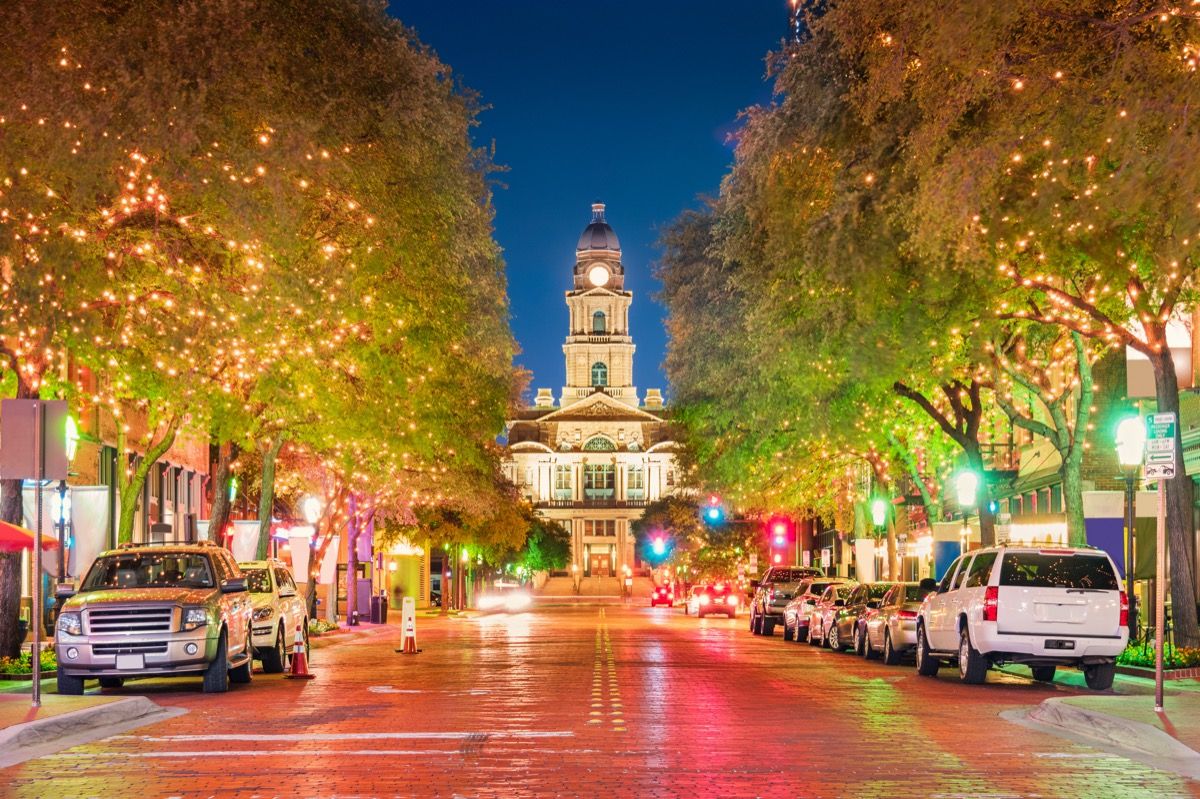
Community well-being rank: 59
Residents who are proud of their city: 66.3 percent
Population change since 2010: +22.72 percent
Favorability scale: 5.5
Hate Index Score: 0.56
42
St. Paul, Minnesota
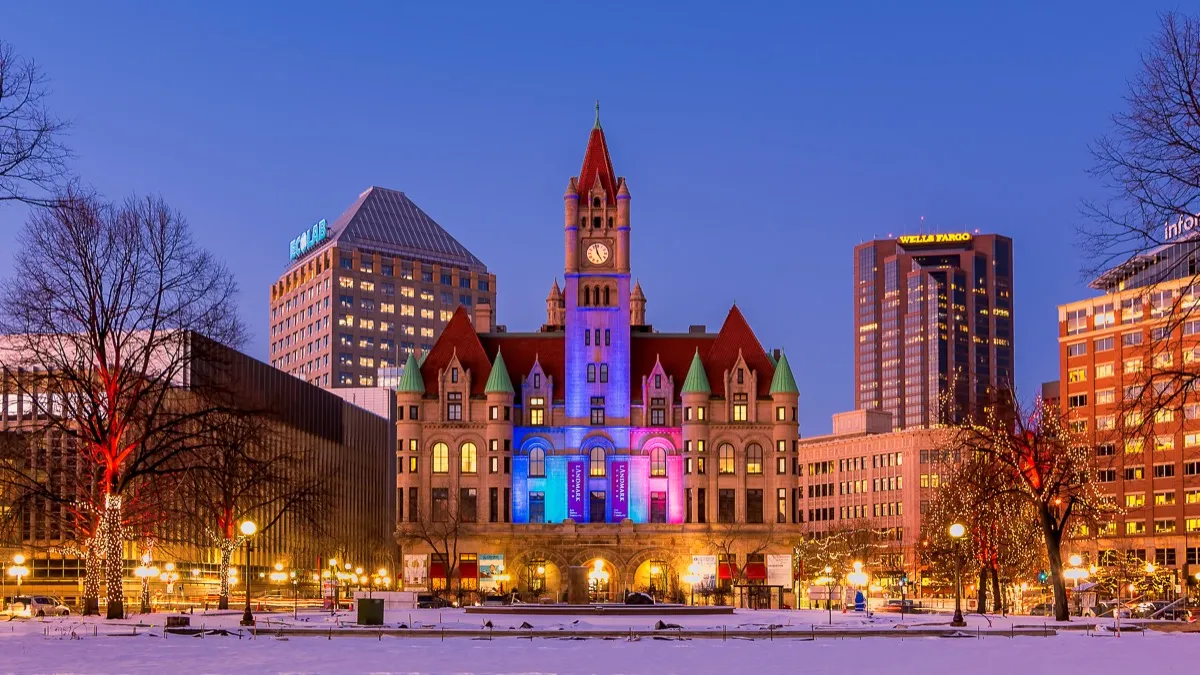
Community well-being rank: 43
Residents who are proud of their city: 67.6 percent
Population change since 2010: +8.08 percent
Favorability scale: 7.0
Hate Index Score: 3.84
41
San Diego, California
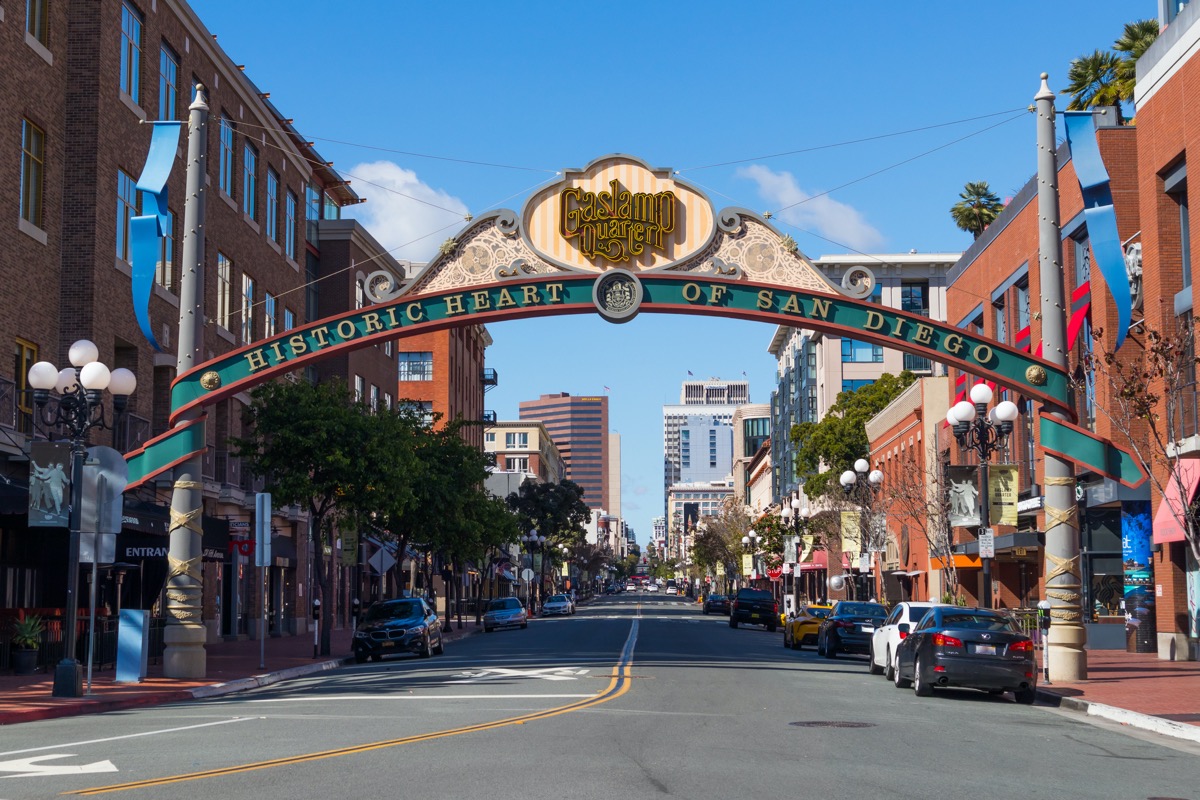
Community well-being rank: 39
Residents who are proud of their city: 67.1 percent
Population change since 2010: +8.91 percent
Favorability scale: 6.1
Hate Index Score: 5.84
And for the place where cannabis is quite popular, This Is the Most Stoned State in America.
40
Denver, Colorado
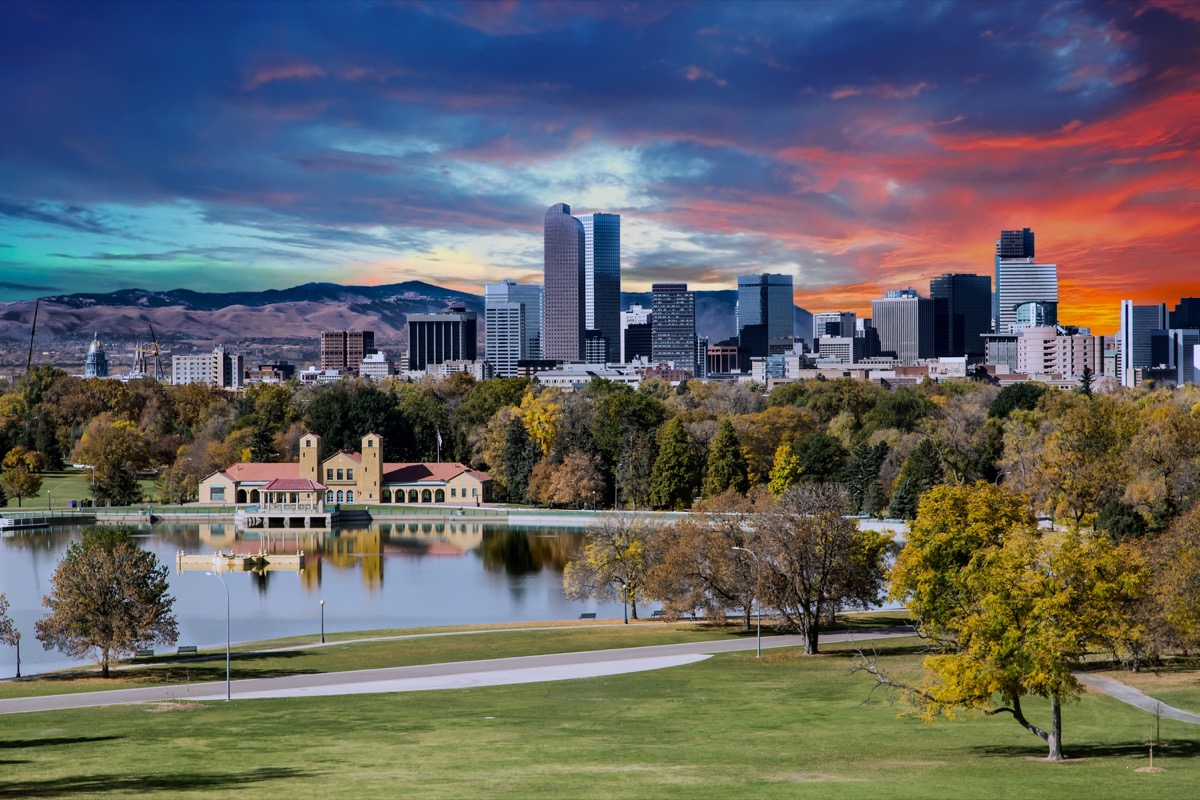
Community well-being rank: 55
Residents who are proud of their city: 68.1 percent
Population change since 2010: +21.17 percent
Favorability scale: 2.1
Hate Index Score: 8.99
39
Portland, Oregon

Community well-being rank: 17
Residents who are proud of their city: 64.7 percent
Population change since 2010: +12.16 percent
Favorability scale: 3.4
Hate Index Score: 10.93
38
San Fransisco, California
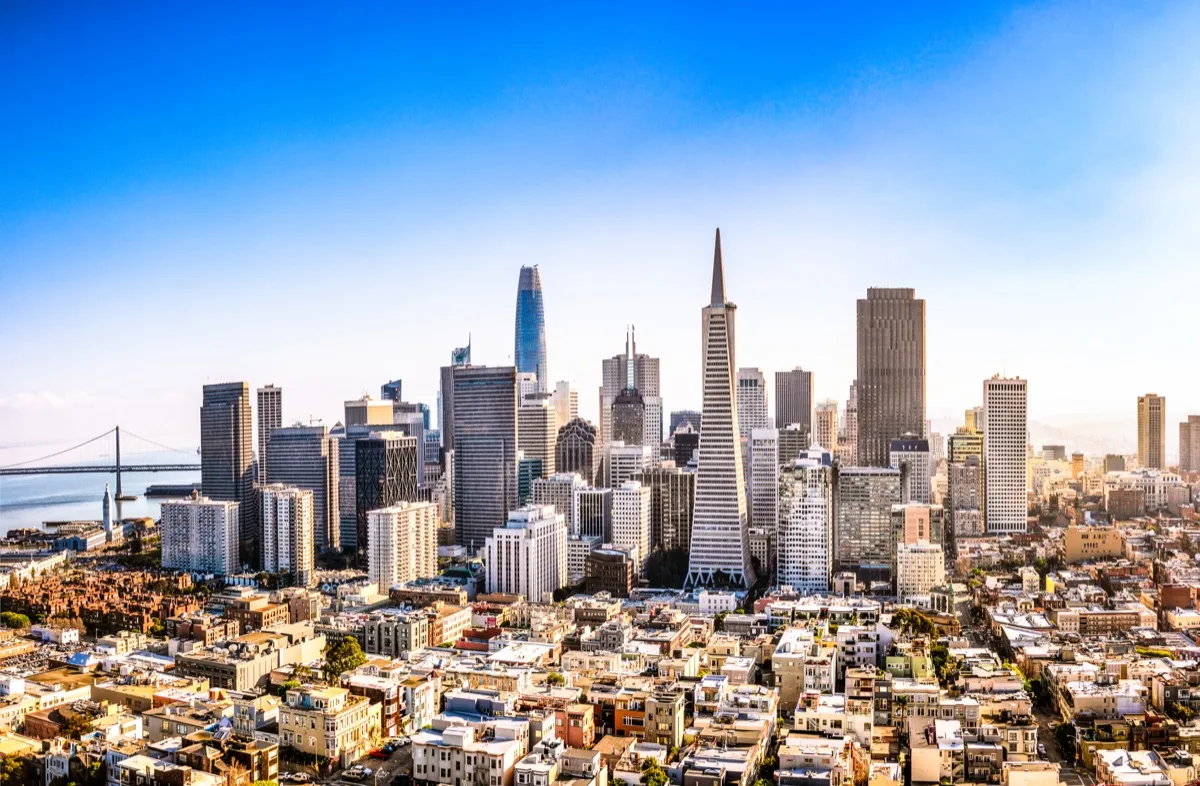
Community well-being rank: 73
Residents who are proud of their city: 64.0 percent
Population change since 2010: +9.48 percent
Favorability scale: 7.1
Hate Index Score: 13.99
37
Nashville, Tennessee
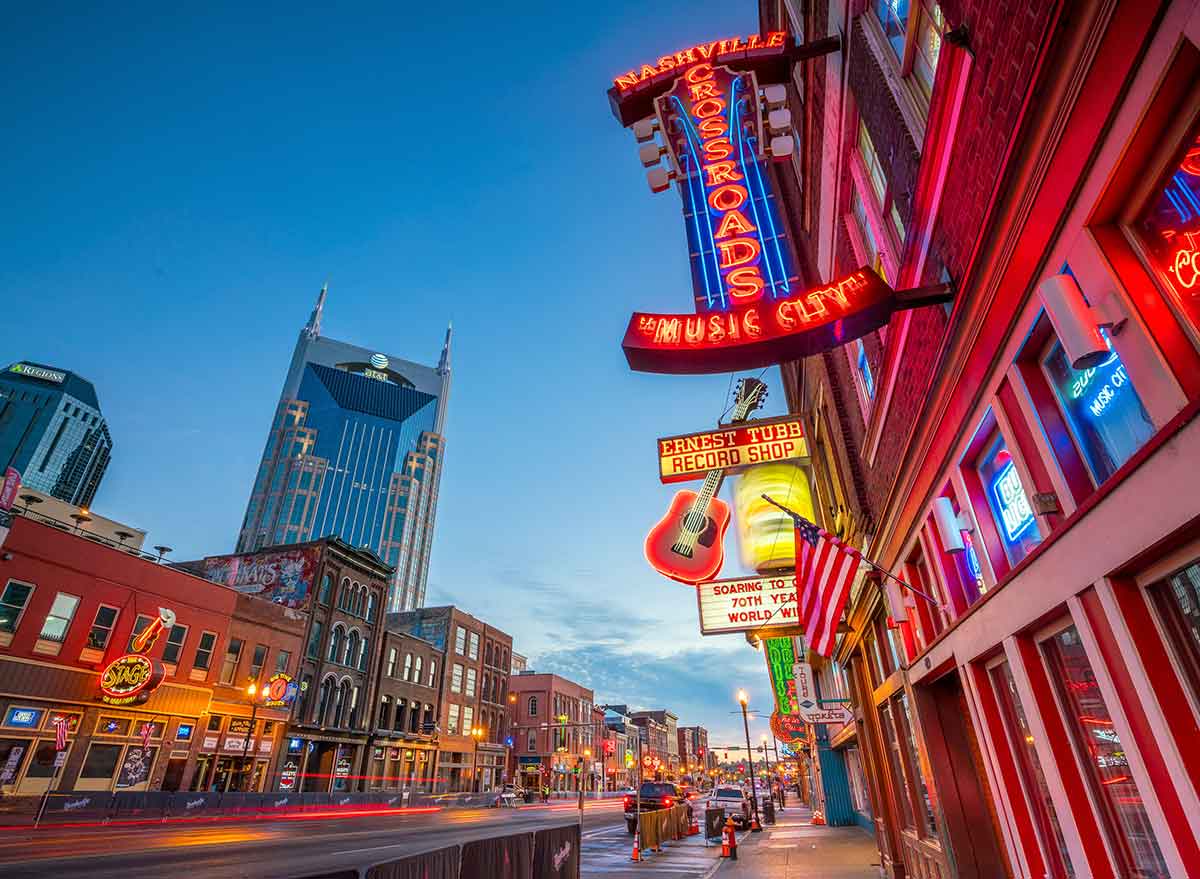
Community well-being rank: 34
Residents who are proud of their city: 65.9 percent
Population change since 2010: +11.58 percent
Favorability scale: 2.1
Hate Index Score: 16.97
36
Indianapolis, Indiana
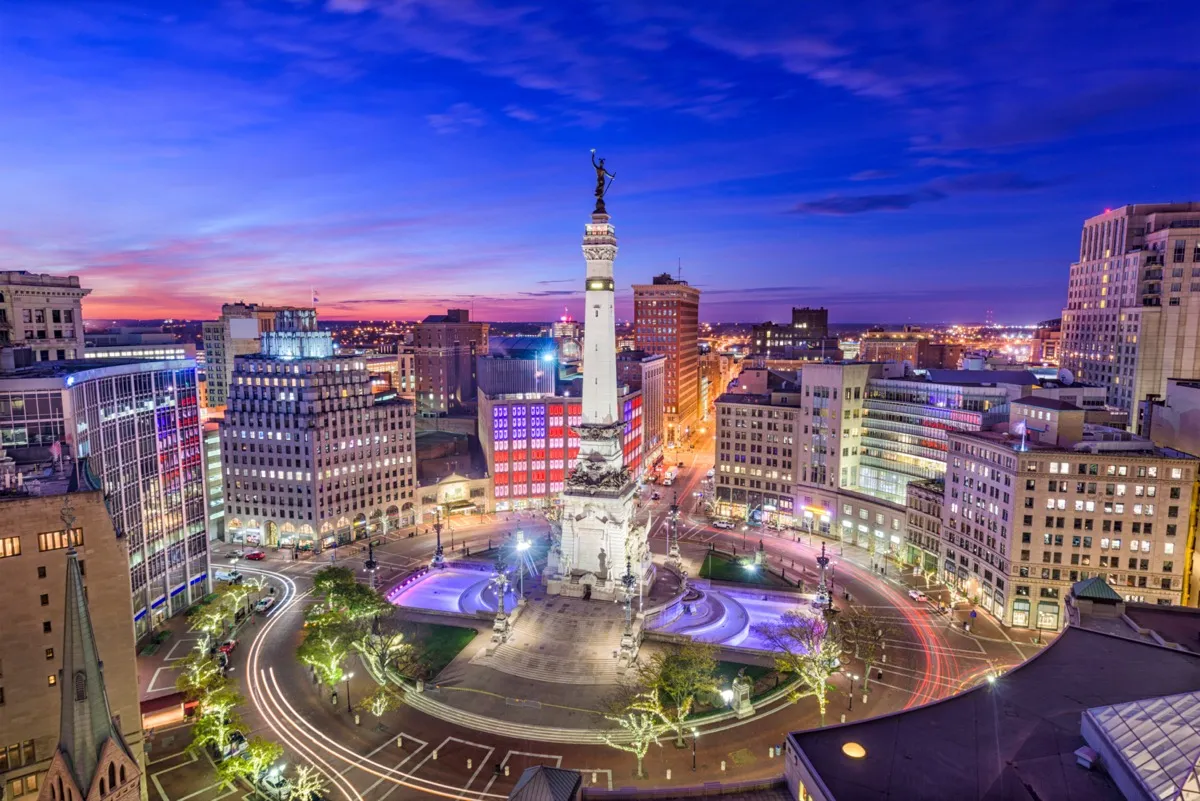
Community well-being rank: 109
Residents who are proud of their city: 61.8 percent
Population change since 2010: +61.8 percent
Favorability scale: 10.3
Hate Index Score: 17.33
35
Washington, D.C.
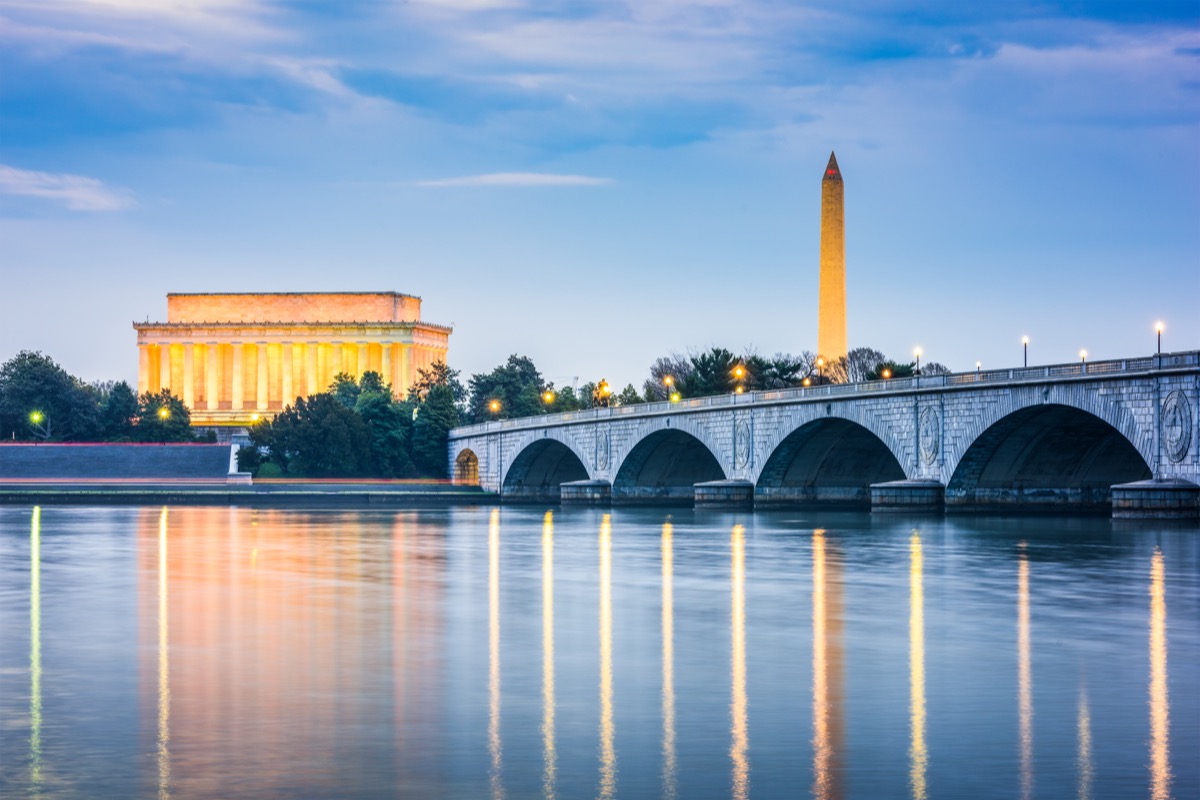
Community well-being rank: 76
Residents who are proud of their city: 65.8 percent
Population change since 2010: +17.29 percent
Favorability scale: 2.1
Hate Index Score: 20.45
34
San Antonio, Texas
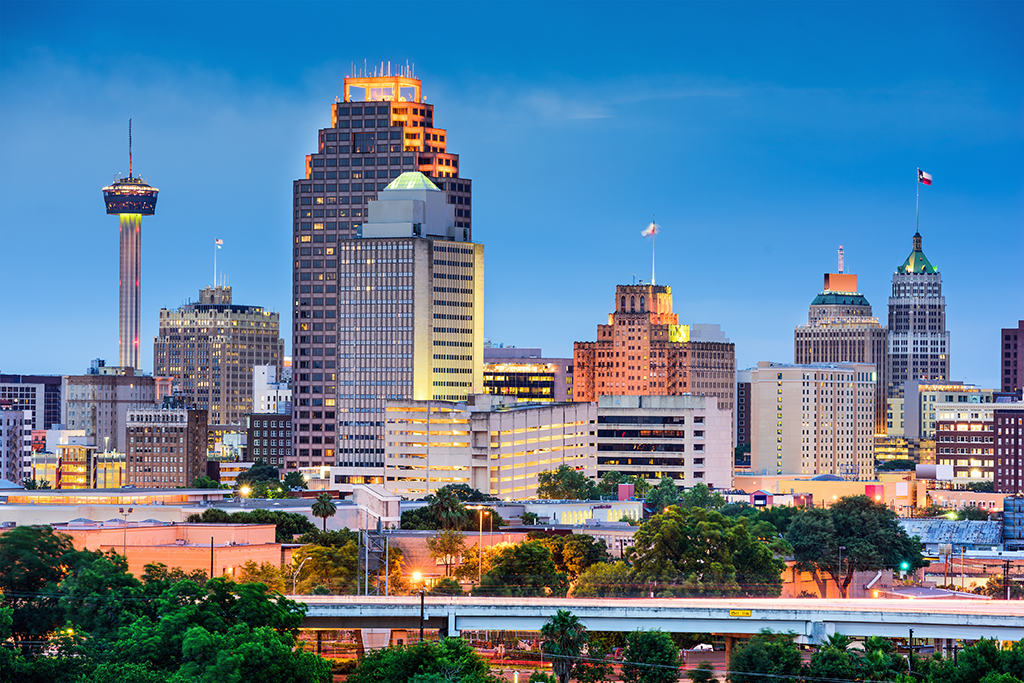
Community well-being rank: 36
Residents who are proud of their city: 66.7 percent
Population change since 2010: +16.56 percent
Favorability scale: -1.4
Hate Index Score: 22.64
33
Orlando, Florida
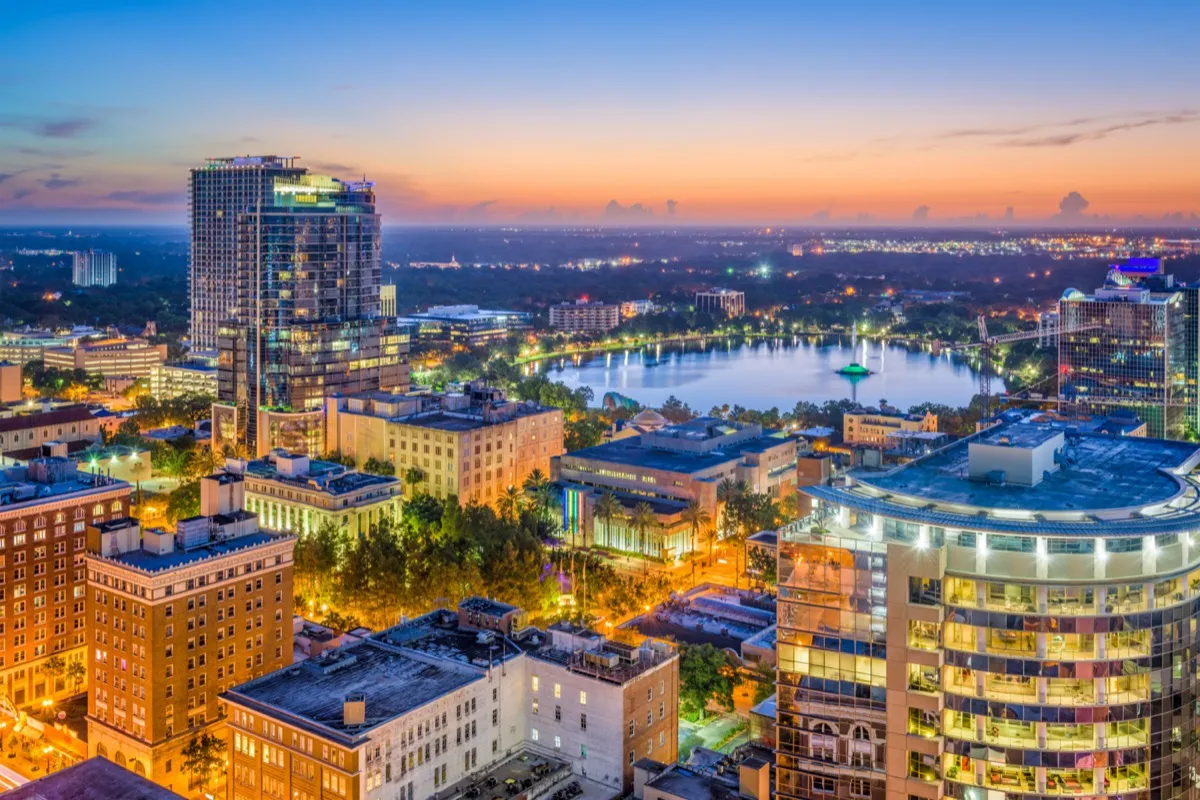
Community well-being rank: 77
Residents who are proud of their city: 64.3 percent
Population change since 2010: +20.62 percent
Favorability scale: -0.1
Hate Index Score: 27.13
32
Seattle, Washington
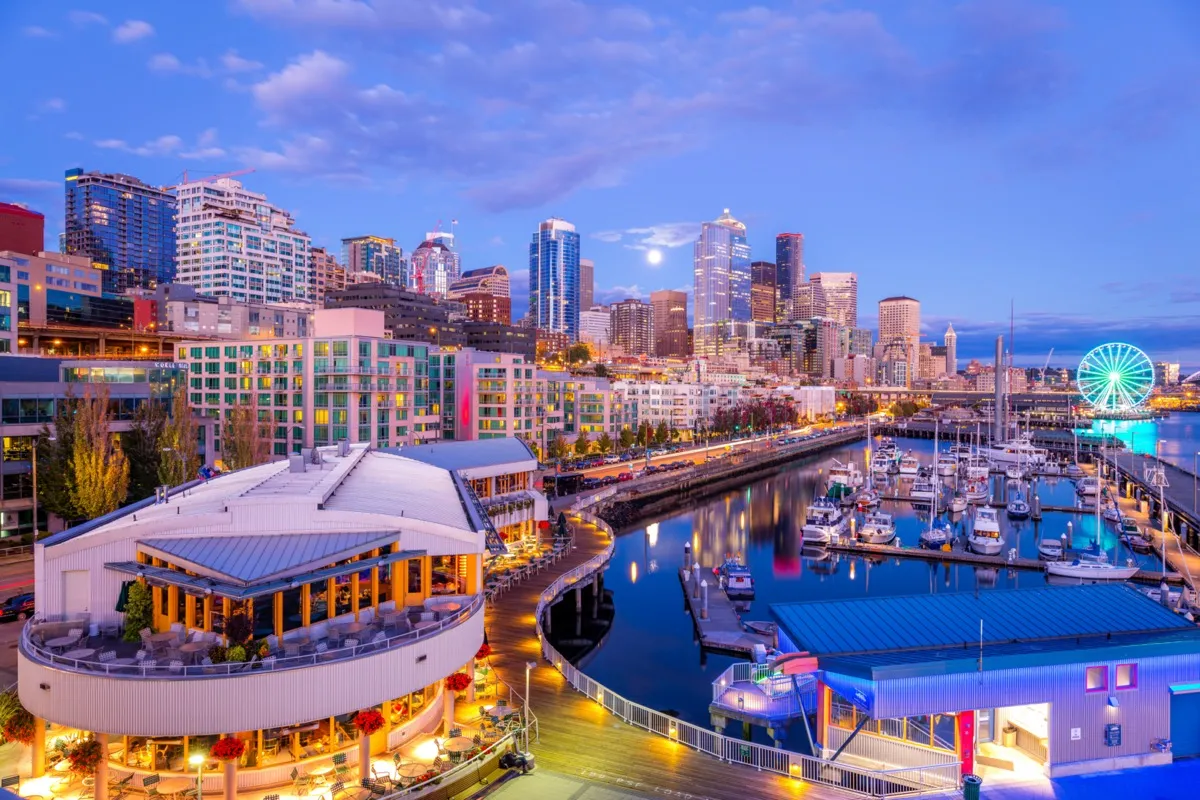
Community well-being rank: 105
Residents who are proud of their city: 63.2 percent
Population change since 2010: +23.83 percent
Favorability scale: 0.9
Hate Index Score: 28.47
And for more on the place where people aren’t very generous, This Is the Meanest State in America.
31
Buffalo, New York
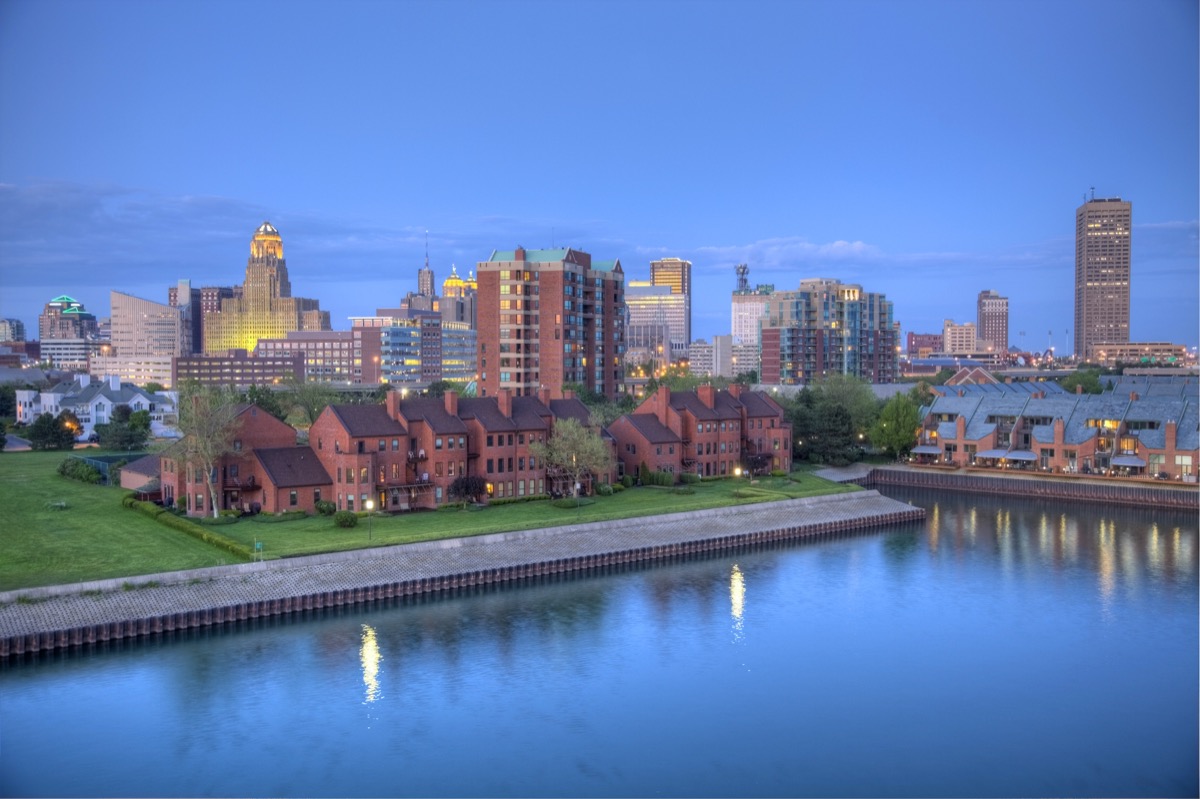
Community well-being rank: 123
Residents who are proud of their city: 58.6 percent
Population change since 2010: -2.31 percent
Favorability scale: 11.5
Hate Index Score: 29.62
30
Louisville, Kentucky
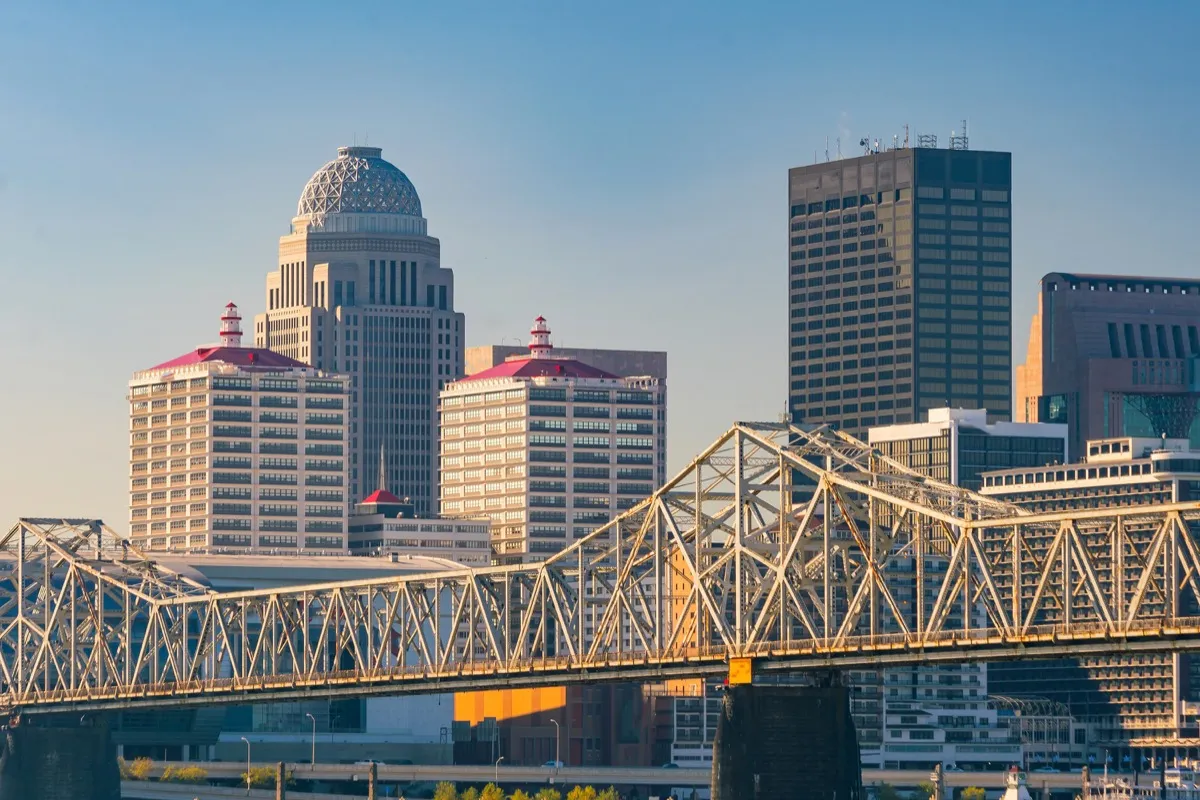
Community well-being rank: 102
Residents who are proud of their city: 65.6 percent
Population change since 2010: +3.40 percent
Favorability scale: 4.5
Hate Index Score: 31.20
29
Kansas City, Missouri
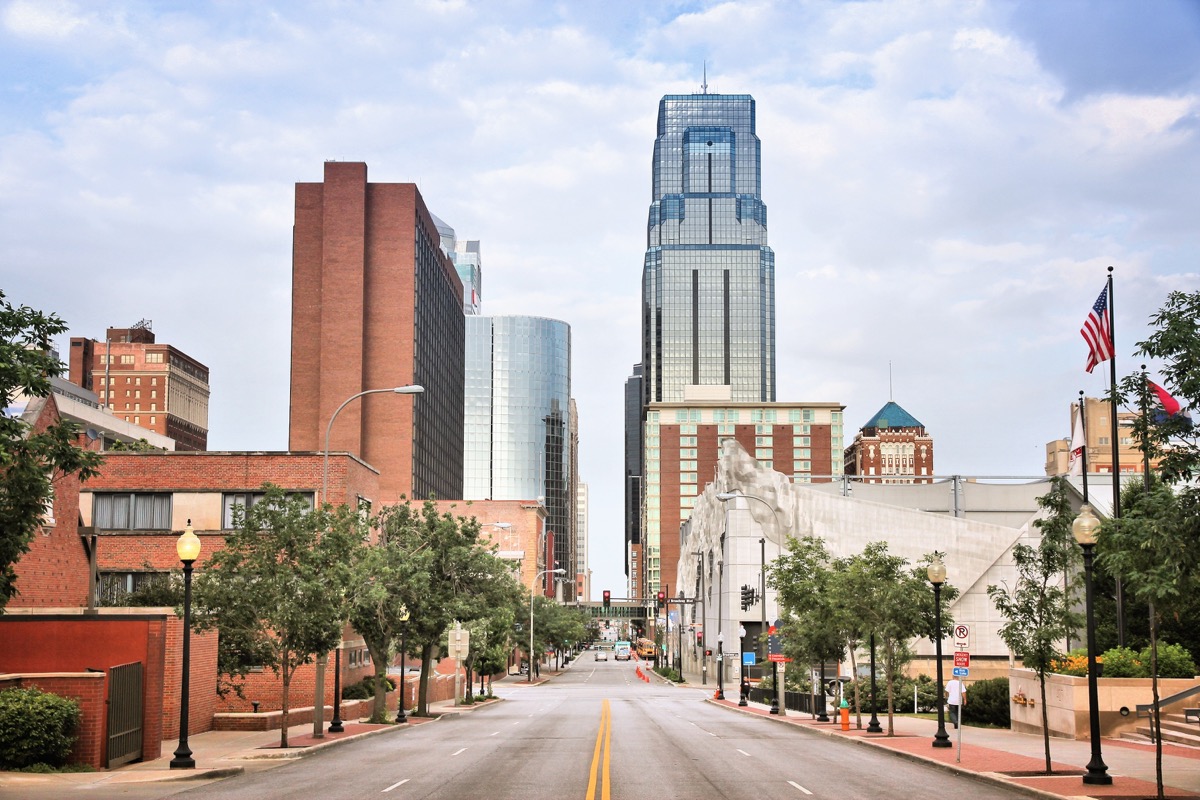
Community well-being rank: 80
Residents who are proud of their city: 65.8 percent
Population change since 2010: +7.73 percent
Favorability scale: 1.5
Hate Index Score: 31.97
28
Tampa, Florida
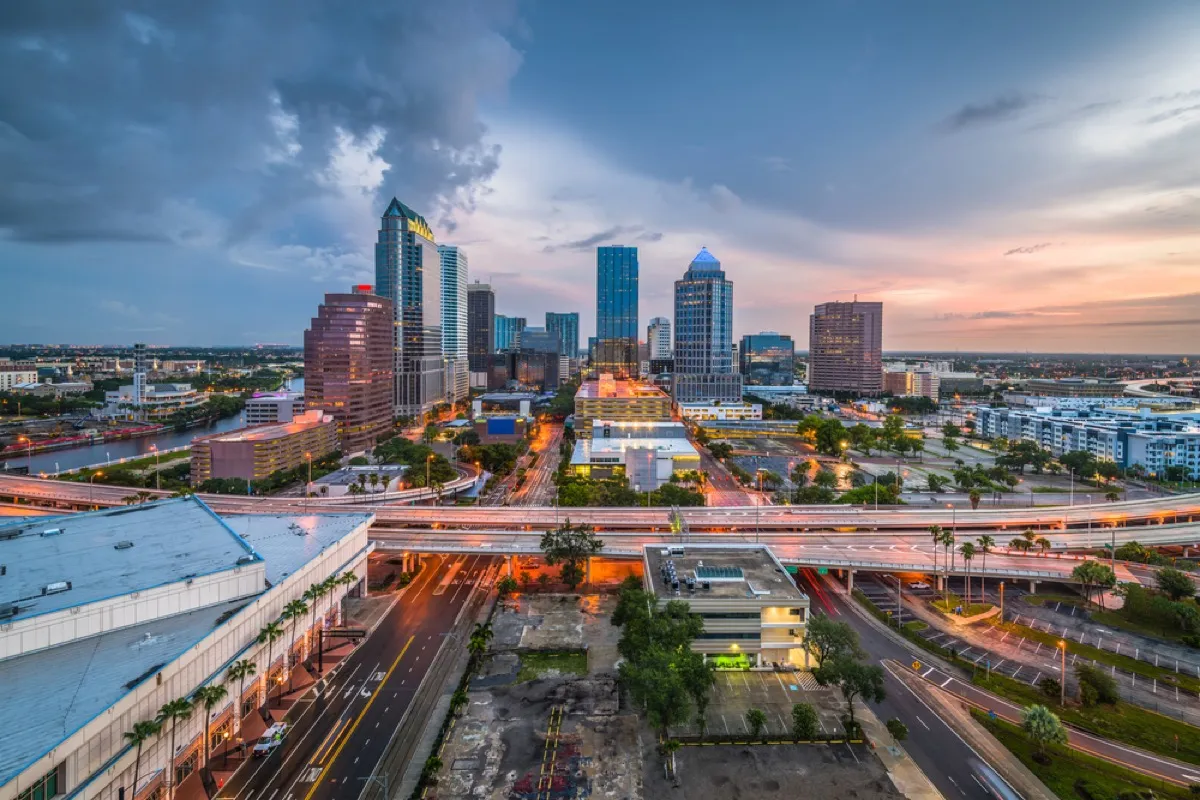
Community well-being rank: 79
Residents who are proud of their city: 60.7 percent
Population change since 2010: +19.06 percent
Favorability scale: -0.1
Hate Index Score: 34.67
27
Norfolk, Virginia
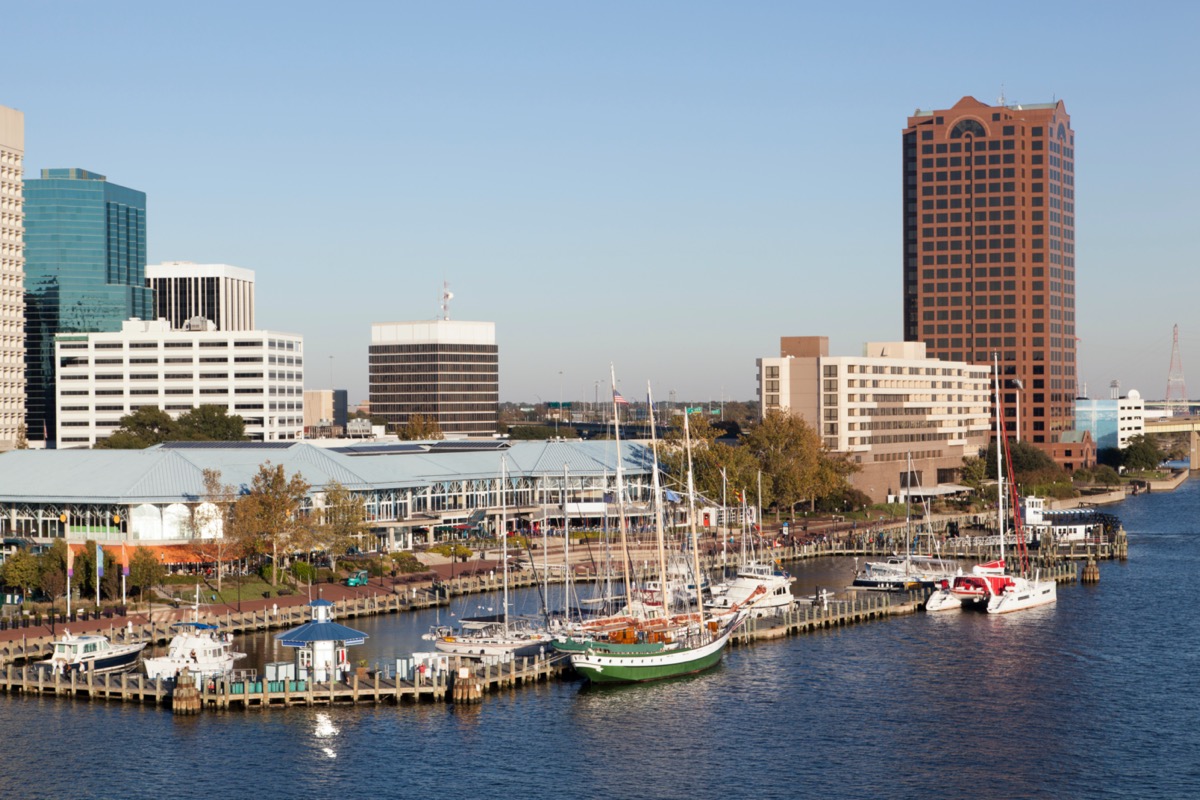
Community well-being rank: 159
Residents who are proud of their city: 56.4 percent
Population change since 2010: -0.03 percent
Favorability scale: 12.3
Hate Index Score: 35.98
26
Columbus, Ohio
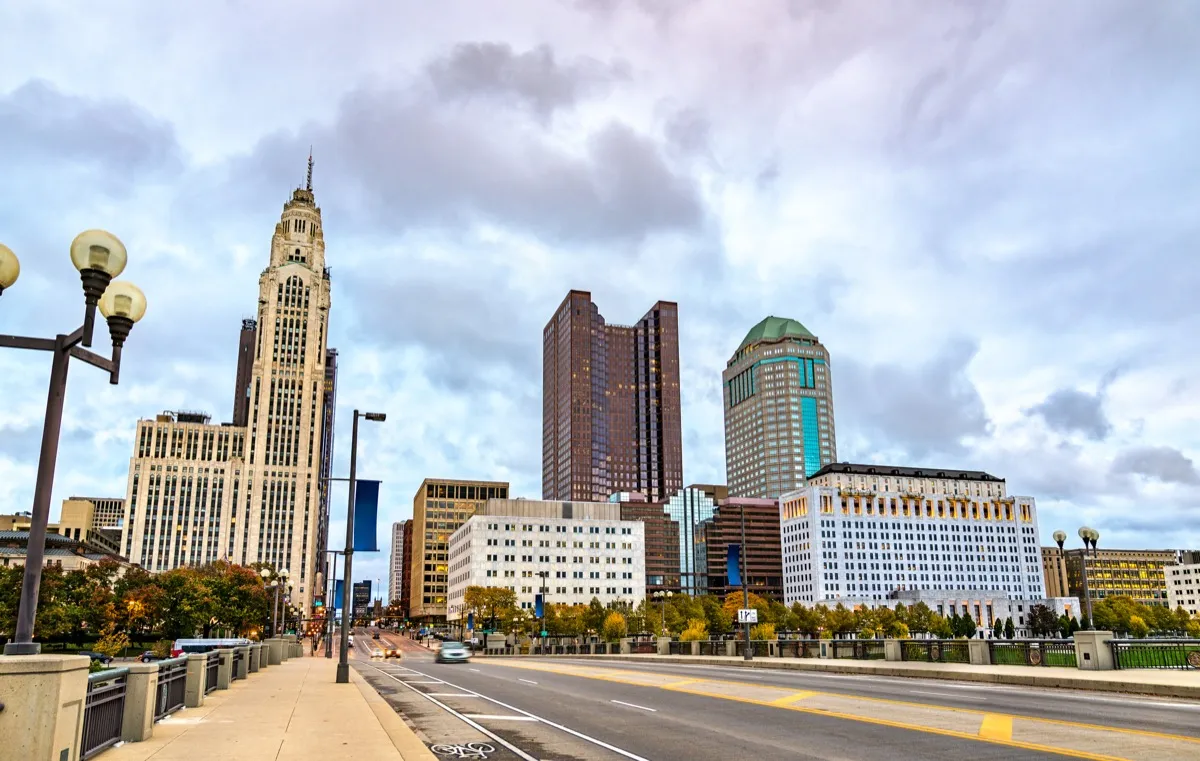
Community well-being rank: 103
Residents who are proud of their city: 62.2 percent
Population change since 2010: +14.17 percent
Favorability scale: -0.3
Hate Index Score: 42.03
And for the place that is most likely to blur the truth, This Is the Most Dishonest State in America.
25
Houston, Texas
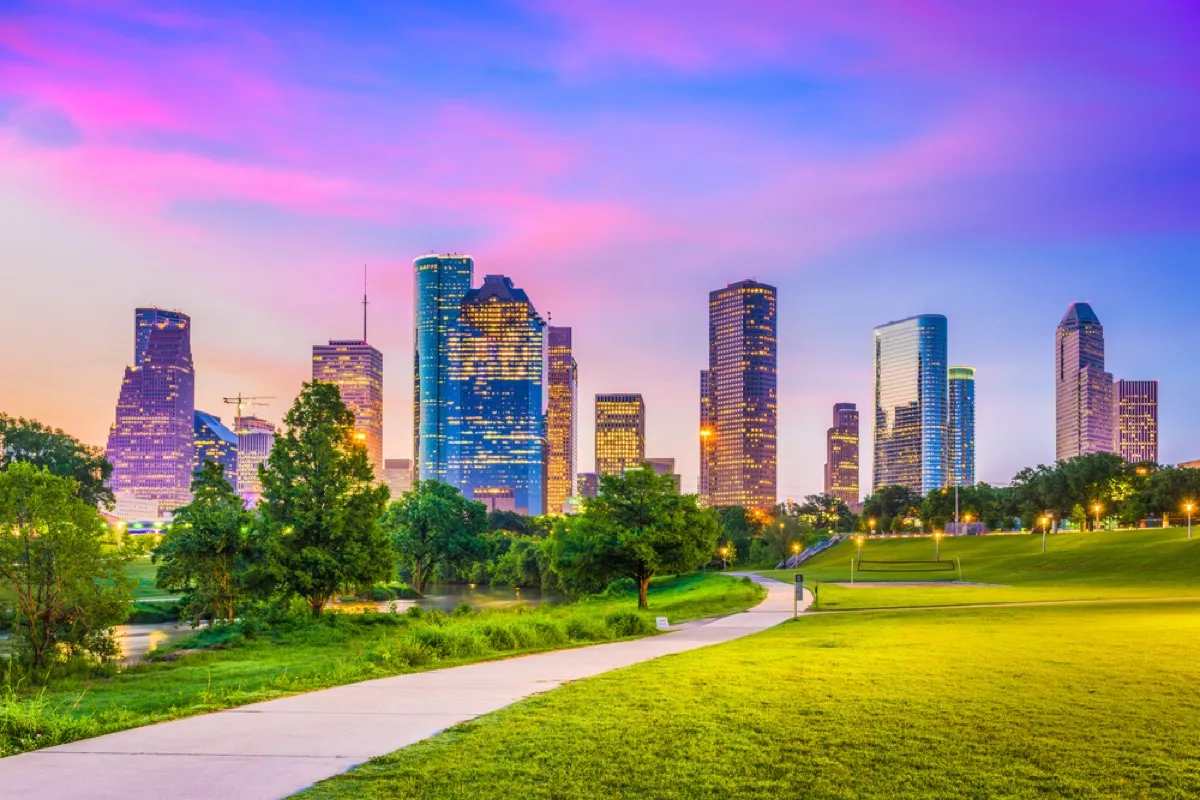
Community well-being rank: 74
Residents who are proud of their city: 65.3 percent
Population change since 2010: +10.52 percent
Favorability scale: -2.9
Hate Index Score: 42.85
24
Scottsdale, Arizona
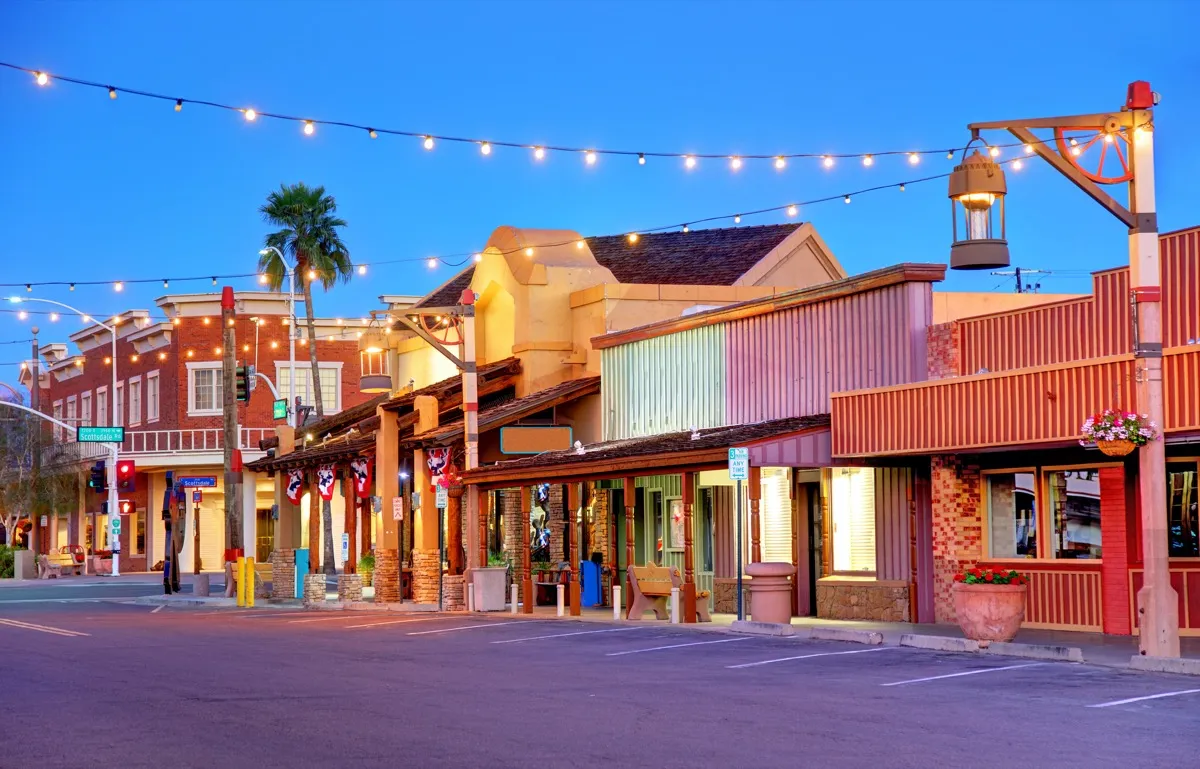
Community well-being rank: 67
Residents who are proud of their city: 62.7 percent
Population change since 2010: +18.72 percent
Favorability scale: -4.9
Hate Index Score: 44.42
23
Atlanta, Georgia
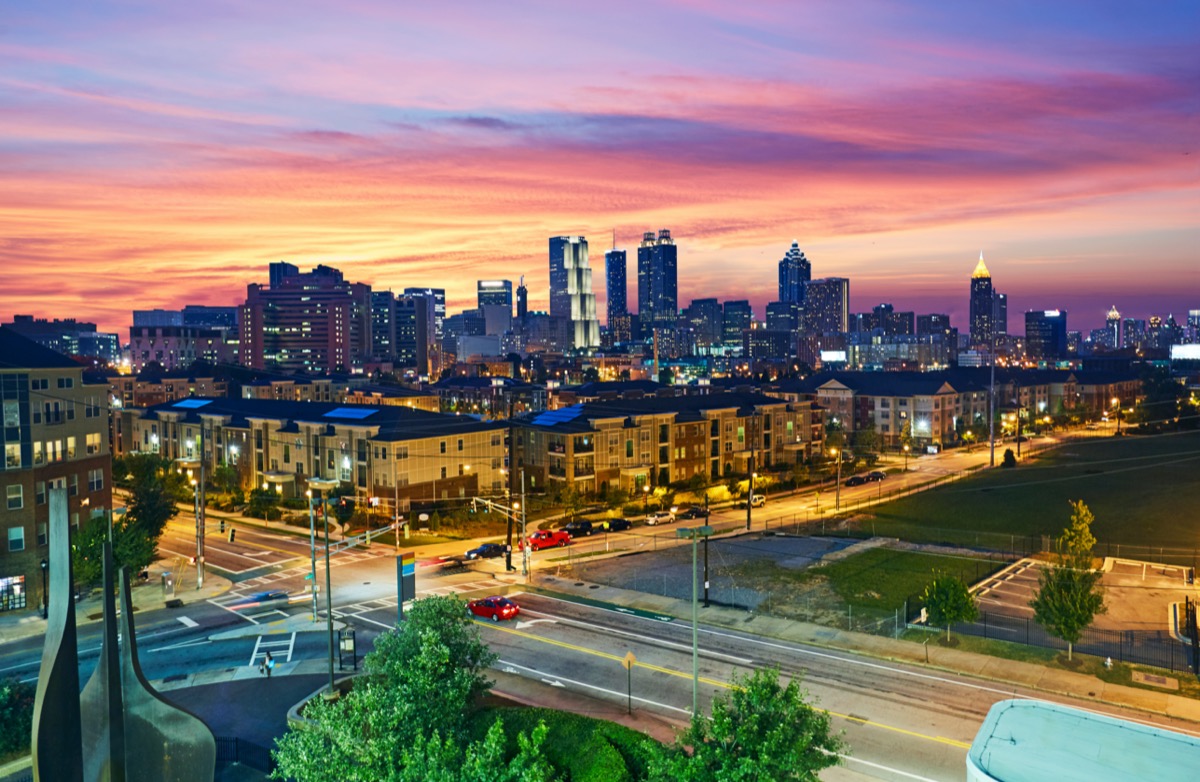
Community well-being rank: 116
Residents who are proud of their city: 62.3 percent
Population change since 2010: +20.67 percent
Favorability scale: -2.1
Hate Index Score: 44.53
22
New Orleans, Louisiana
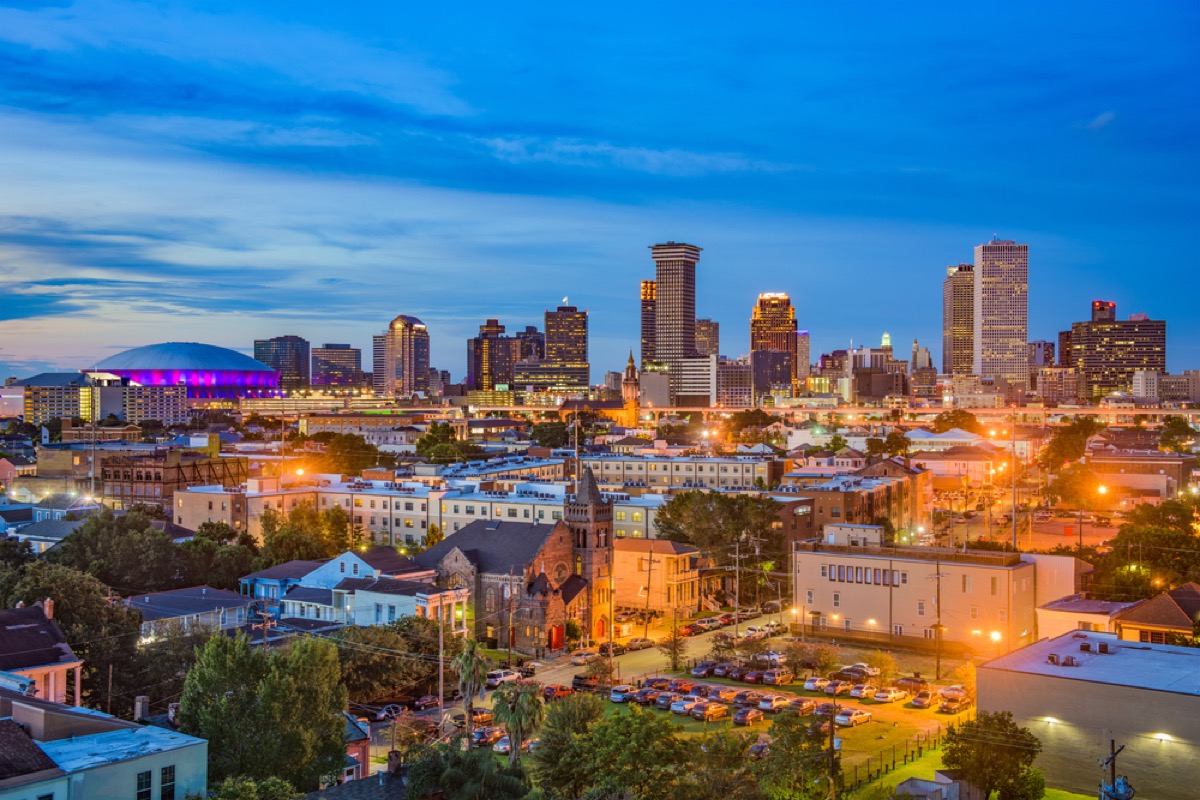
Community well-being rank: 173
Residents who are proud of their city: 61.3 percent
Population change since 2010: +13.47 percent
Favorability scale: 3.6
Hate Index Score: 46.06
21
Pittsburgh, Pennsylvania
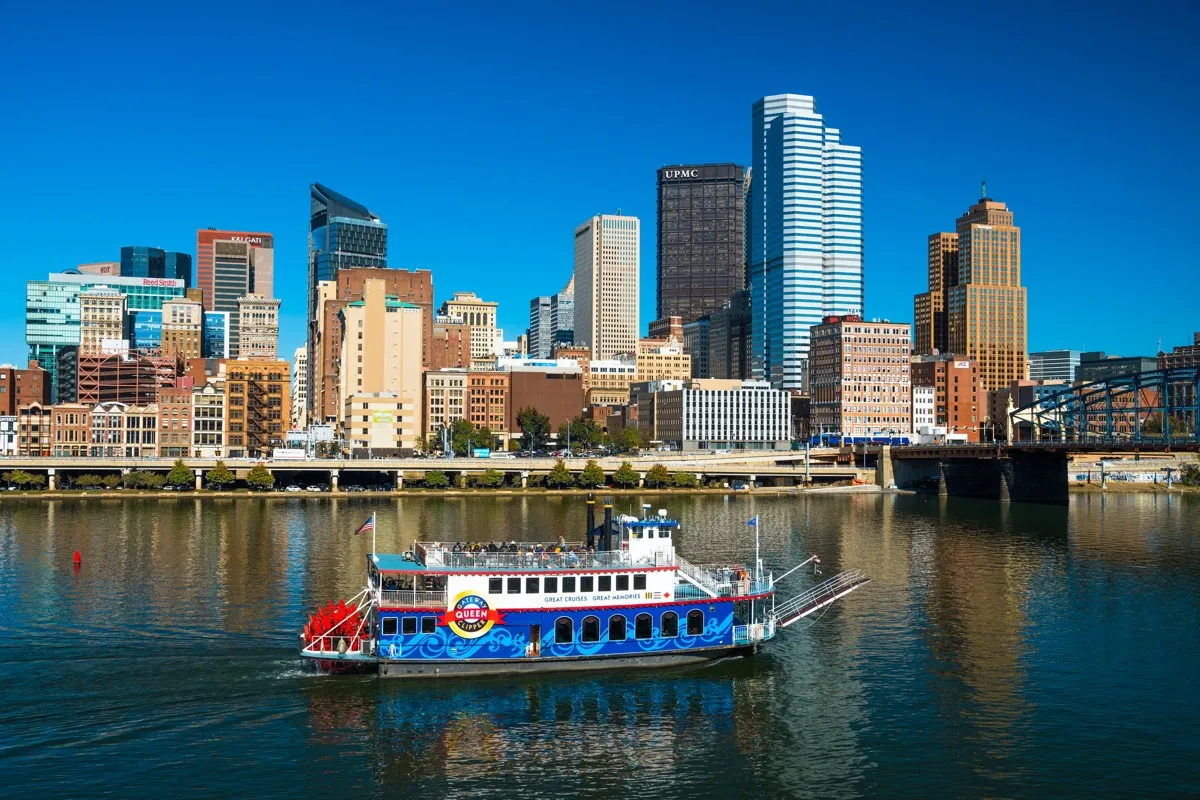
Community well-being rank: 69
Residents who are proud of their city: 61.4 percent
Population change since 2010: -1.77 percent
Favorability scale: 1.3
Hate Index Score: 46.17
20
Phoenix, Arizona
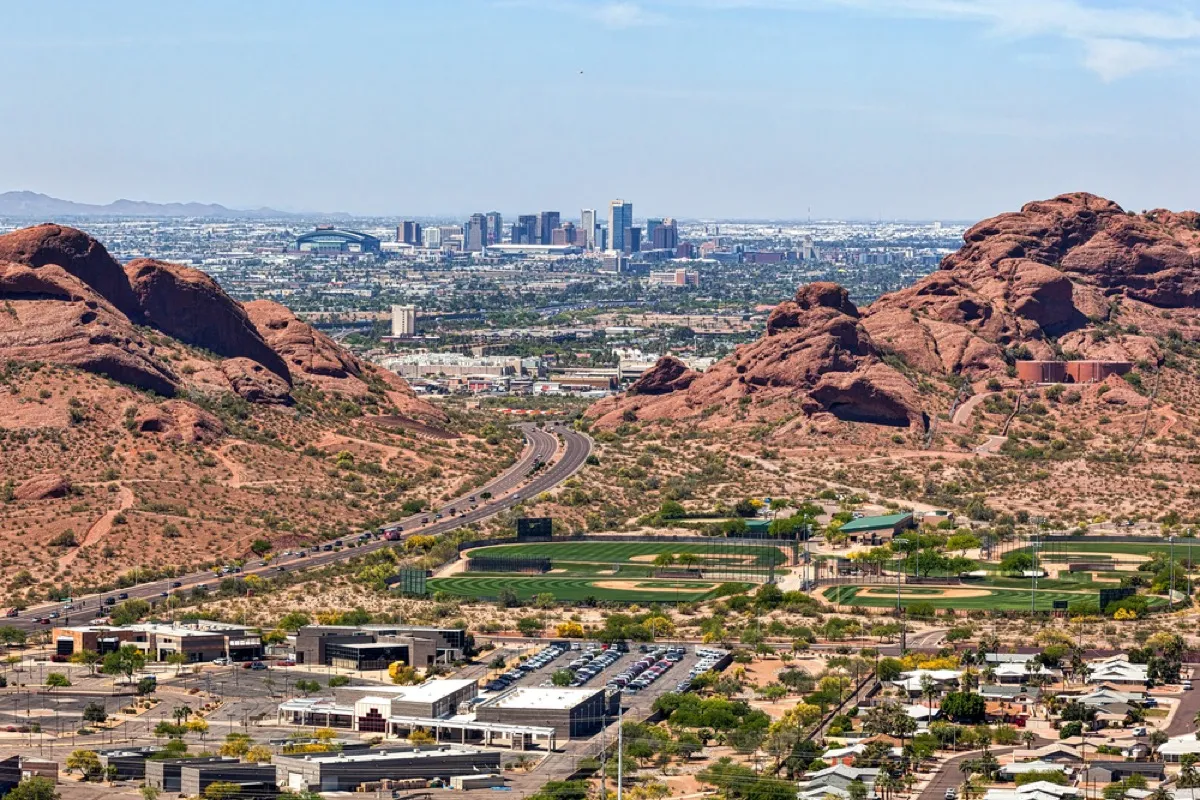
Community well-being rank: 67
Residents who are proud of their city: 62.7 percent
Population change since 2010: +16.28 percent
Favorability scale: -5.3
Hate Index Score: 47.83
19
Sacramento, California
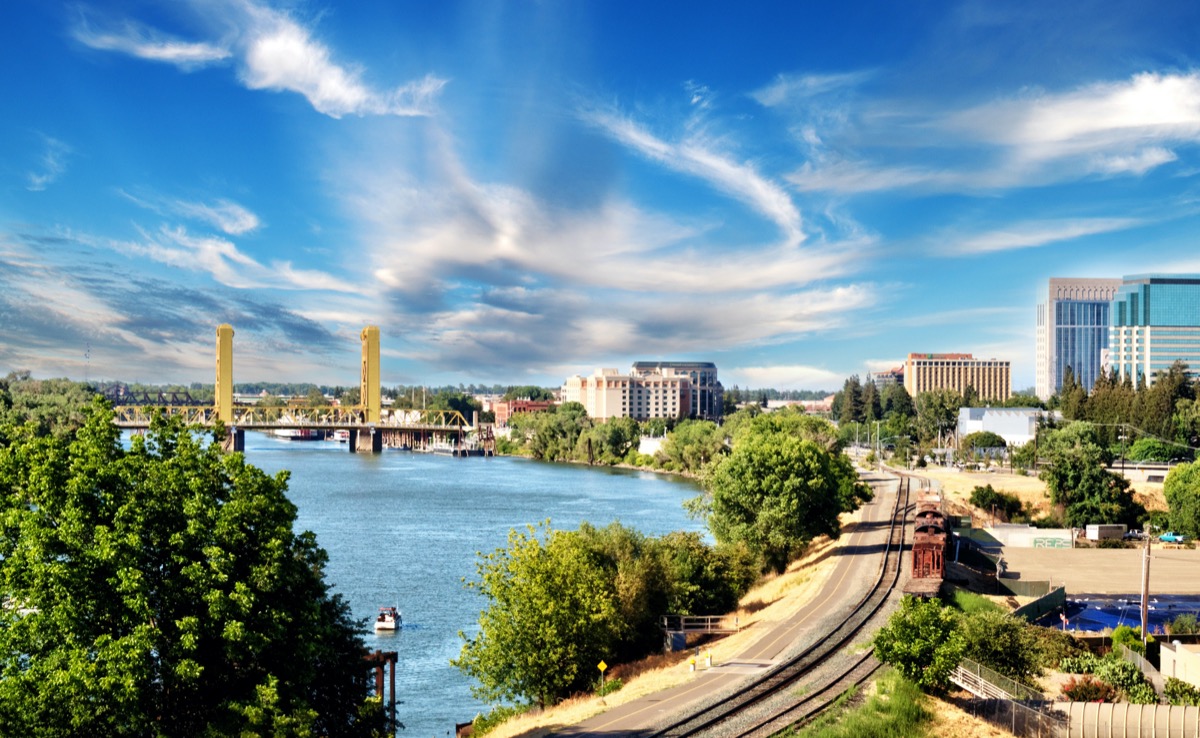
Community well-being rank: 96
Residents who are proud of their city: 61.7 percent
Population change since 2010: +10.10 percent
Favorability scale: -1.4
Hate Index Score: 48.67
18
Milwaukee, Wisconsin
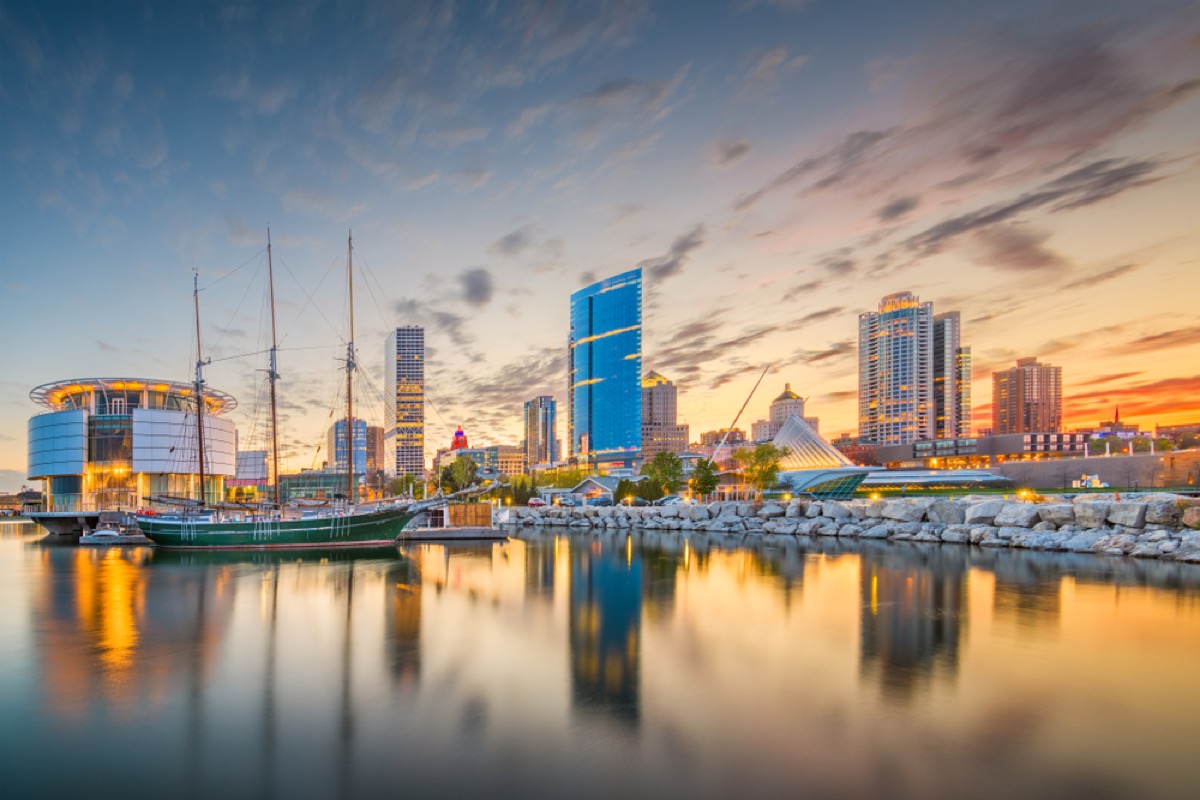
Community well-being rank: 124
Residents who are proud of their city: 62.5 percent
Population change since 2010: -0.79 percent
Favorability scale: 2.8
Hate Index Score: 49.96
17
Charlotte, North Carolina
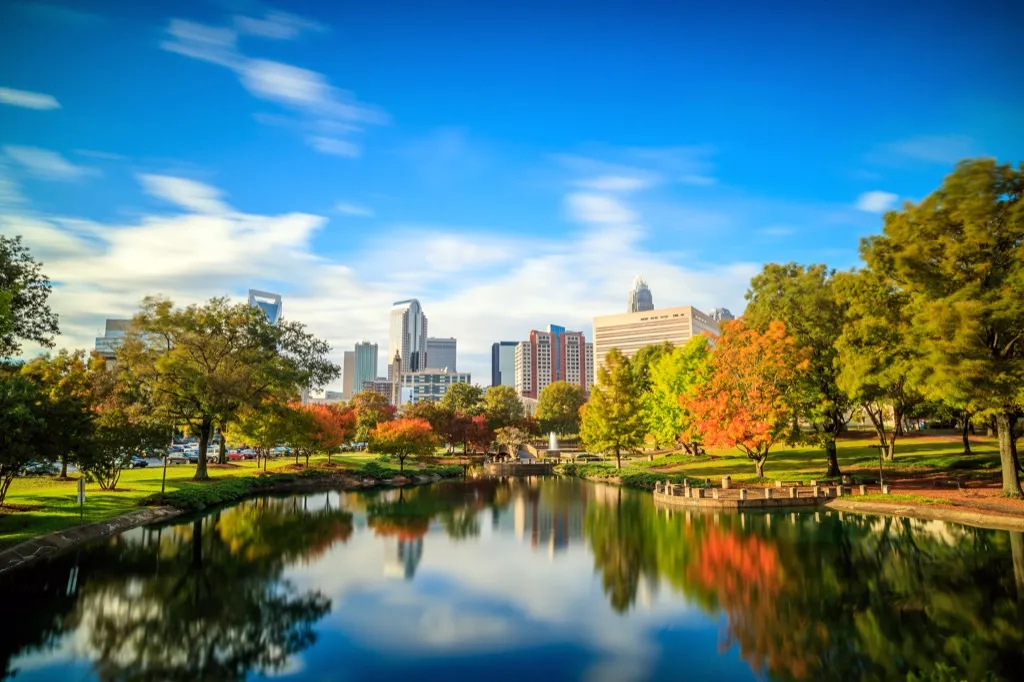
Community well-being rank: 62
Residents who are proud of their city: 66.3 percent
Population change since 2010: +21.09 percent
Favorability scale: -10.1
Hate Index Score: 52.15
16
Boston, Massachusetts
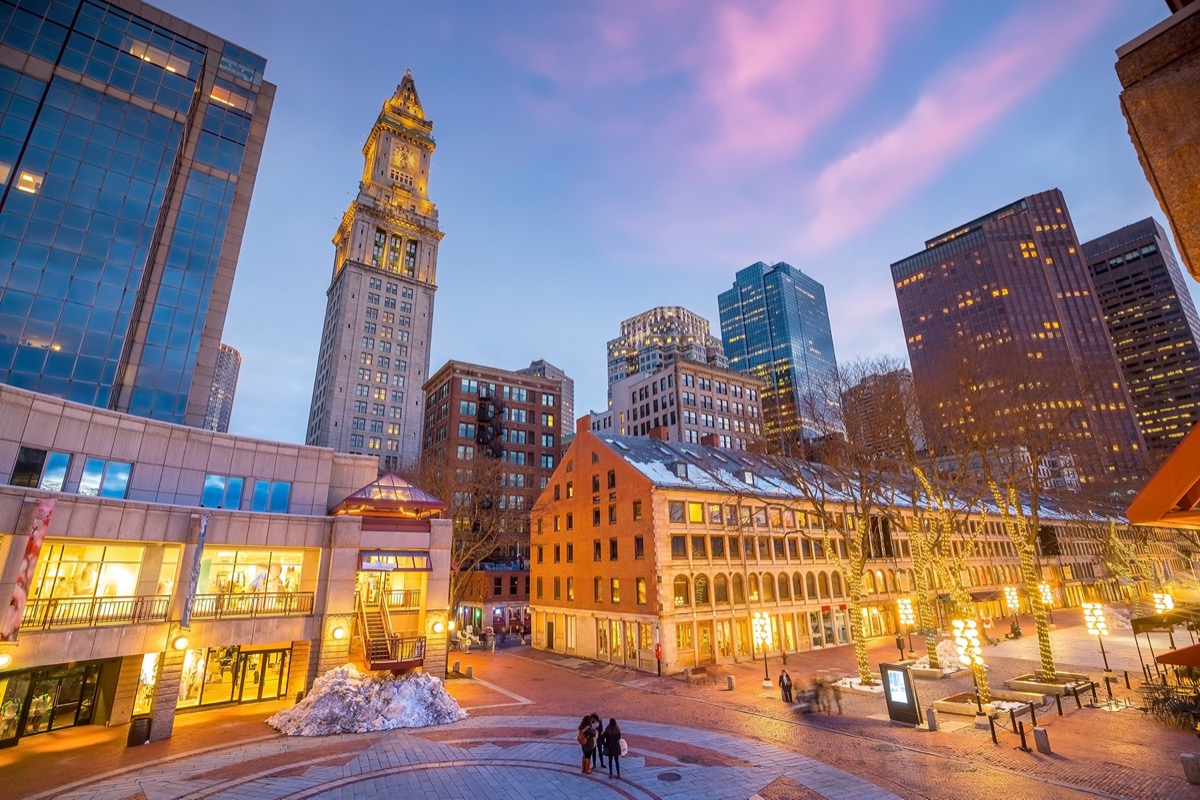
Community well-being rank: 51
Residents who are proud of their city: 67.0 percent
Population change since 2010: +12.14 percent
Favorability scale: -9.1
Hate Index Score: 53.79
15
Cleveland, Ohio
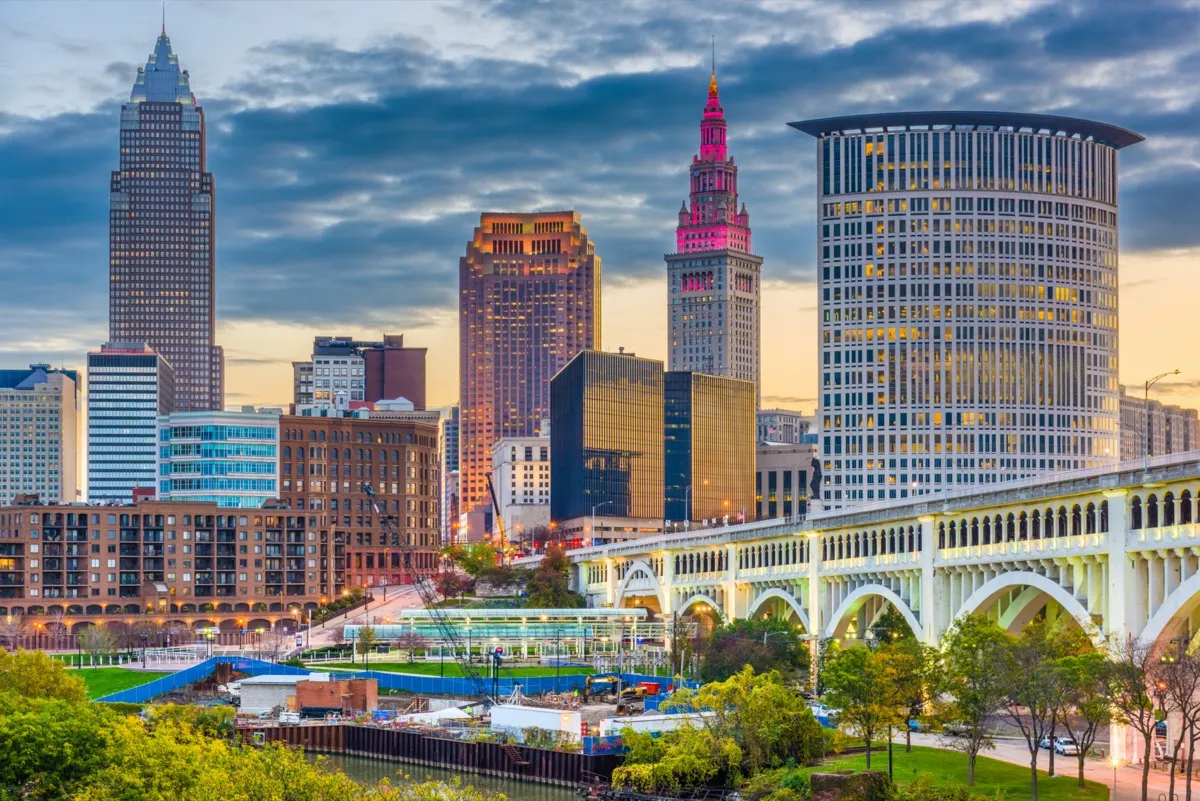
Community well-being rank: 138
Residents who are proud of their city: 58.8 percent
Population change since 2010: -3.98 percent
Favorability scale: 5.0
Hate Index Score: 54.48
And for the states where cheaters run rampant, check out This Is the Most Adulterous State in America.
14
Chicago, Illinois
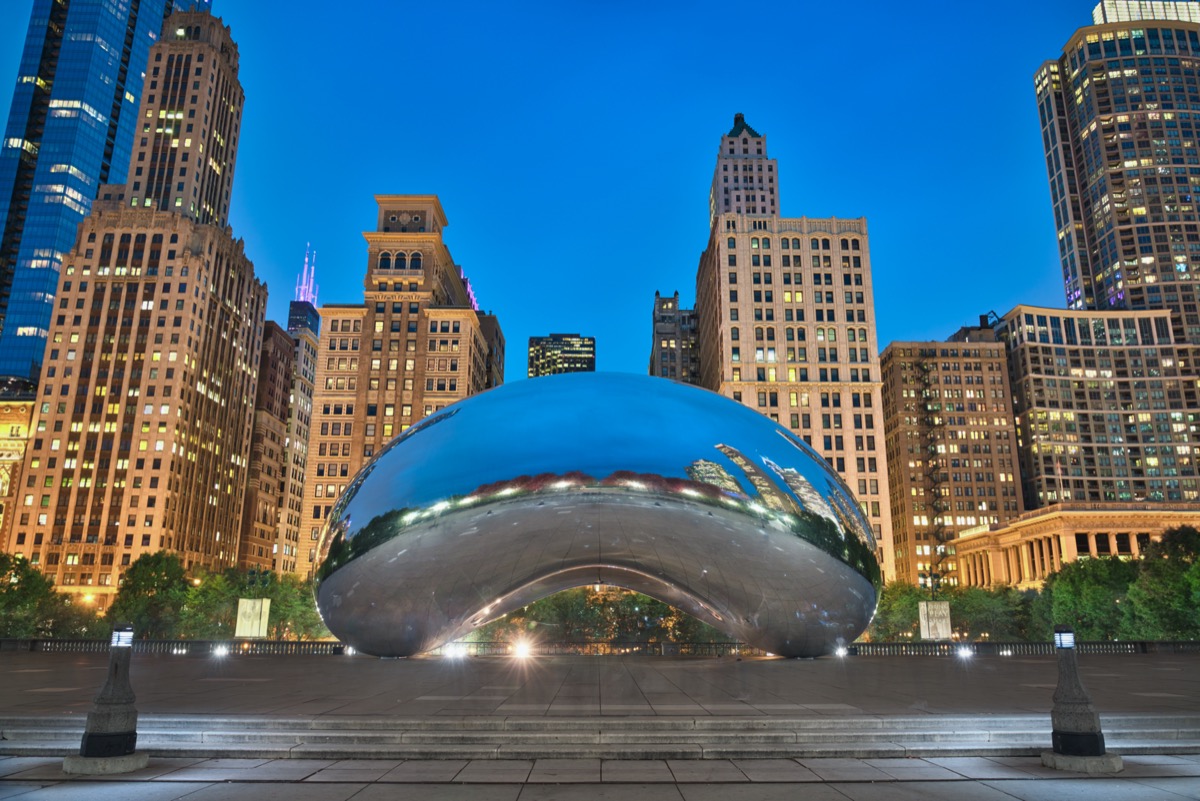
Community well-being rank: 146
Residents who are proud of their city: 58.5 percent
Population change since 2010: -0.06 percent
Favorability scale: 4.4
Hate Index Score: 54.97
13
Cincinnati, Ohio
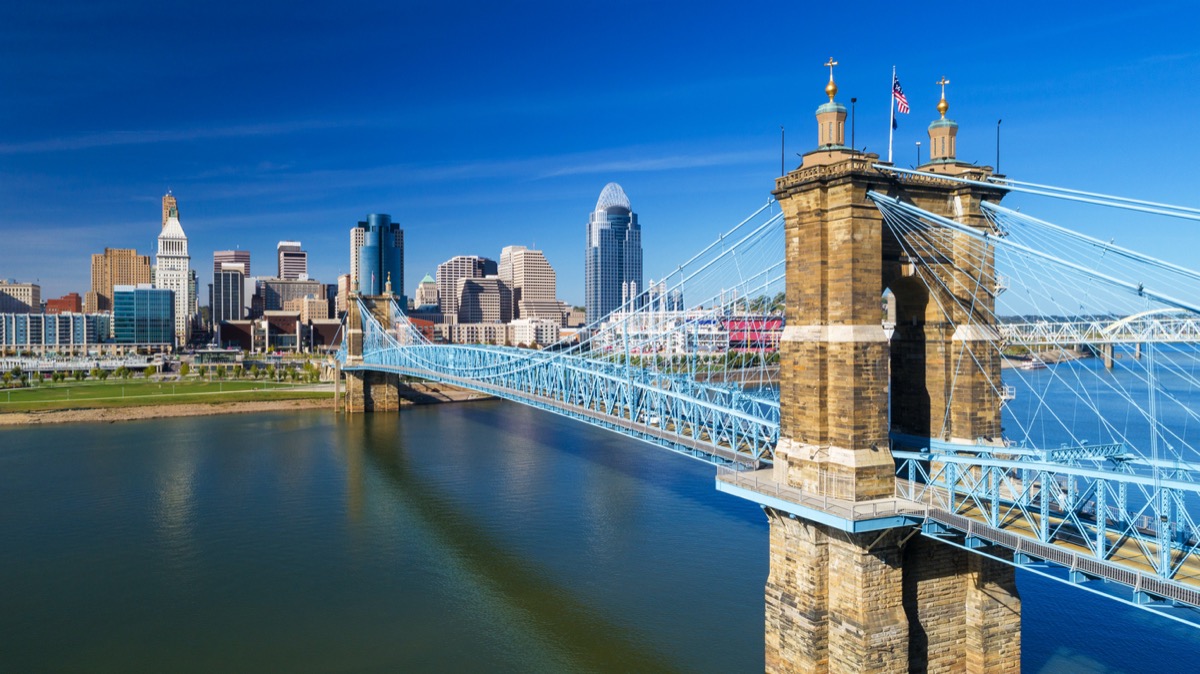
Community well-being rank: 111
Residents who are proud of their city: 60.1 percent
Population change since 2010: +2.36 percent
Favorability scale: -0.5
Hate Index Score: 58.55
12
Dallas, Texas
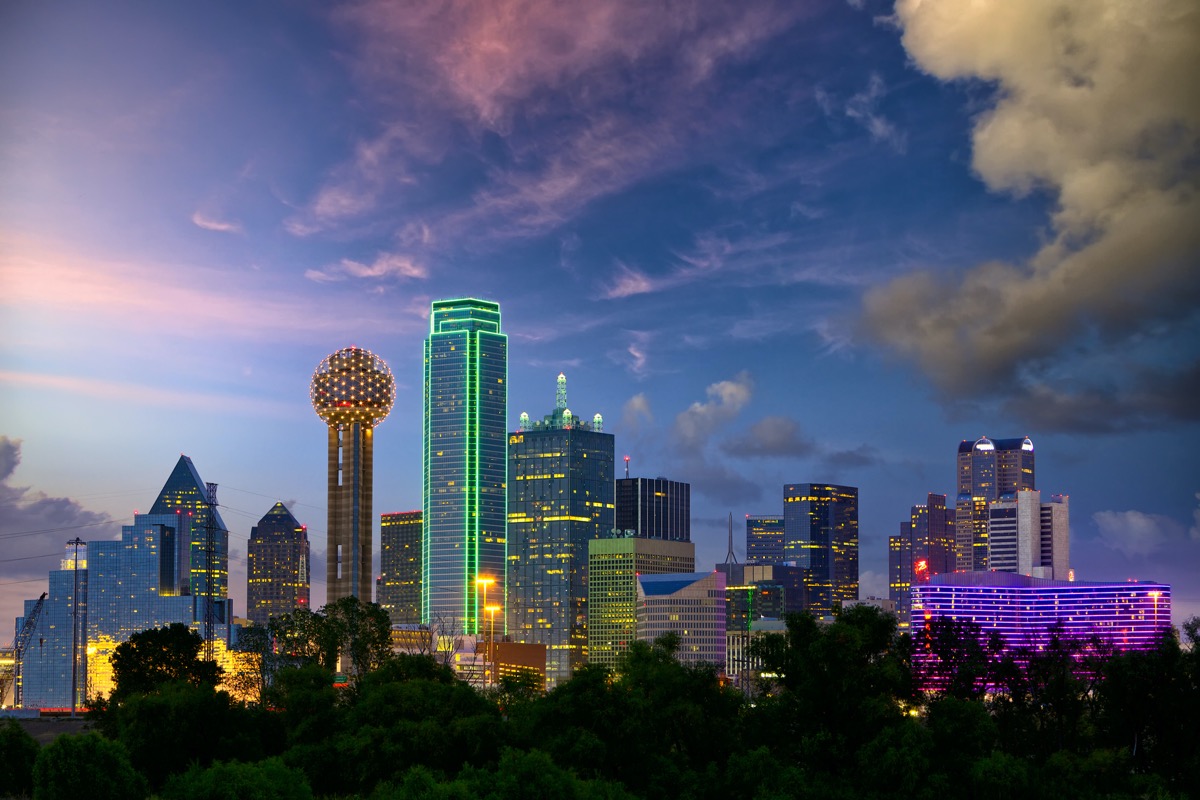
Community well-being rank: 59
Residents who are proud of their city: 66.3 percent
Population change since 2010: +12.17 percent
Favorability scale: -9.9
Hate Index Score: 58.88
11
Tucson, Arizona
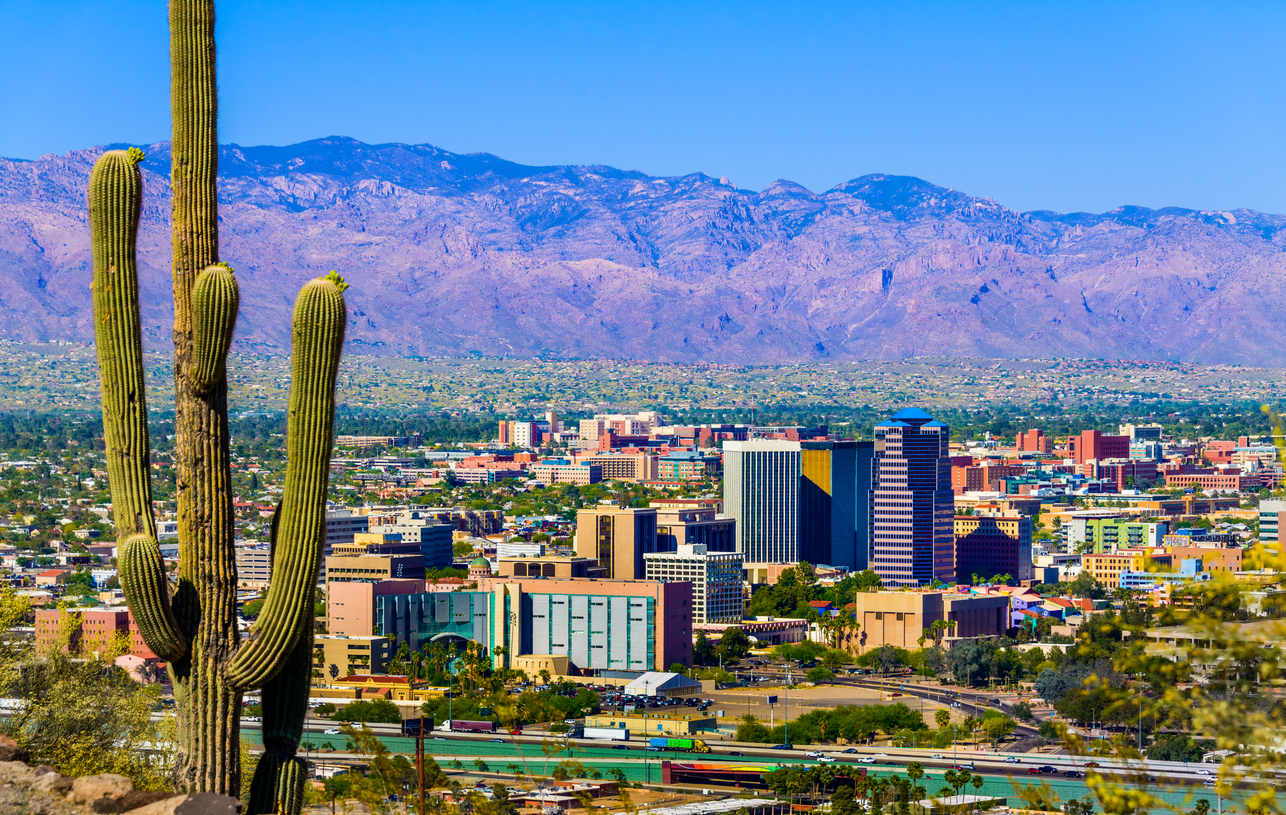
Community well-being rank: 132
Residents who are proud of their city: 58.1 percent
Population change since 2010: +5.38 percent
Favorability scale: 0.3
Hate Index Score: 60.87
10
Miami, Florida
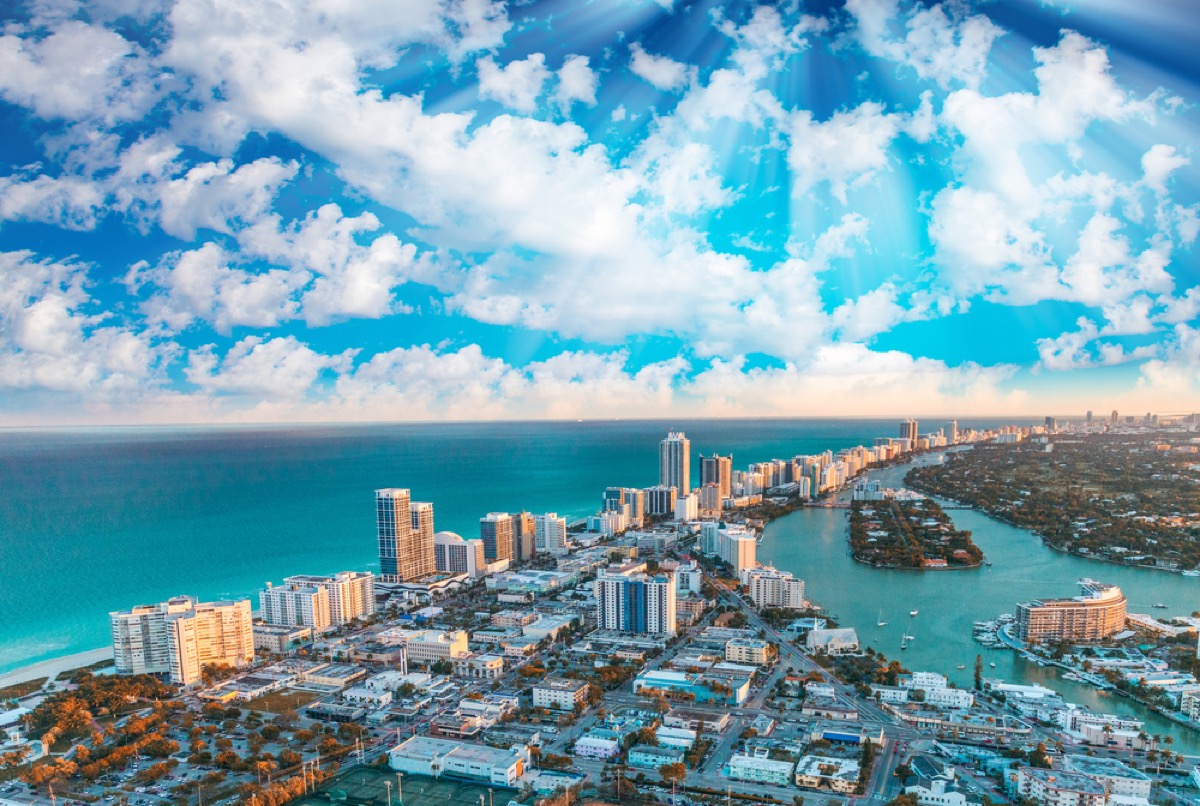
Community well-being rank: 70
Residents who are proud of their city: 63.3 percent
Population change since 2010: +17.15 percent
Favorability scale: -10.6
Hate Index Score: 63.72
9
Riverside, California
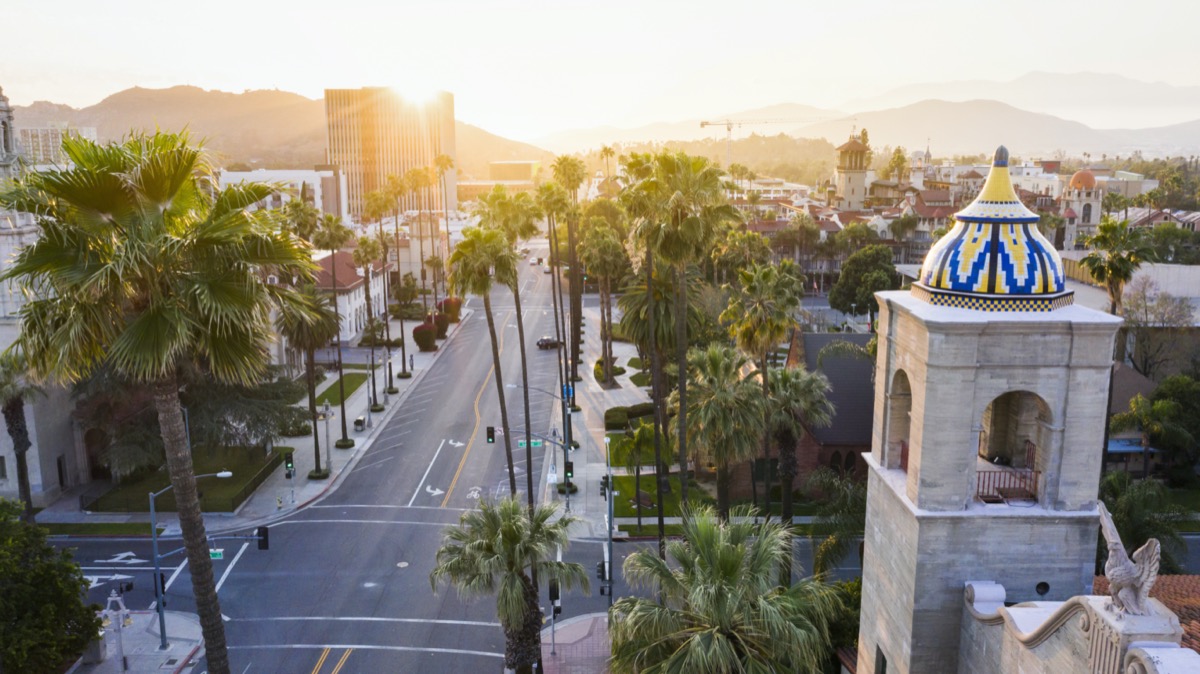
Community well-being rank: 152
Residents who are proud of their city: 59.6 percent
Population change since 2010: +9.05 percent
Favorability scale: -2.9
Hate Index Score: 69.11
8
Colorado Springs, Colorado
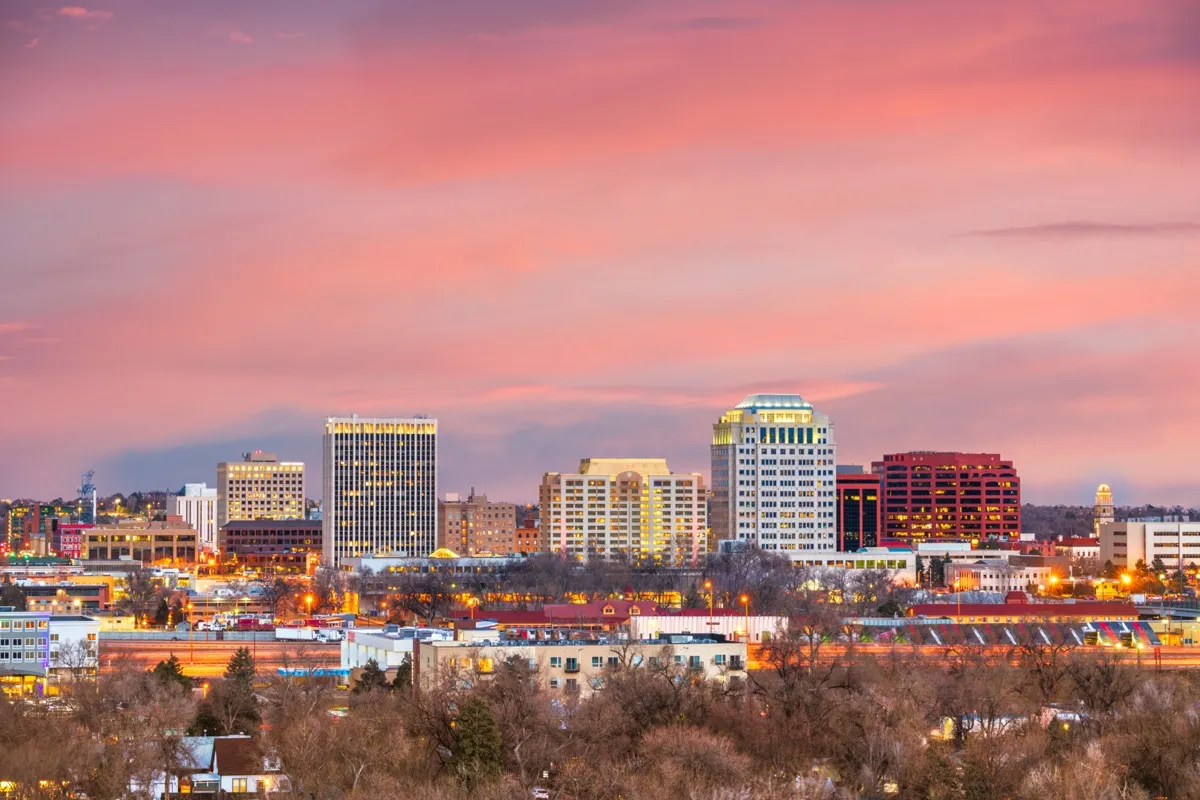
Community well-being rank: 68
Residents who are proud of their city: 62.4 percent
Population change since 2010: +14.84 percent
Favorability scale: -11.4
Hate Index Score: 69.22
Want more state facts and guides sent to you directly? Sign up for our daily newsletter.
7
Philadelphia, Pennsylvania
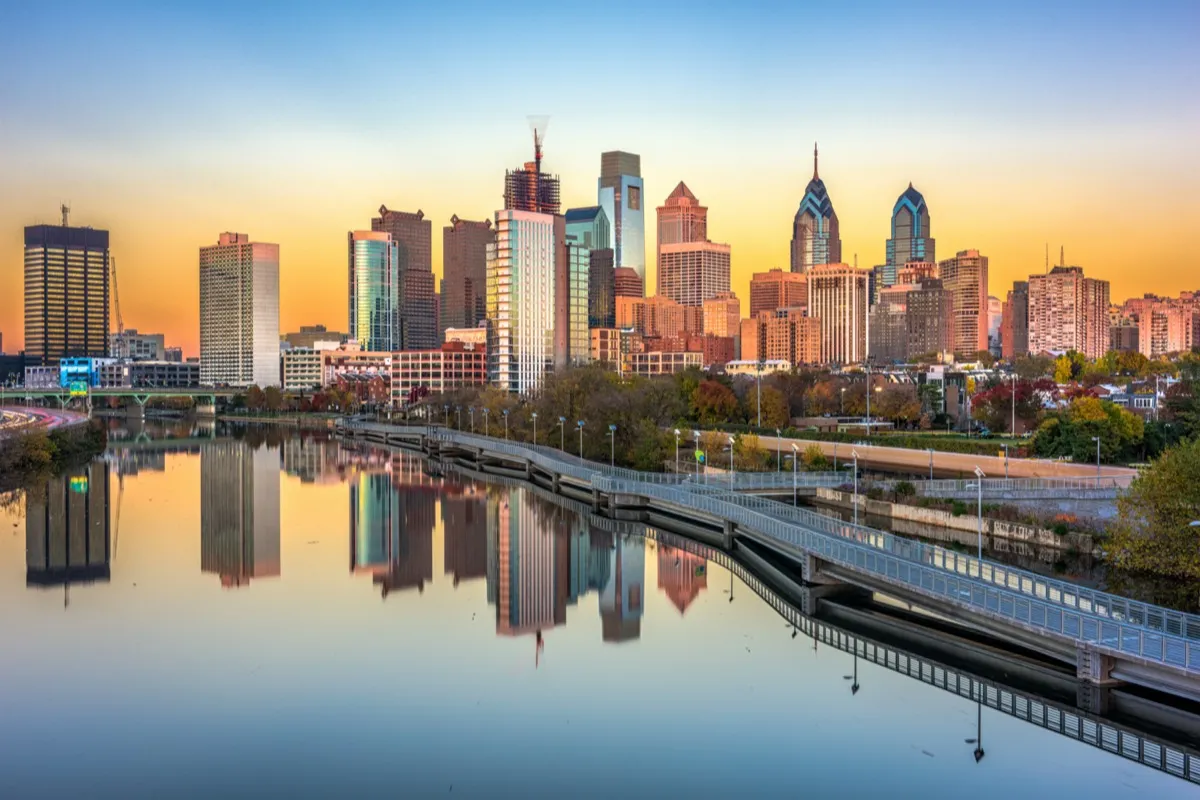
Community well-being rank: 150
Residents who are proud of their city: 58.4 percent
Population change since 2010: +3.80 percent
Favorability scale: -1.8
Hate Index Score: 71.83
6
New York, New York
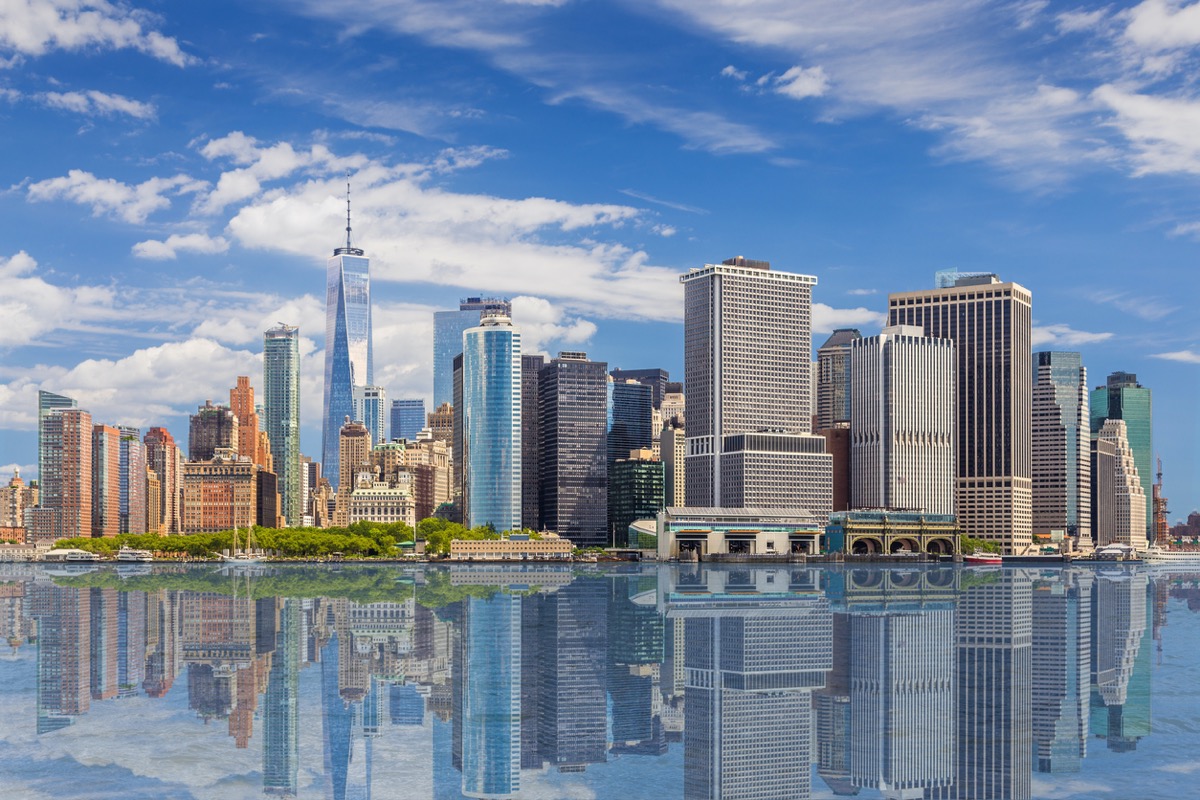
Community well-being rank: 110
Residents who are proud of their city: 59.7 percent
Population change since 2010: +1.98 percent
Favorability scale: -5.9
Hate Index Score: 76.36
5
St. Louis, Missouri
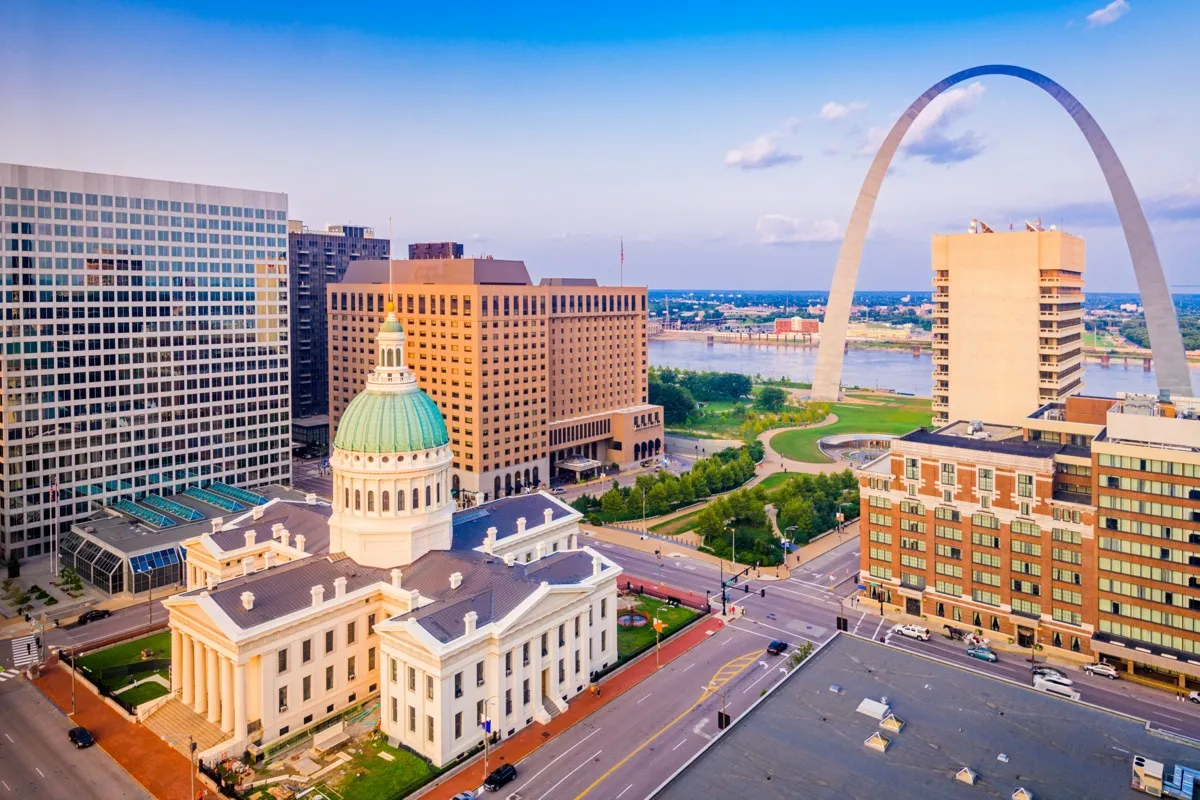
Community well-being rank: 137
Residents who are proud of their city: 60.3 percent
Population change since 2010: -5.86 percent
Favorability scale: -4.1
Hate Index Score: 82.50
4
Los Angeles, California
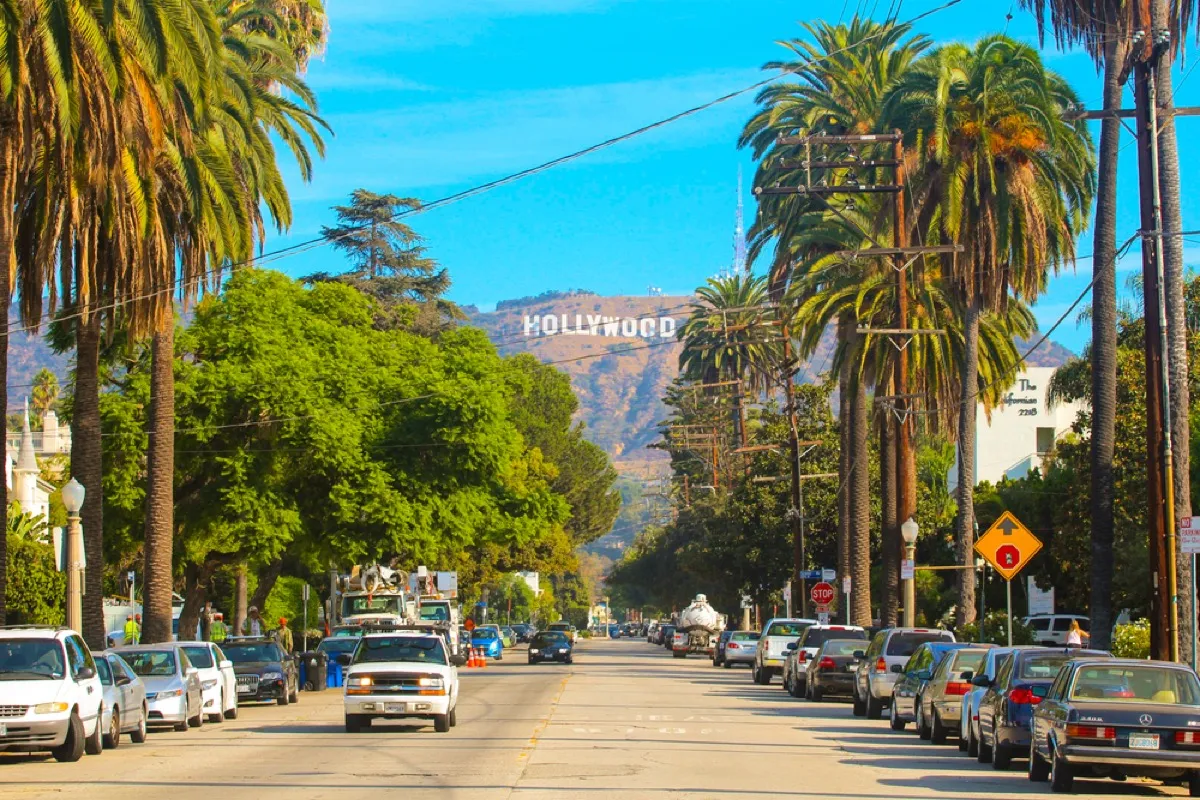
Community well-being rank: 99
Residents who are proud of their city: 63.2 percent
Population change since 2010: +4.93 percent
Favorability scale: -11.6
Hate Index Score: 84.08
3
Baltimore, Maryland
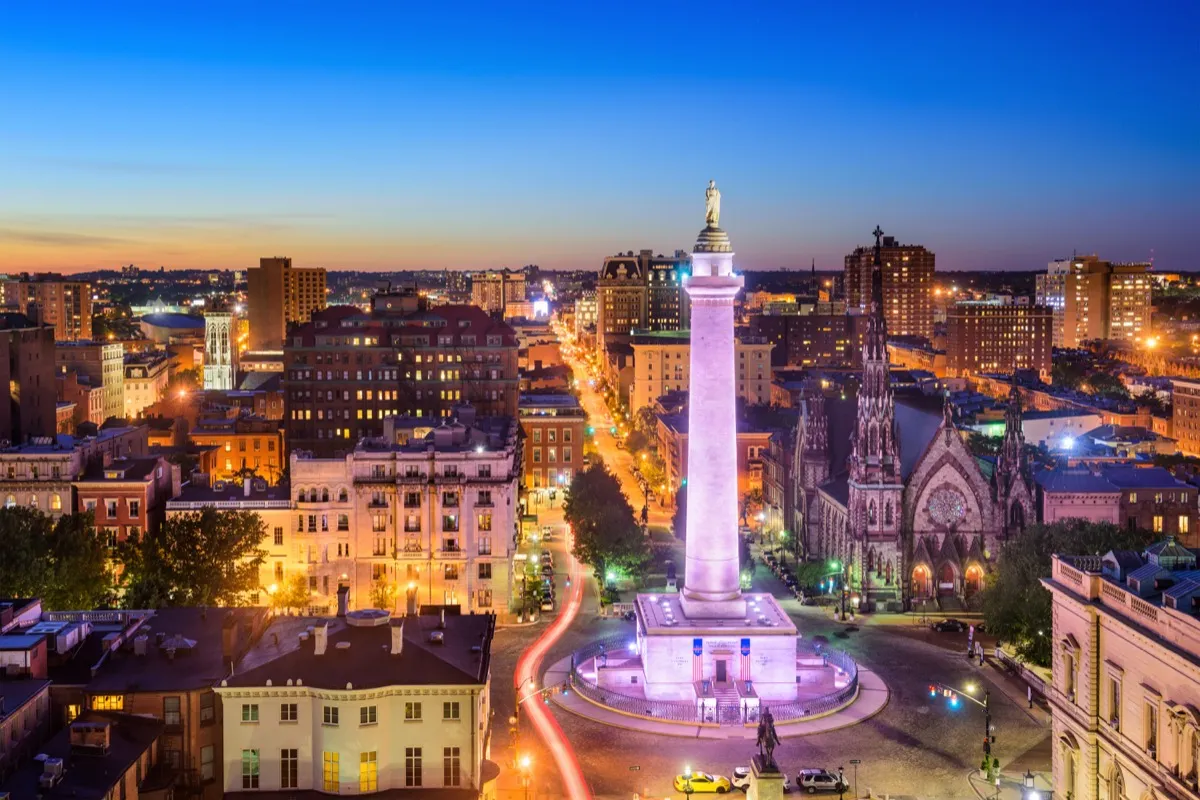
Community well-being rank: 174
Residents who are proud of their city: 57.3 percent
Population change since 2010: -4.42 percent
Favorability scale: -3.6
Hate Index Score: 91.89
2
Las Vegas, Nevada
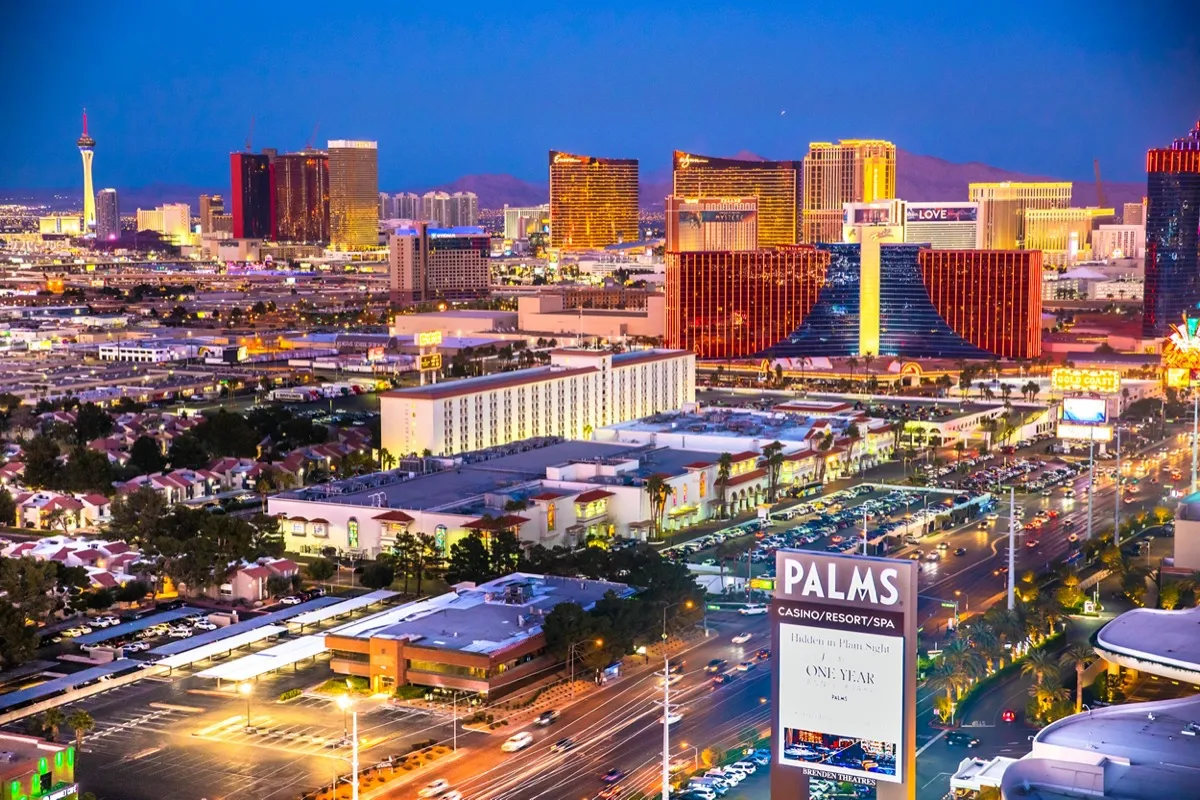
Community well-being rank: 169
Residents who are proud of their city: 58.4 percent
Population change since 2010: +11.57 percent
Favorability scale: -9.1
Hate Index Score: 91.96
1
Detroit, Michigan
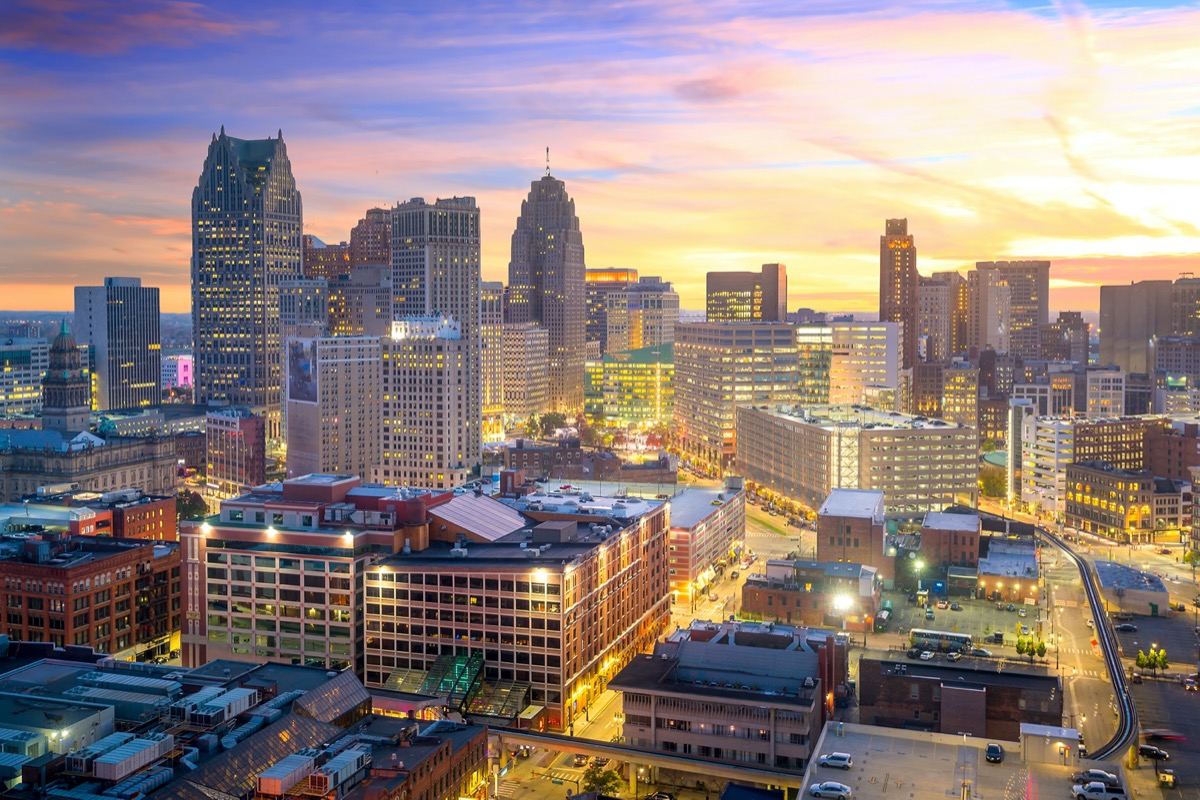
Community well-being rank: 142
Residents who are proud of their city: 59.3 percent
Population change since 2010: -6.13 percent
Favorability scale: -8.8
Hate Index Score: 100.00
And to discover where you’ll find people most active between the sheets, This Is the Most Promiscuous State in America.