This Is the Most Expensive State in America, According to Data

If there ever was a time to fantasize about packing up and setting off for greener pastures, this past year has been it. In addition to showing us all how precious life is, the pandemic proved to many Americans that remote work is no longer a fringe benefit reserved only for upper management, freelancers, or tech innovators, and now the entire US of A is your oyster. But with finances also tighter than ever for many, one key factor to consider if you’re looking to relocate is how much it’ll cost you to live somewhere new. And for that reason, we at Best Life set out to determine the most expensive state in America—as well the cheapest.
To quantify the cost of living in each state, we looked at five key metrics, which we then gave a weighted value, and applied to our exclusive algorithm to see how each state scored on our 100-point scale Expensive State Index.
First, we looked at the average home value (an average of the median top-tier home value, median single-family house value, median bottom-tier home value, and median condo value), as determined by The Ascent using 2020 data from Zillow. But, as any homeowner will tell you, the cost of owning a home doesn’t stop there. The amount of property taxes that one pays can be a significant drain on their annual income, which is why we factored in the mean effective property tax rate on owner-occupied housing (total real taxes paid, divided by total home value), using the most recent data from the U.S. Census Bureau’s “American Community Survey,” and calculated by the Tax Foundation.
We also looked to the Tax Foundation for the average state and local sales tax rate in each state, determined by a series of calculations to account for variances in city, county, and municipal rates. Finally, we collected and analyzed data on the average median annual household income in each state, provided by the U.S. Census Bureau, as well as the estimated living wage in each state from the Massachusetts Institute of Technology (MIT), which is the hourly rate that an individual must earn to support their household.
So, before you decide to make your big move a reality, read on to discover the most expensive state in America, and to see where your current state or future one falls. And to see the area you may want to avoid for another reason, check out The Most Dangerous Small Town in America, According to Data.
50
Montana
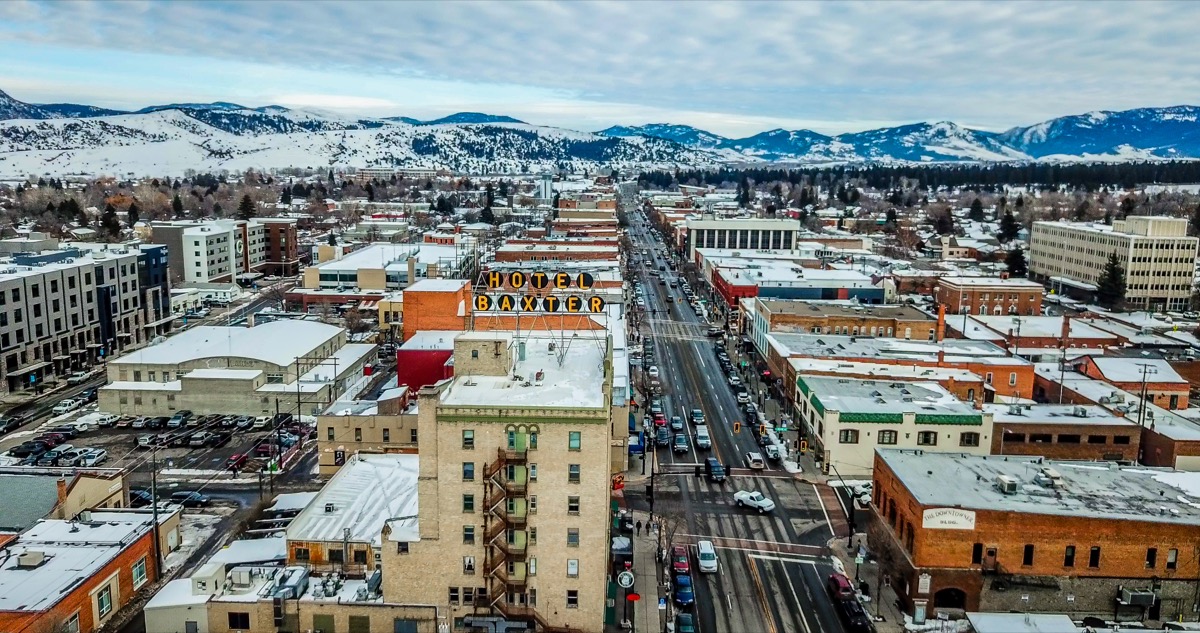
Average home value: $293,685
Average property tax rate: 0.76 percent
Average state and local sales tax rate: 0.00 percent
Estimated hourly living wage: $31.55
Annual median household income: $57,153
Expensive State Index Score: 0.00
49
West Virginia

Average home value: $107,064
Average property tax rate: 0.55 percent
Average state and local sales tax rate: 6.41 percent
Estimated hourly living wage: $30.00
Annual median household income: $48,850
Expensive State Index Score: 5.14
48
Delaware

Average home value: $262,667
Average property tax rate: 0.58 percent
Average state and local sales tax rate: 0.00 percent
Estimated hourly living wage: $33.85
Annual median household income: $70,176
Expensive State Index Score: 5.41
47
Mississippi

Average home value: $126,511
Average property tax rate: 0.76 percent
Average state and local sales tax rate: 0.00 percent
Estimated hourly living wage: $31.55
Annual median household income: $57,153
Expensive State Index Score: 9.83
46
Kentucky
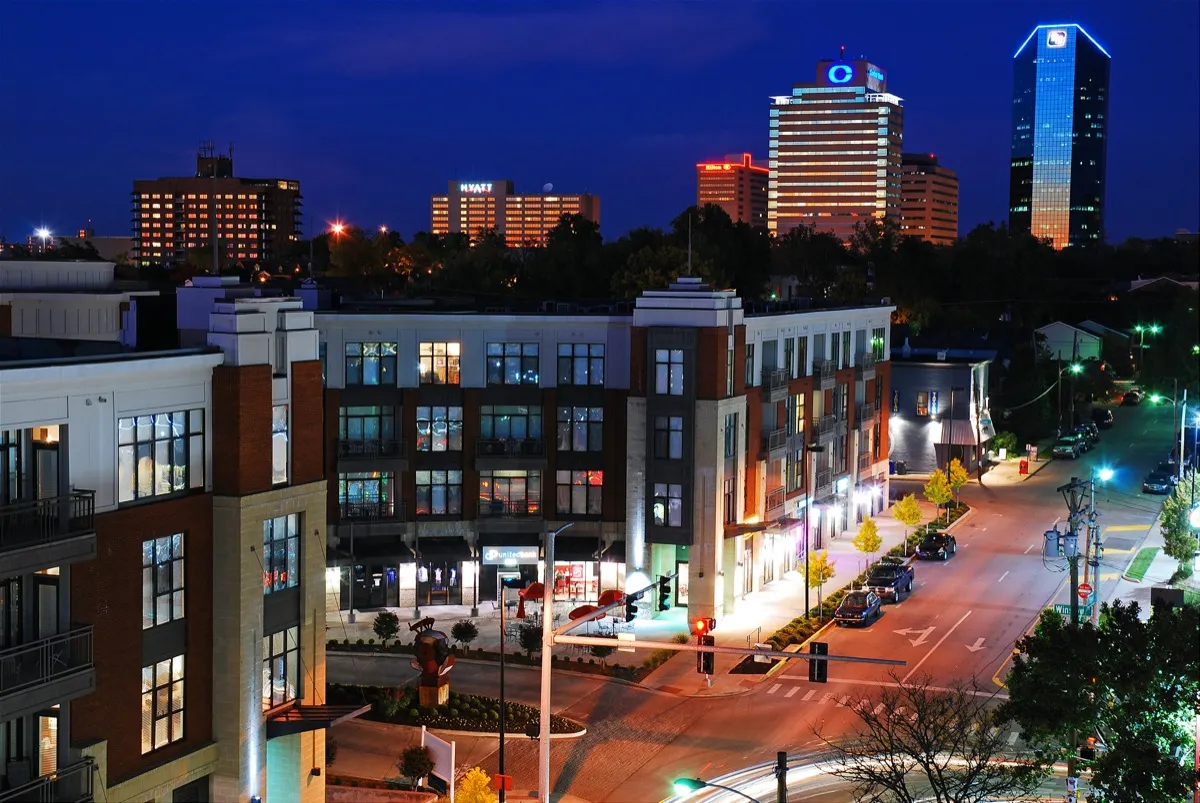
Average home value: $150,918
Average property tax rate: 0.82 percent
Average state and local sales tax rate: 6.00 percent
Estimated hourly living wage: $30.28
Annual median household income: $52,295
Expensive State Index Score: 13.01
45
Oregon

Average home value: $350,044
Average property tax rate: 0.98 percent
Average state and local sales tax rate: 0.00 percent
Estimated hourly living wage: $35.64
Annual median household income: $65,058
Expensive State Index Score: 19.47
44
Indiana

Average home value: $161,106
Average property tax rate: 0.87 percent
Average state and local sales tax rate: 7.00 percent
Estimated hourly living wage: $30.14
Annual median household income: $57,603
Expensive State Index Score: 23.38
43
Alaska

Average home value: $297,111
Average property tax rate: 1.02 percent
Average state and local sales tax rate: 1.76 percent
Estimated hourly living wage: $31.66
Annual median household income: $75,463
Expensive State Index Score: 24.76
42
Alabama
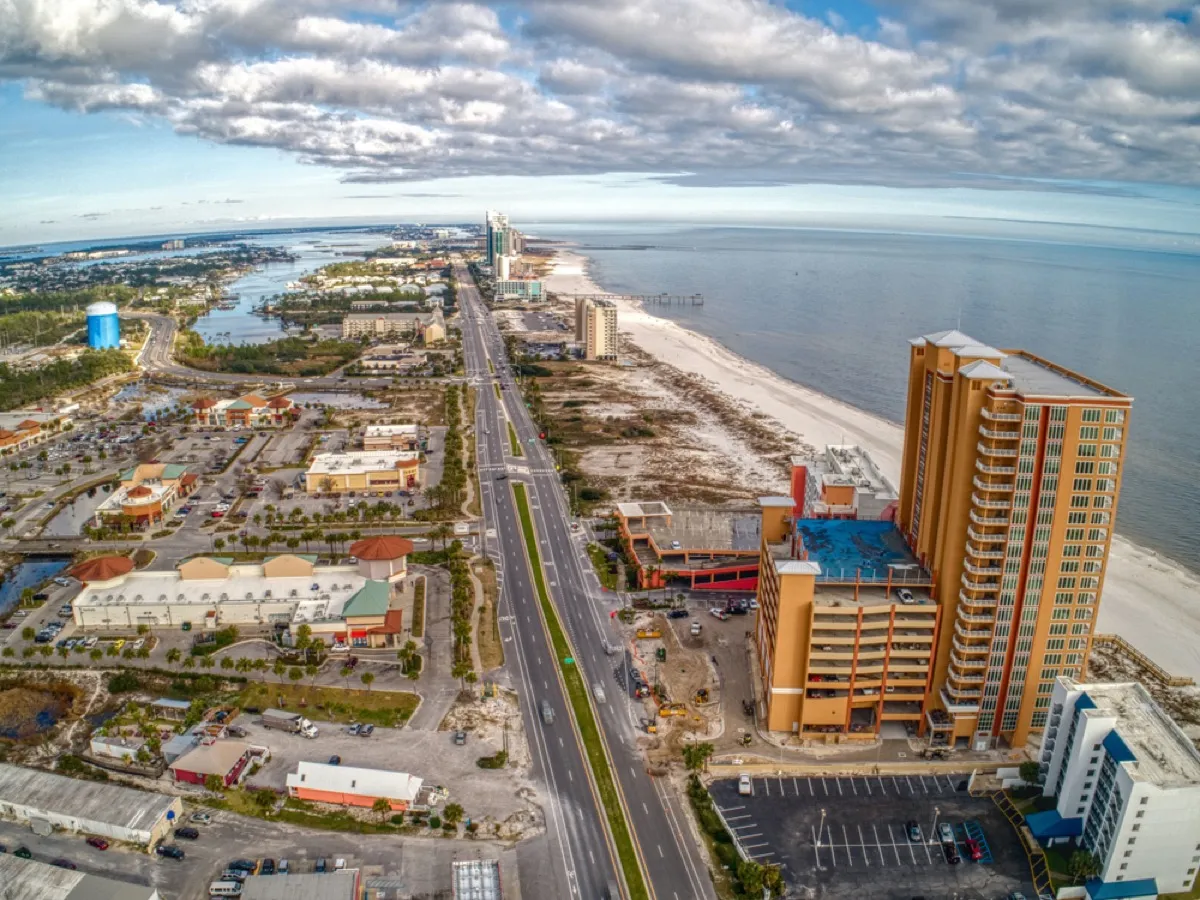
Average home value: $147,539
Average property tax rate: 0.40 percent
Average state and local sales tax rate: 9.22 percent
Estimated hourly living wage: $30.04
Annual median household income: $51,734
Expensive State Index Score: 24.86
41
Wyoming
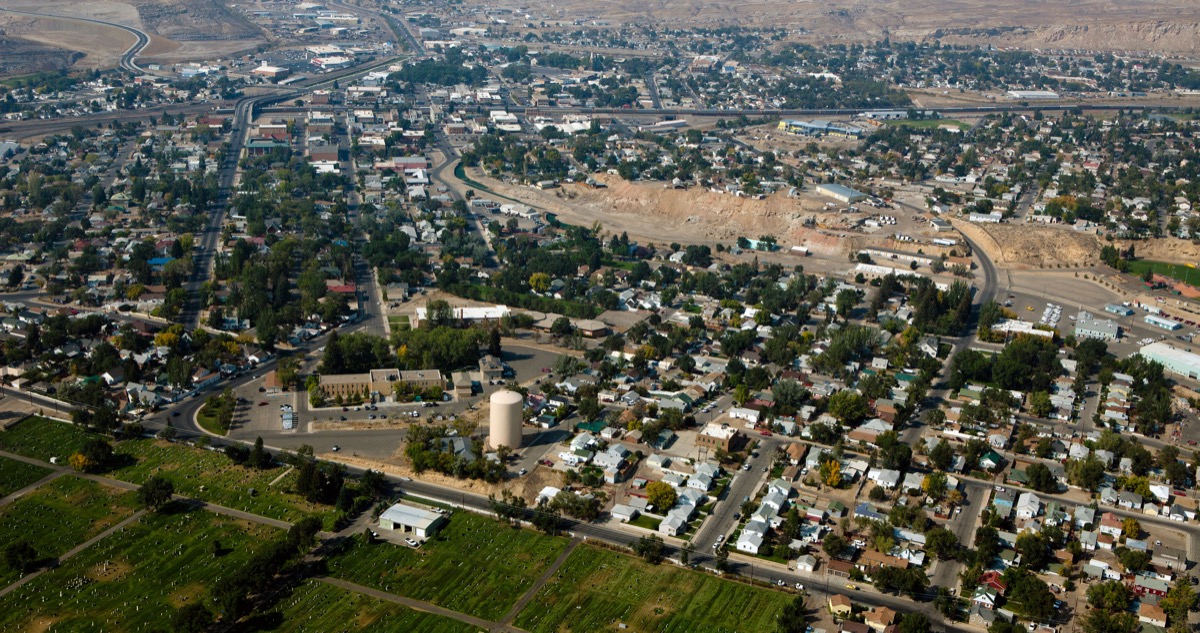
Average home value: $254,753
Average property tax rate: 0.55 percent
Average state and local sales tax rate: 5.34 percent
Estimated hourly living wage: $29.53
Annual median household income: $65,003
Expensive State Index Score: 25.62
40
Arkansas

Average home value: $131,837
Average property tax rate: 0.64 percent
Average state and local sales tax rate: 9.47 percent
Estimated hourly living wage: $30.85
Annual median household income: $48,952
Expensive State Index Score: 25.85
39
Michigan

Average home value: $180,404
Average property tax rate: 1.44 percent
Average state and local sales tax rate: 6.00 percent
Estimated hourly living wage: $29.66
Annual median household income: $59,584
Expensive State Index Score: 26.98
38
New Hampshire

Average home value: $303,875
Average property tax rate: 2.03 percent
Average state and local sales tax rate: 0.00 percent
Estimated hourly living wage: $30.96
Annual median household income: $77,933
Expensive State Index Score: 27.70
37
South Carolina

Average home value: $193,491
Average property tax rate: 0.56 percent
Average state and local sales tax rate: 7.46 percent
Estimated hourly living wage: $33.18
Annual median household income: $56,227
Expensive State Index Score: 27.72
36
New Mexico

Average home value: $214,213
Average property tax rate: 0.68 percent
Average state and local sales tax rate: 7.82 percent
Estimated hourly living wage: $31.58
Annual median household income: $51,945
Expensive State Index Score: 28.91
35
North Carolina

Average home value: $210,766
Average property tax rate: 0.85 percent
Average state and local sales tax rate: 6.97 percent
Estimated hourly living wage: $31.26
Annual median household income: $57,341
Expensive State Index Score: 29.11
34
Oklahoma
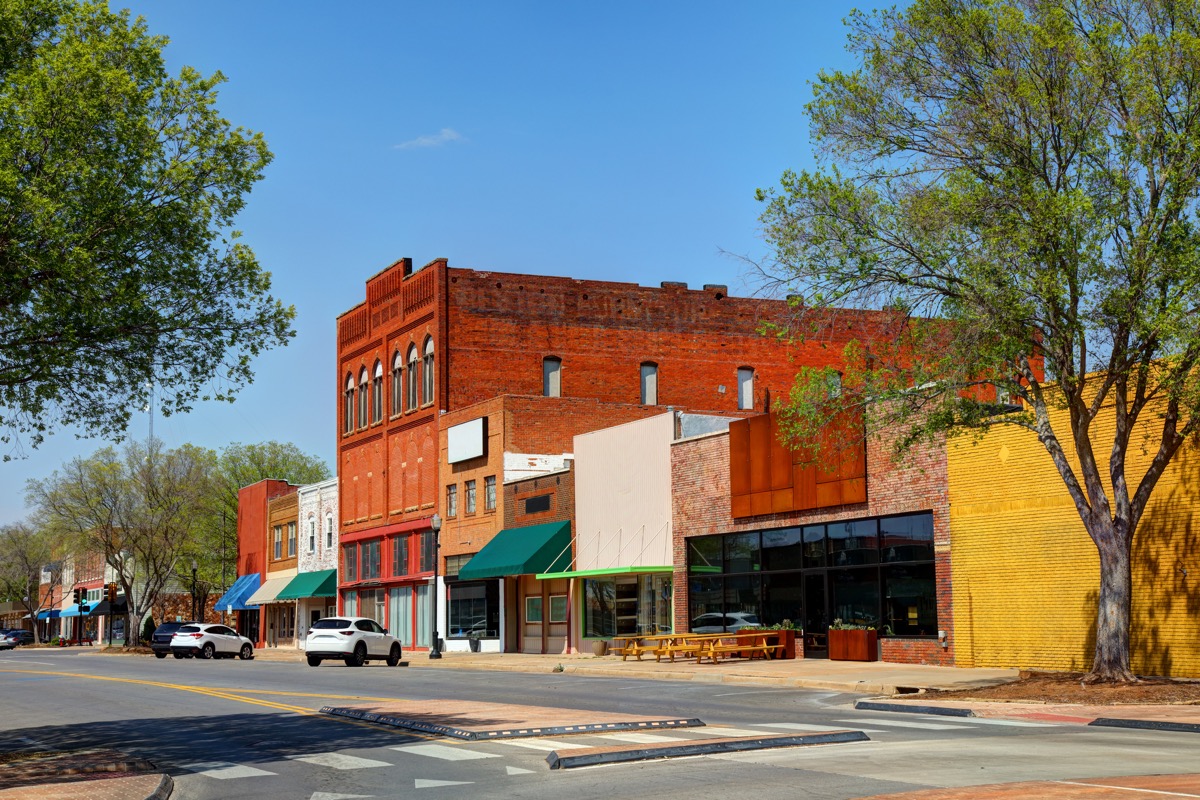
Average home value: $134,289
Average property tax rate: 0.88 percent
Average state and local sales tax rate: 8.94 percent
Estimated hourly living wage: $30.58
Annual median household income: $54,449
Expensive State Index Score: 29.23
33
South Dakota
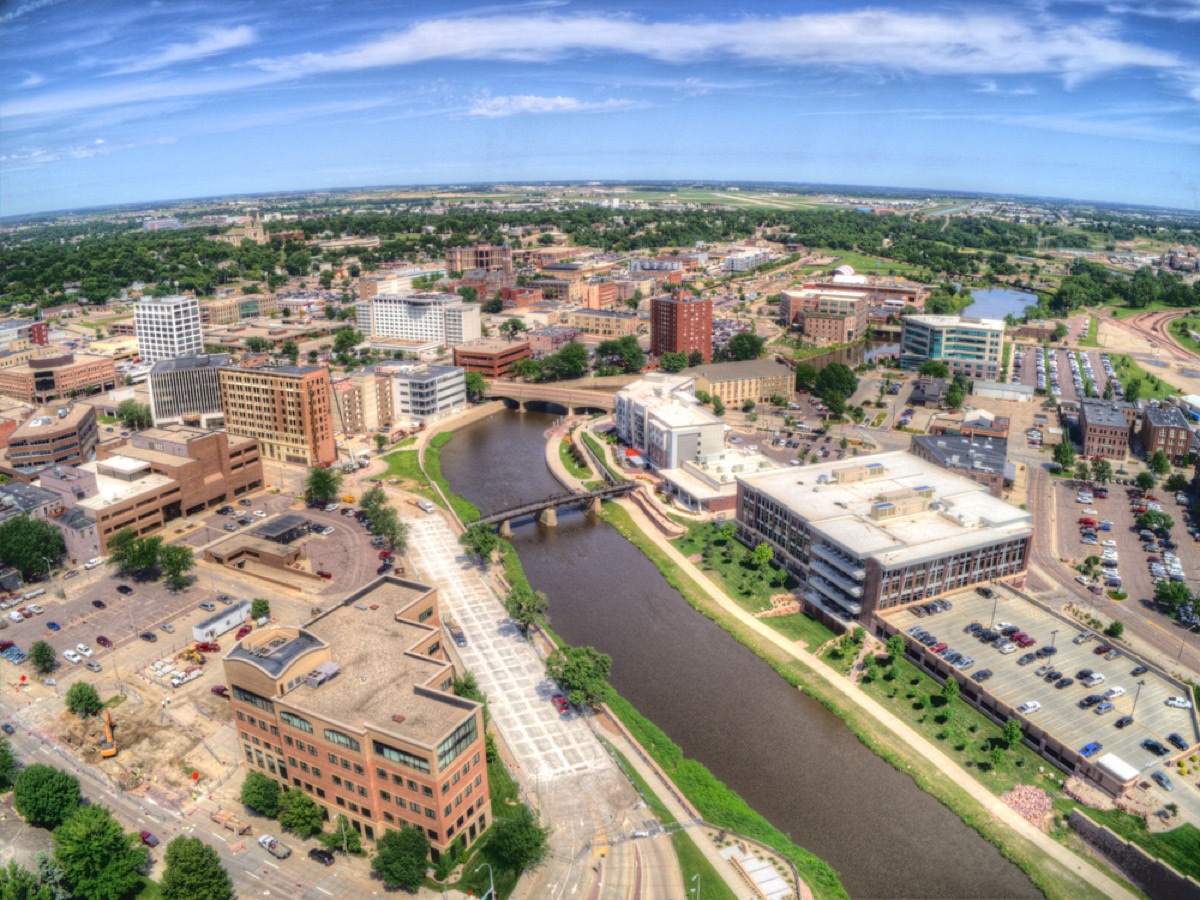
Average home value: $217,215
Average property tax rate: 1.22 percent
Average state and local sales tax rate: 6.40 percent
Estimated hourly living wage: $29.19
Annual median household income: $59,533
Expensive State Index Score: 30.33
32
Louisiana

Average home value: $171,485
Average property tax rate: 0.52 percent
Average state and local sales tax rate: 9.52 percent
Estimated hourly living wage: $32.16
Annual median household income: $51,073
Expensive State Index Score: 31.64
31
Ohio
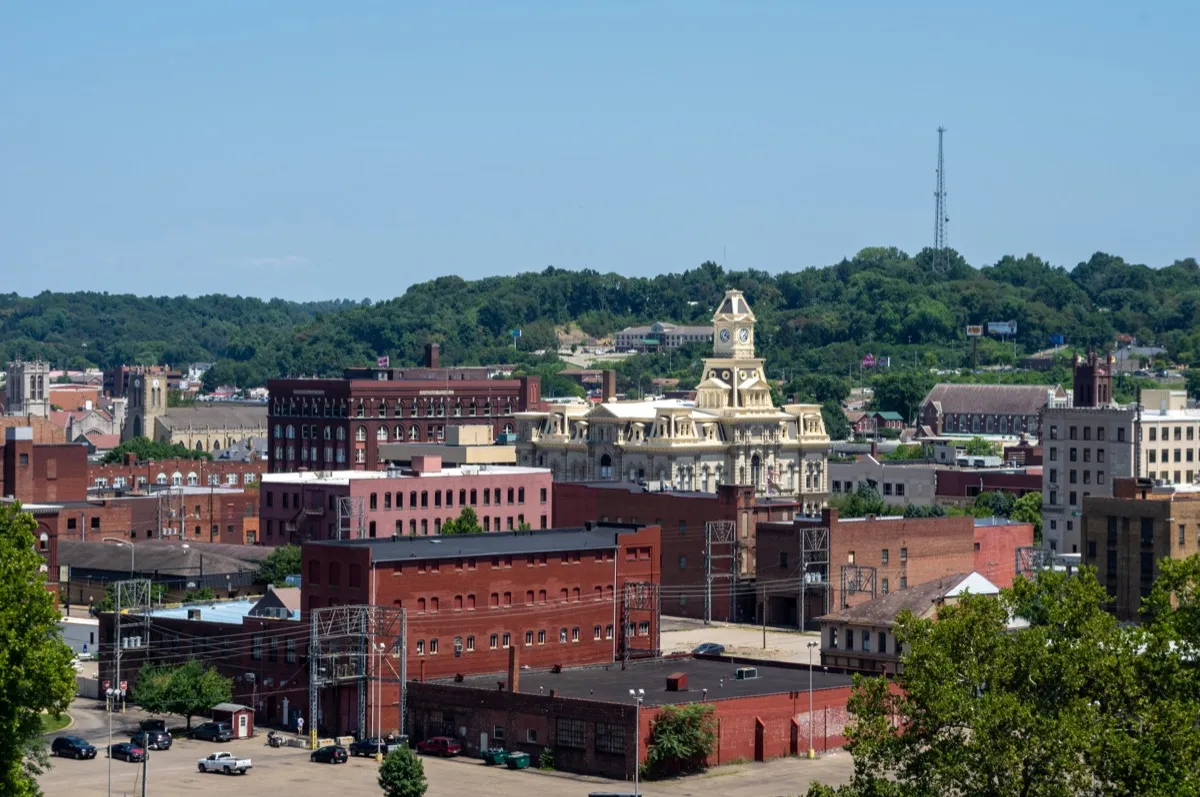
Average home value: $156,343
Average property tax rate: 1.62 percent
Average state and local sales tax rate: 7.17 percent
Estimated hourly living wage: $29.55
Annual median household income: $58,642
Expensive State Index Score: 31.81
30
Maine

Average home value: $253,914
Average property tax rate: 1.27 percent
Average state and local sales tax rate: 5.50 percent
Estimated hourly living wage: $32.41
Annual median household income: $58,924
Expensive State Index Score: 32.31
29
Iowa

Average home value: $155,781
Average property tax rate: 1.50 percent
Average state and local sales tax rate: 6.94 percent
Estimated hourly living wage: $31.31
Annual median household income: $61,691
Expensive State Index Score: 32.79
28
Missouri

Average home value: $167,700
Average property tax rate: 1.01 percent
Average state and local sales tax rate: 8.18 percent
Estimated hourly living wage: $31.55
Annual median household income: $57,409
Expensive State Index Score: 32.91
27
Pennsylvania

Average home value: $200,367
Average property tax rate: 1.51 percent
Average state and local sales tax rate: 6.34 percent
Estimated hourly living wage: $29.08
Annual median household income: $63,463
Expensive State Index Score: 33.76
26
Wisconsin
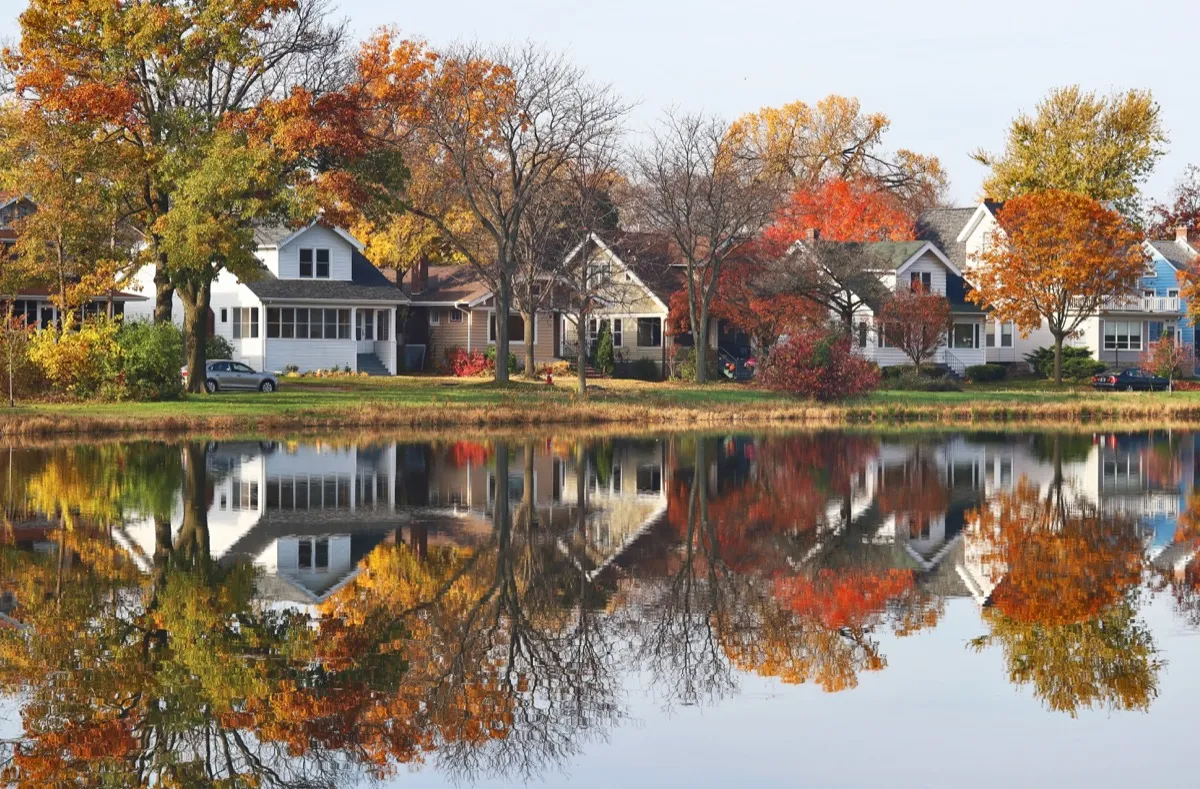
Average home value: $206,169
Average property tax rate: 1.73 percent
Average state and local sales tax rate: 5.46 percent
Estimated hourly living wage: $30.98
Annual median household income: $64,168
Expensive State Index Score: 34.07
25
Georgia

Average home value: $208,833
Average property tax rate: 0.92 percent
Average state and local sales tax rate: 7.31 percent
Estimated hourly living wage: $32.23
Annual median household income: $61,980
Expensive State Index Score: 35.36
24
Idaho

Average home value: $304,036
Average property tax rate: 0.75 percent
Average state and local sales tax rate: 6.03 percent
Estimated hourly living wage: $31.29
Annual median household income: $60,999
Expensive State Index Score: 35.51
23
North Dakota
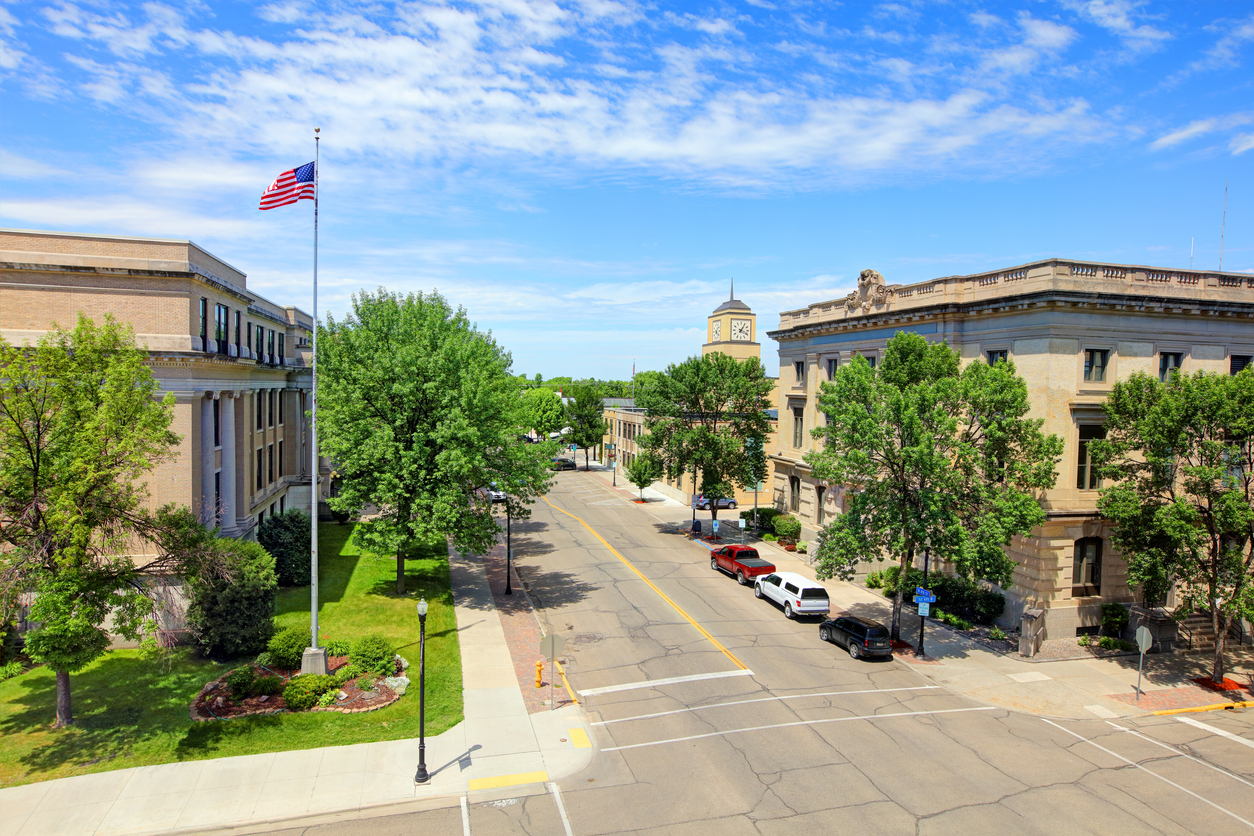
Average home value: $236,405
Average property tax rate: 0.95 percent
Average state and local sales tax rate: 6.86 percent
Estimated hourly living wage: $29.55
Annual median household income: $64,577
Expensive State Index Score: 35.68
22
Tennessee

Average home value: $192,275
Average property tax rate: 0.73 percent
Average state and local sales tax rate: 9.53 percent
Estimated hourly living wage: $28.97
Annual median household income: $56,071
Expensive State Index Score: 36.74
21
Florida
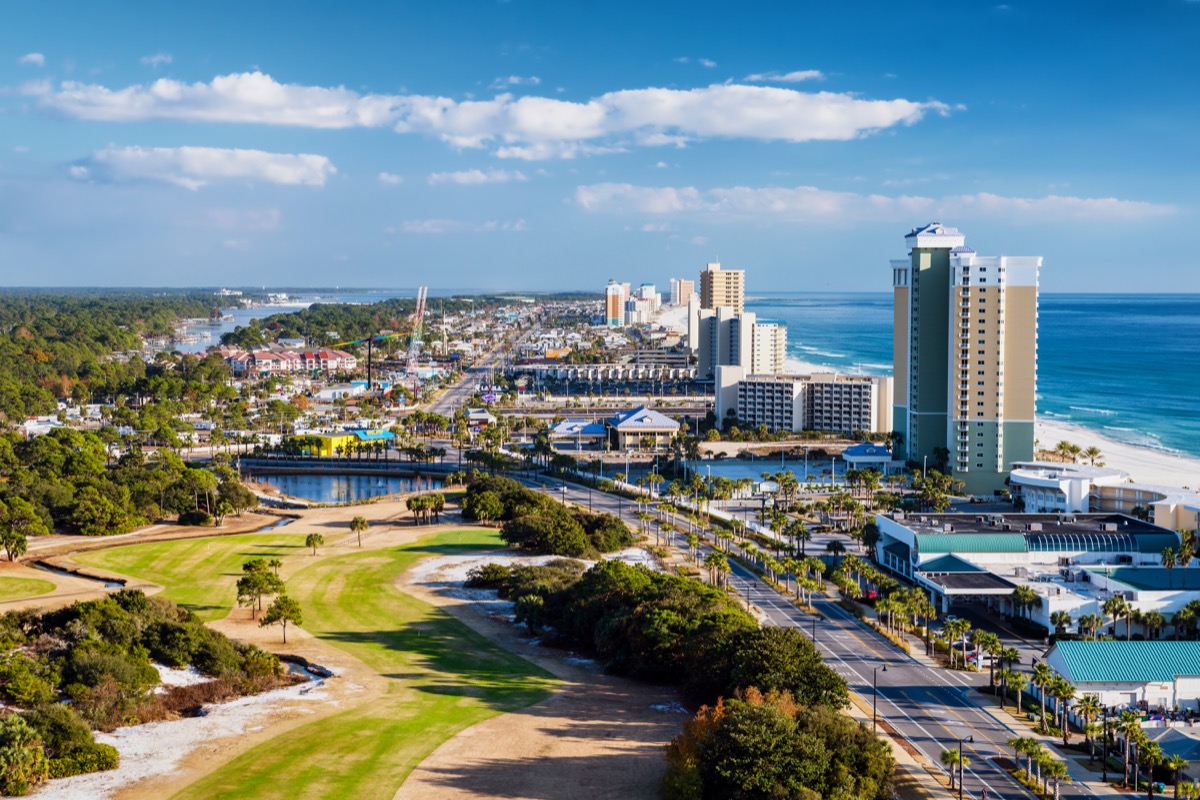
Average home value: $254,607
Average property tax rate: 0.94 percent
Average state and local sales tax rate: 7.05 percent
Estimated hourly living wage: $32.28
Annual median household income: $59,227
Expensive State Index Score: 37.30
And for the part of the country with the least-edible eats, This State Has the Worst Food in America, According to Data.
20
Nebraska
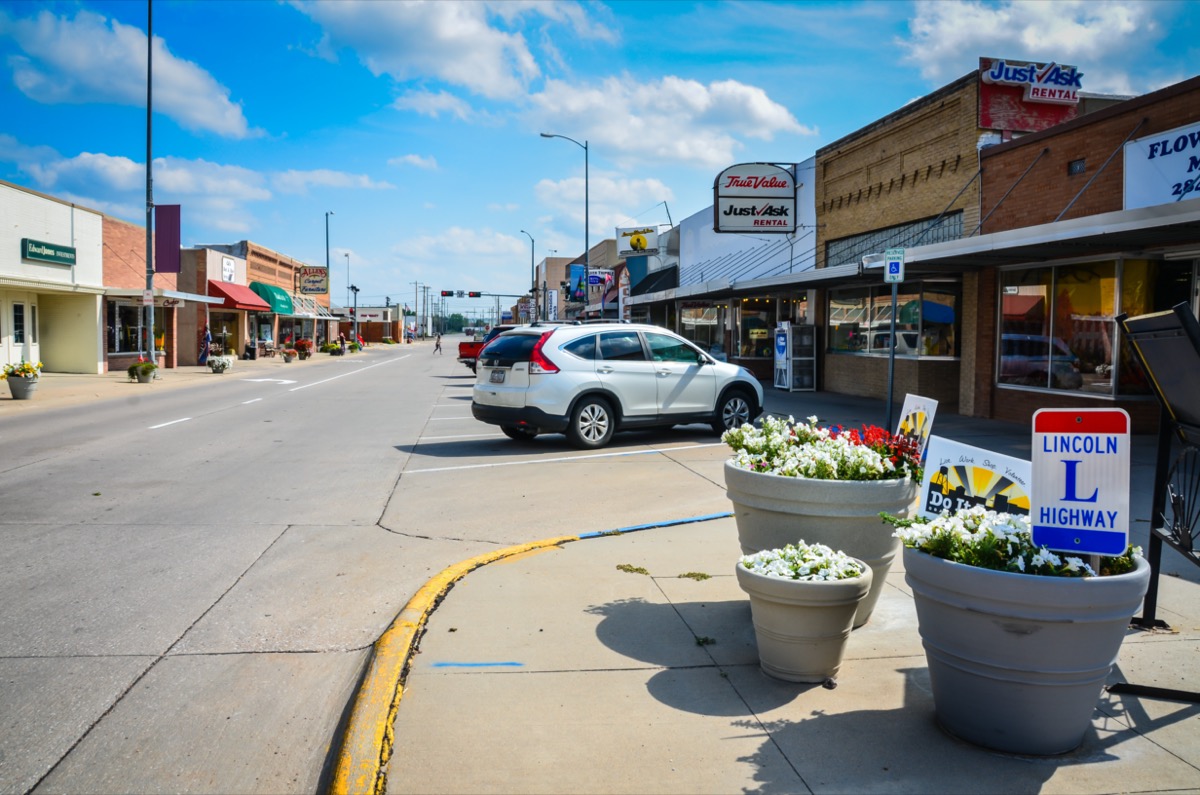
Average home value: $180,397
Average property tax rate: 1.65 percent
Average state and local sales tax rate: 6.93 percent
Estimated hourly living wage: $31.44
Annual median household income: $63,229
Expensive State Index Score: 38.08
19
Kansas
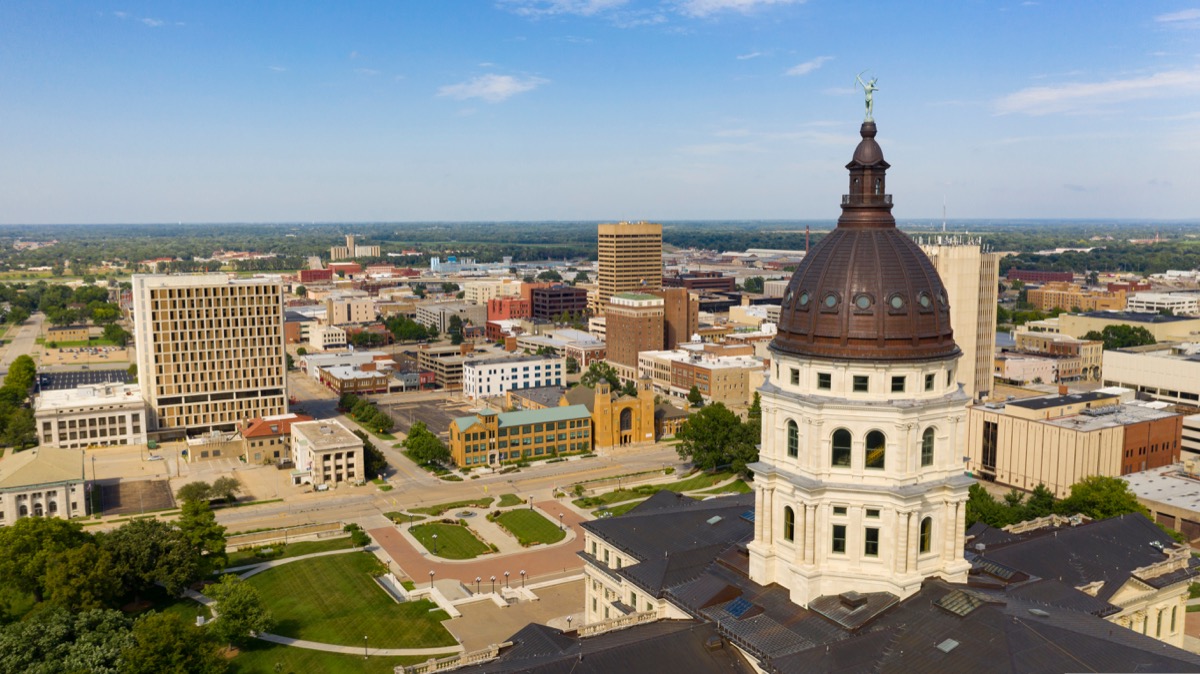
Average home value: $154,531
Average property tax rate: 1.33 percent
Average state and local sales tax rate: 8.68 percent
Estimated hourly living wage: $30.66
Annual median household income: $62,087
Expensive State Index Score: 39.87
18
Virginia
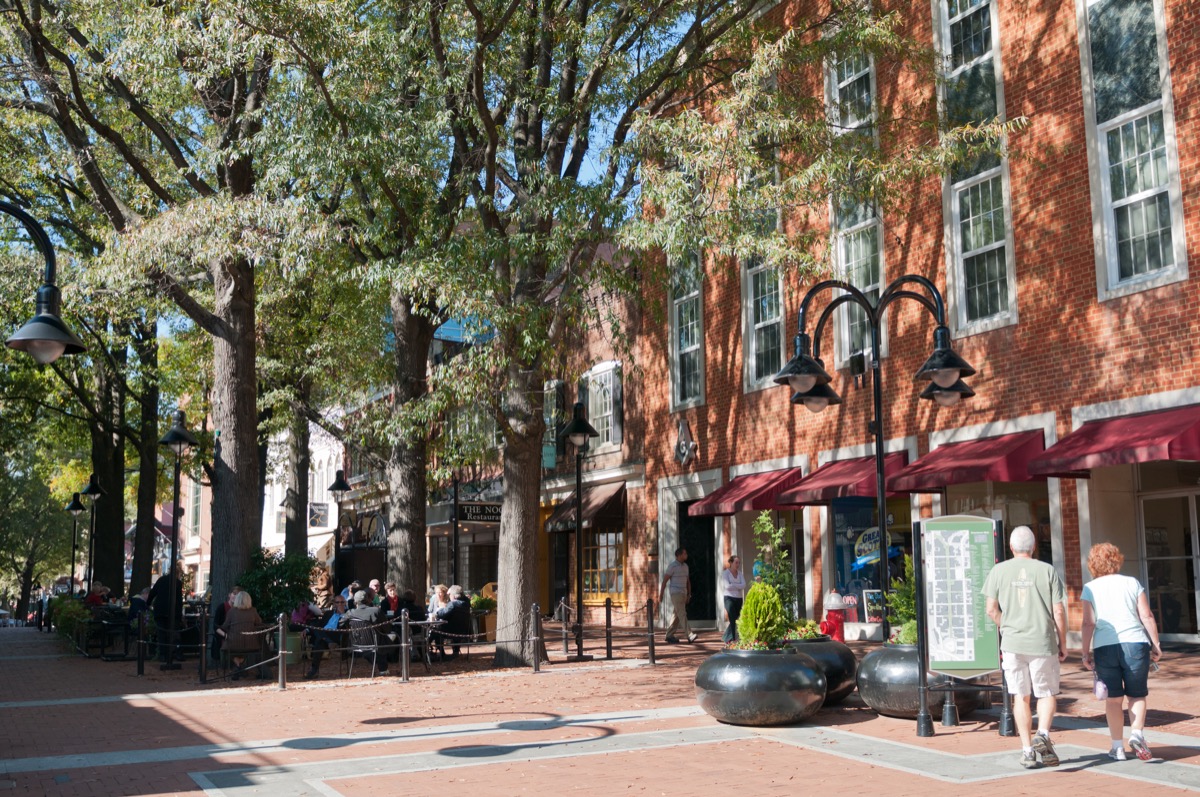
Average home value: $293,818
Average property tax rate: 0.86 percent
Average state and local sales tax rate: 5.65 percent
Estimated hourly living wage: $33.68
Annual median household income: 76,456
Expensive State Index Score: 45.86
17
Vermont

Average home value: $264,777
Average property tax rate: 1.8 percent
Average state and local sales tax rate: 6.22 percent
Estimated hourly living wage: $32.92
Annual median household income: 63,001
Expensive State Index Score: 46.01
16
Arizona

Average home value: $283,623
Average property tax rate: 0.67 percent
Average state and local sales tax rate: 8.40 percent
Estimated hourly living wage: $32.42
Annual median household income: $62,055
Expensive State Index Score: 46.79
15
Nevada
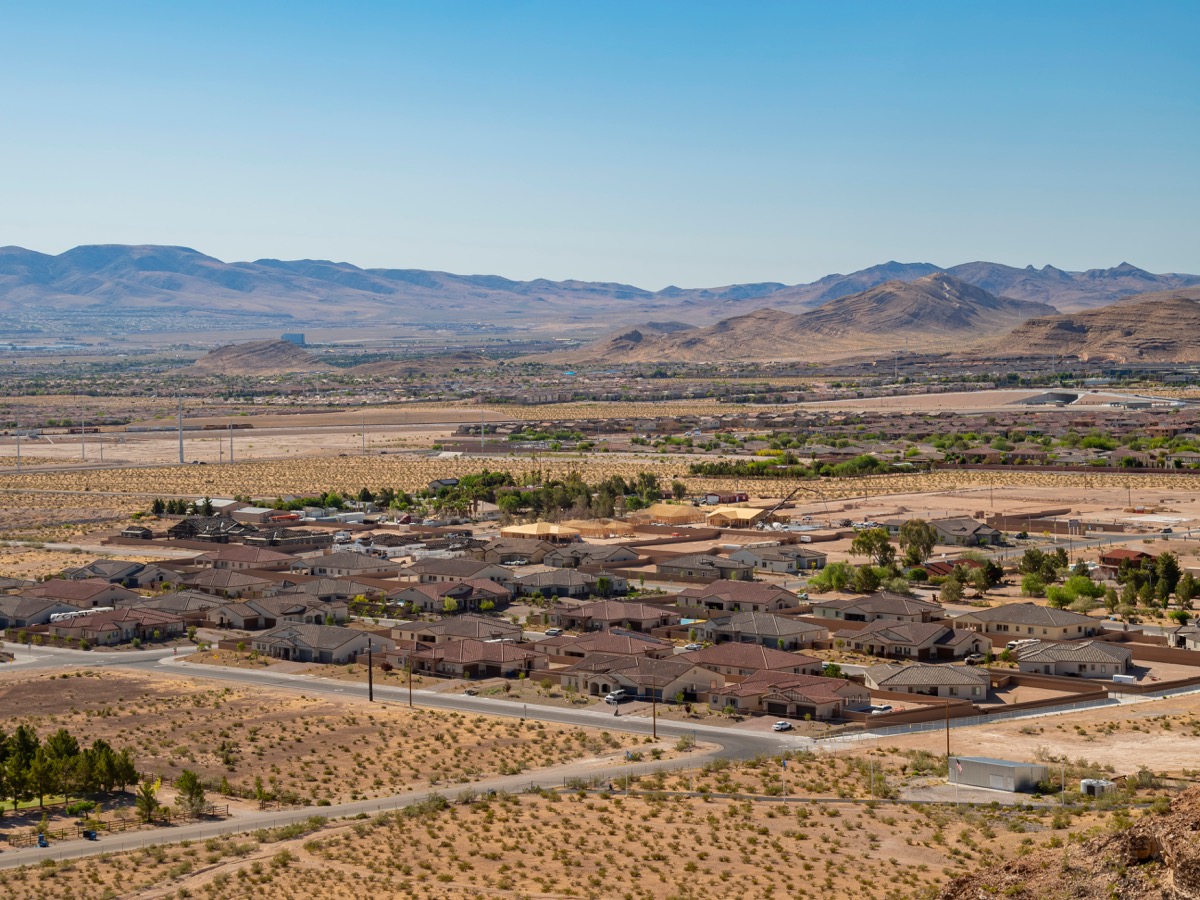
Average home value: $311,018
Average property tax rate: 0.66 percent
Average state and local sales tax rate: 8.32 percent
Estimated hourly living wage: $30.40
Annual median household income: $63,276
Expensive State Index Score: 48.29
14
Texas

Average home value: $213,036
Average property tax rate: 1.69 percent
Average state and local sales tax rate: 8.19 percent
Estimated hourly living wage: 30.75
Annual median household income: 64,034
Expensive State Index Score: 48.67
And for the place that is most riddled with rage, This Is the Most Hateful State in America.
13
Minnesota
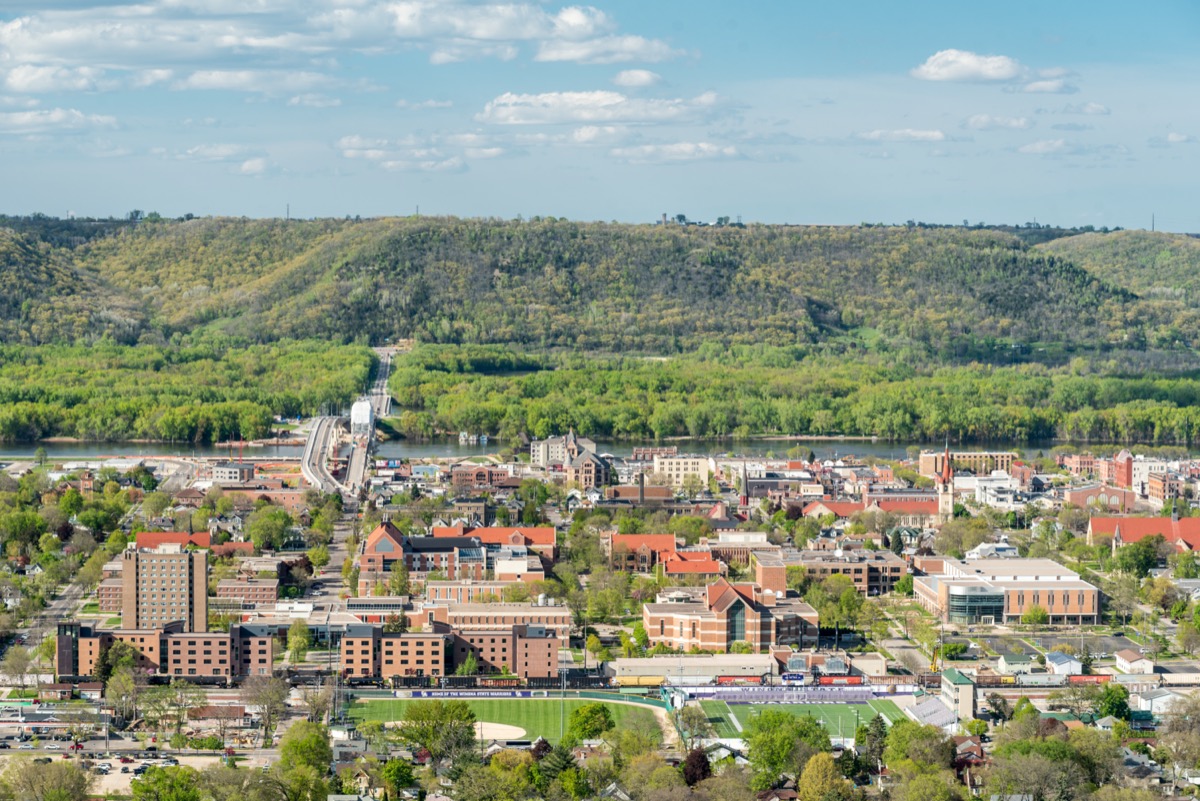
Average home value: $266,887
Average property tax rate: 1.11 percent
Average state and local sales tax rate: 7.46 percent
Estimated hourly living wage: $32.96
Annual median household income: $74,593
Expensive State Index Score: 53.39
12
Rhode Island
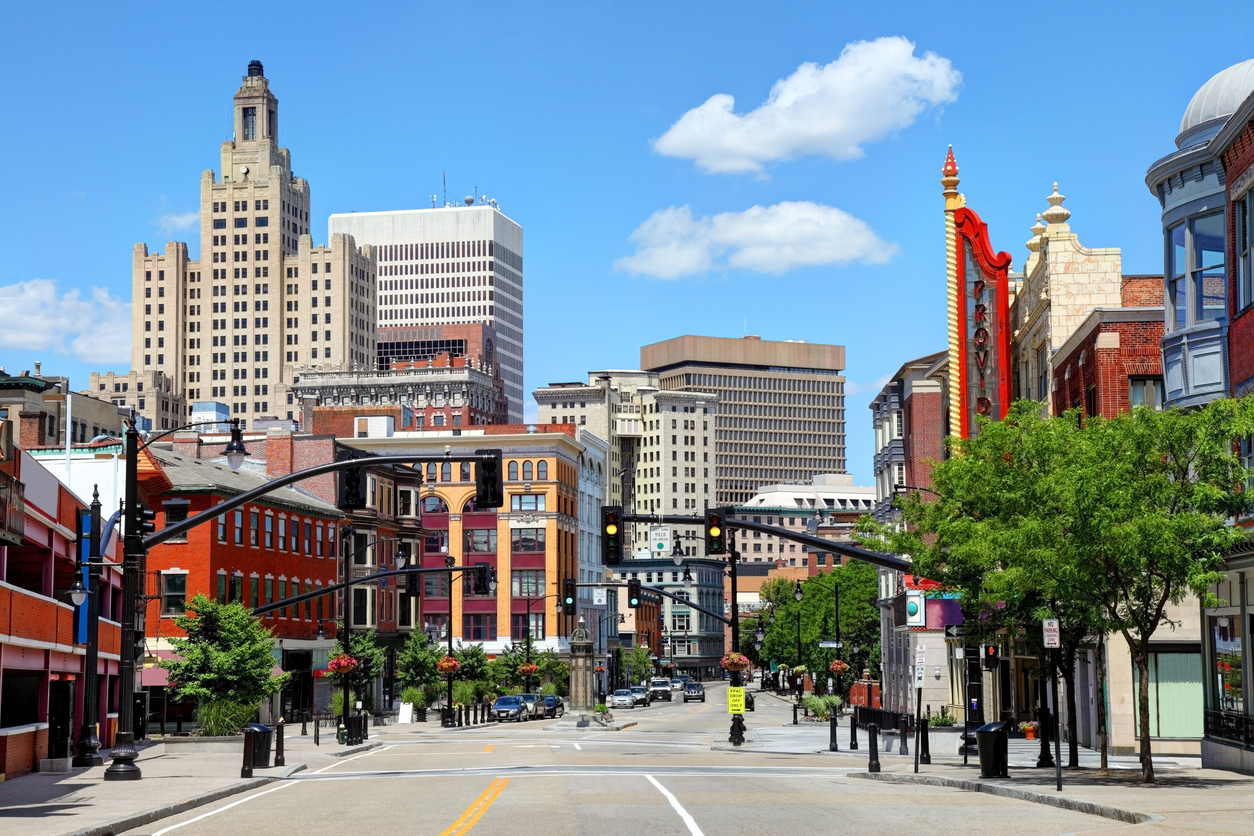
Average home value: $312,255
Average property tax rate: 1.53 percent
Average state and local sales tax rate: 7.00 percent
Estimated hourly living wage: $31.74
Annual median household income: $71,169
Expensive State Index Score: 56.88
11
Connecticut

Average home value: $262,600
Average property tax rate: 1.70 percent
Average state and local sales tax rate: 6.35 percent
Estimated hourly living wage: $34.13
Annual median household income: $78,883
Expensive State Index Score: 57.03
10
Utah
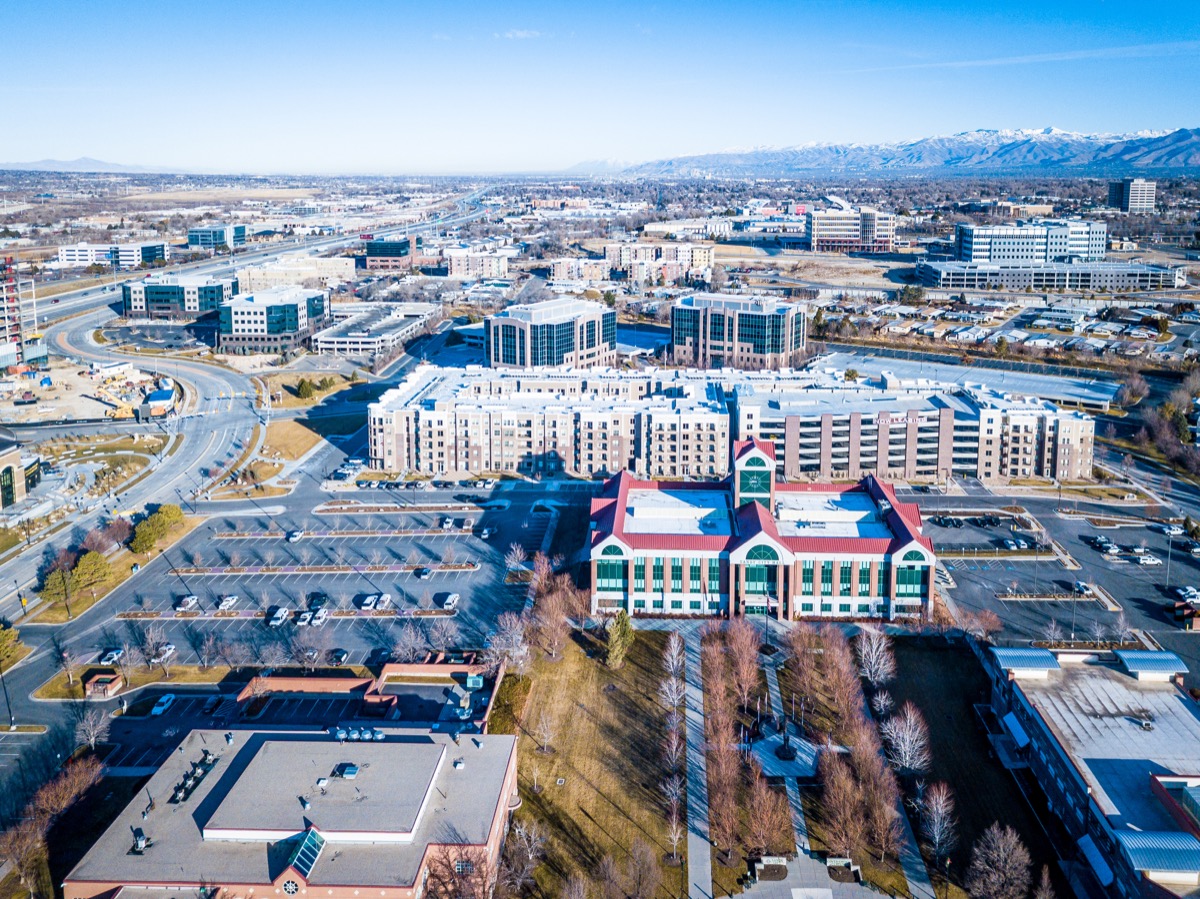
Average home value: $374,604
Average property tax rate: 0.62 percent
Average state and local sales tax rate: 7.18 percent
Estimated hourly living wage: $32.05
Annual median household income: $75,780
Expensive State Index Score: 58.34
9
Maryland
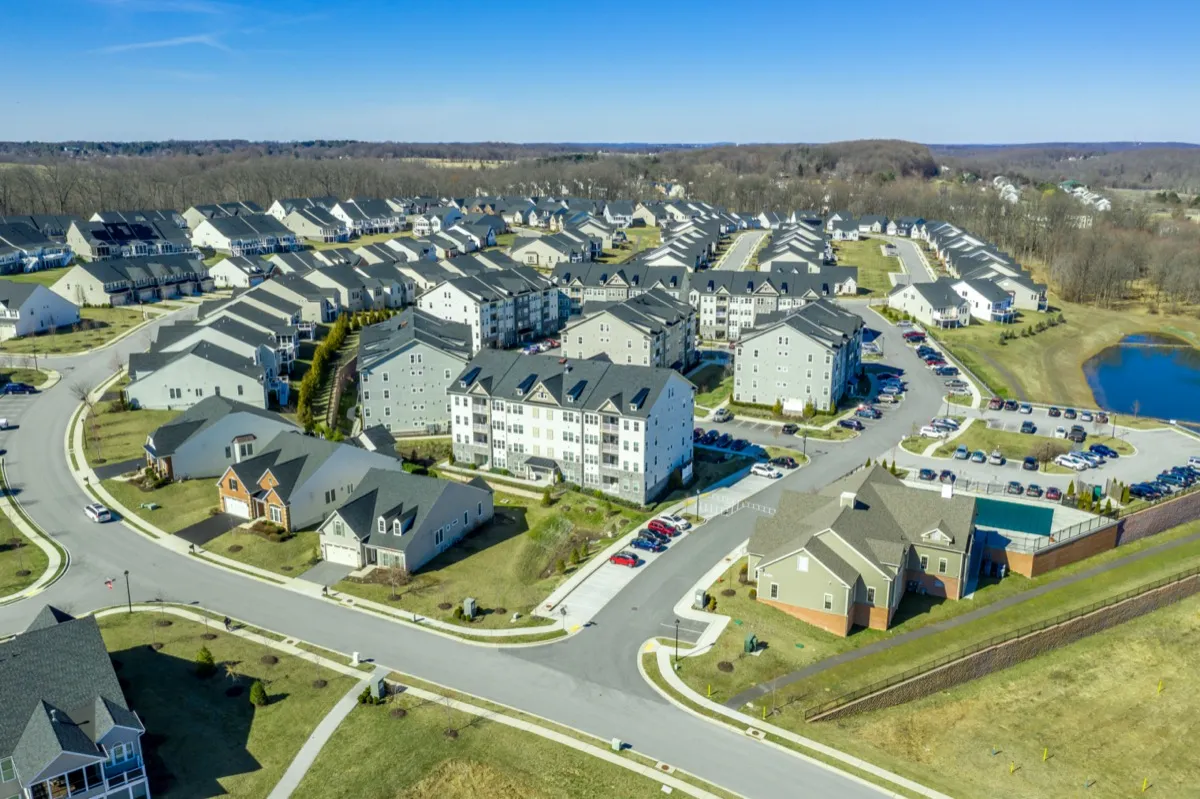
Average home value: $317,033
Average property tax rate: 1.04 percent
Average state and local sales tax rate: 6.00 percent
Estimated hourly living wage: $35.41
Annual median household income: $86,738
Expensive State Index Score: 60.42
8
Illinois
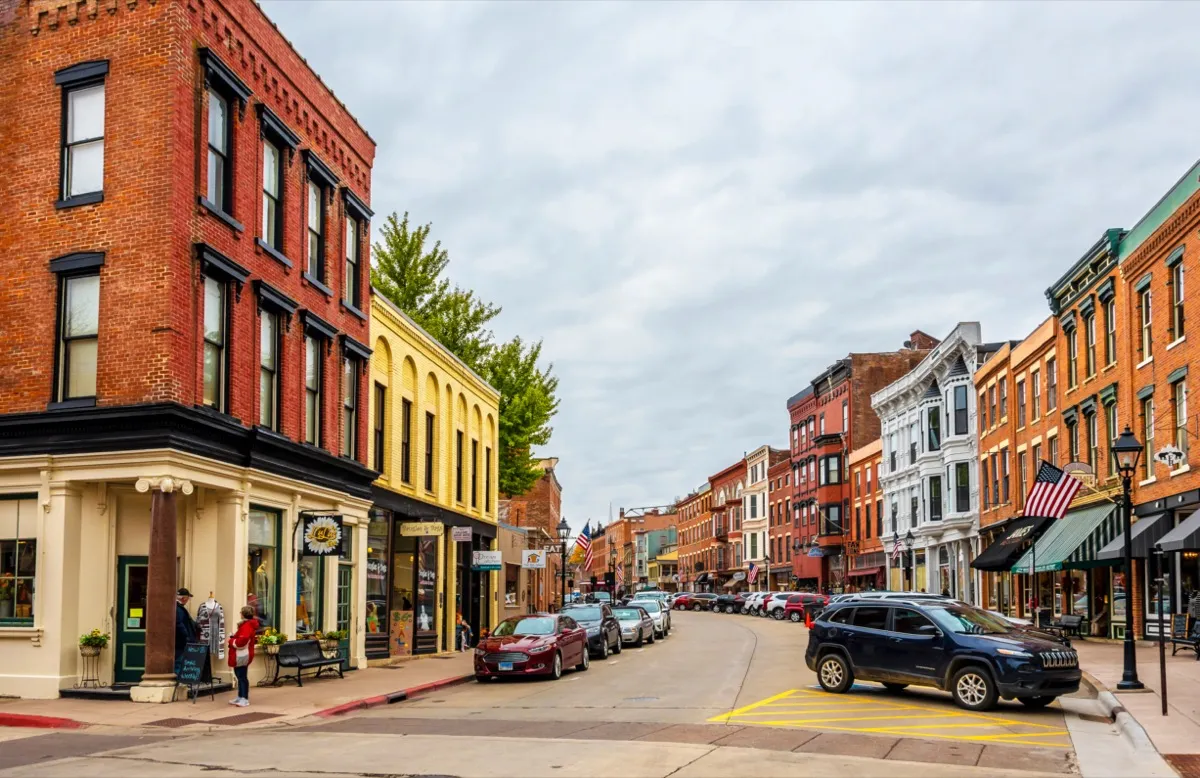
Average home value: $204,872
Average property tax rate: 2.05 percent
Average state and local sales tax rate: 9.08 percent
Estimated hourly living wage: $32.53
Annual median household income: $69,187
Expensive State Index Score: 61.25
7
Colorado

Average home value: $412,819
Average property tax rate: 0.56 percent
Average state and local sales tax rate: 7.65 percent
Estimated hourly living wage: $34.94
Annual median household income: $77,127
Expensive State Index Score: 67.67
6
New York
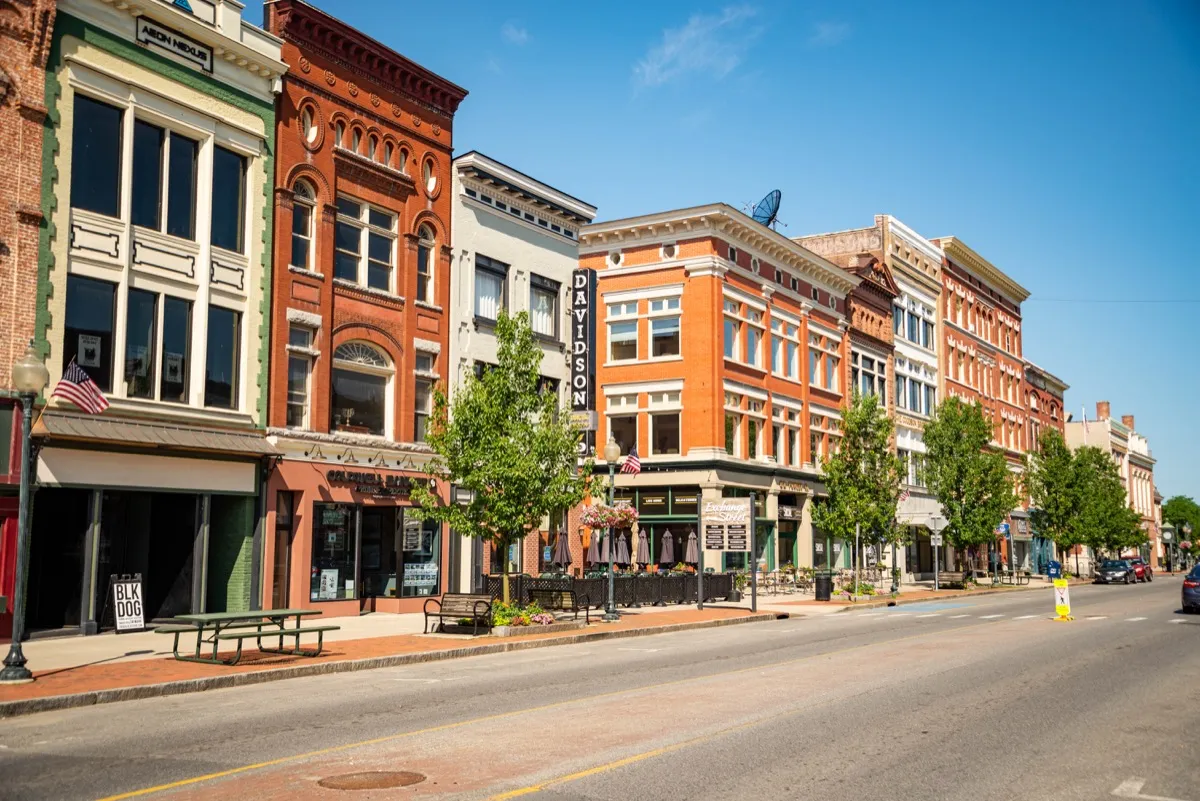
Average home value: $331,459
Average property tax rate: 1.40 percent
Average state and local sales tax rate: 8.52 percent
Estimated hourly living wage: $35.98
Annual median household income: $72,108
Expensive State Index Score: 69.91
And for more exclusive rankings sent straight to your inbox, sign up for our daily newsletter.
5
Massachusetts

Average home value: $439,541
Average property tax rate: 1.15 percent
Average state and local sales tax rate: 6.25 percent
Estimated hourly living wage: $34.72
Annual median household income: $85,843
Expensive State Index Score: 74.85
4
New Jersey

Average home value: $346,368
Average property tax rate: 2.21 percent
Average state and local sales tax rate: 6.60 percent
Estimated hourly living wage: $35.18
Annual median household income: $85,751
Expensive State Index Score: 78.14
3
Hawaii

Average home value: $646,733
Average property tax rate: .03 percent
Average state and local sales tax rate: 4.44 percent
Estimated hourly living wage: $40.40
Annual median household income: $83,102
Expensive State Index Score: 81.51
2
Washington

Average home value: $439,487
Average property tax rate: 0.92 percent
Average state and local sales tax rate: 9.21 percent
Estimated hourly living wage: $33.31
Annual median household income: $76,687
Expensive State Index Score: 82.27
1
California
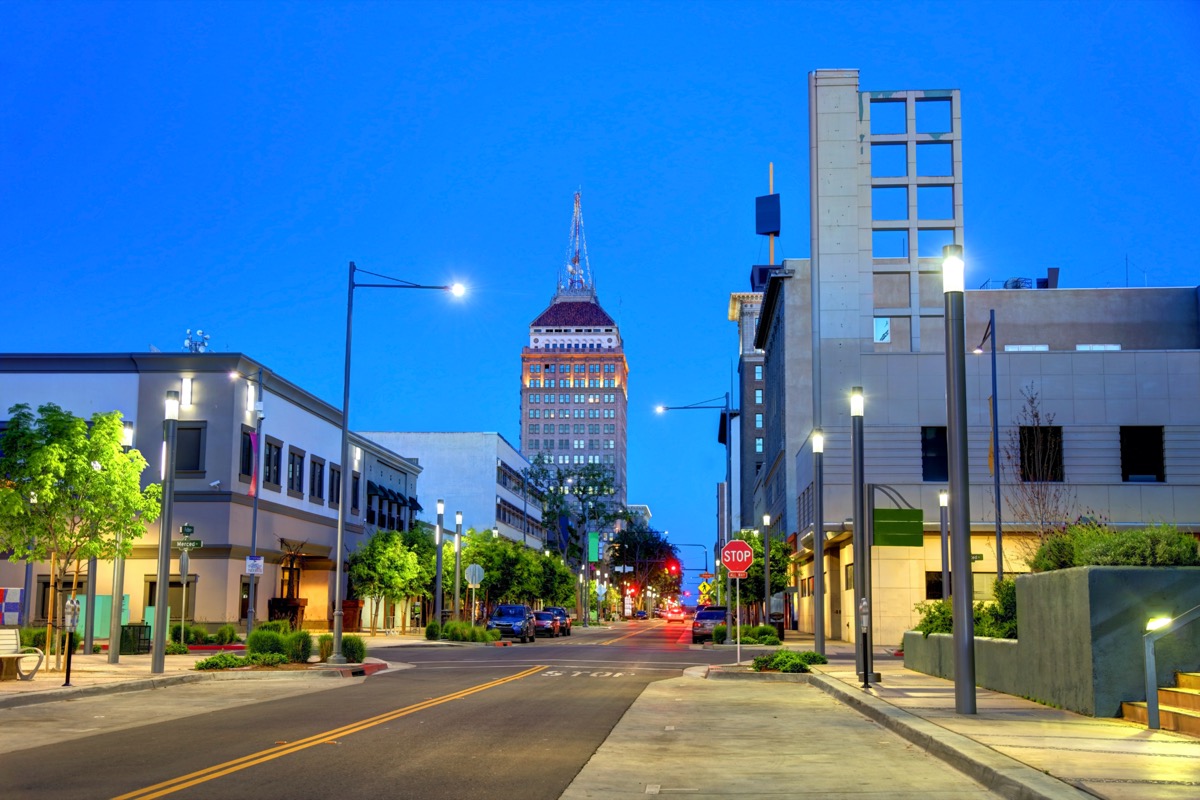
Average home value: $579,332
Average property tax rate: 0.72 percent
Average state and local sales tax rate: 8.66 percent
Estimated hourly living wage: $40.83
Annual median household income: $80,440
Expensive State Index Score: 100.00
And for the state where residents have another concern, This Is the Most Dangerous State in America, According to Data.