This Is the Most Hateful State in America
From crime to discrimination, this hateful state has some serious work to do.

Hate, like most four-letter knuckle tattoos, is a bad look. But that didn't stop hate crimes in America from reaching their highest level in a decade in 2019, nor the number of hate groups from doubling between 1999 and 2019. But how much hate is there on a state-by-state basis? Well, Best Life crunched the numbers to determine the most hateful state in America.
We used multiple data points to help us measure violent crime, hate crime, groups engaging in hate speech, and more general bias. First, we looked at the percentage of people with first- or second-hand experience of violent crime in the last year in each state, as reported in SafeWise's 2020 State of Safety in the Nation research report. Then, we factored in the number of hate groups operating per capita* according to the Southern Poverty Law Center. Next, we considered the number of hate crimes recorded per capita, using the most recent data from the Federal Bureau of Investigations (FBI). Finally, we added in Paychex's analysis of the amount of workplace discrimination complaints filed to the Equal Employment Opportunity Commission (EEOC) per capita.
We then gave each metric a weighted value before running them through our exclusive algorithm to see how each state scored on our 100-point scale Hate Index, where 100 is the most hateful a state could be. Overall, states in the South came out higher on the Hate Index, with six Southern states sitting in the top 10 most hateful places. The Midwest also had two entries, while the Southwest and West each had one state up there. Northeastern states generally scored lower on the Hate Index.
The most hateful state scored highest for employment discrimination, above average for violent crime, and was in the middle of the pack in terms of hate groups per capita. Read on to discover the most hateful state in America and to find out where yours fell in the mix. And for another place where the violent crime rate is high, This Is the Most Dangerous State in America.
*per capita equates to per 100,000 people in all instances.
50
Iowa
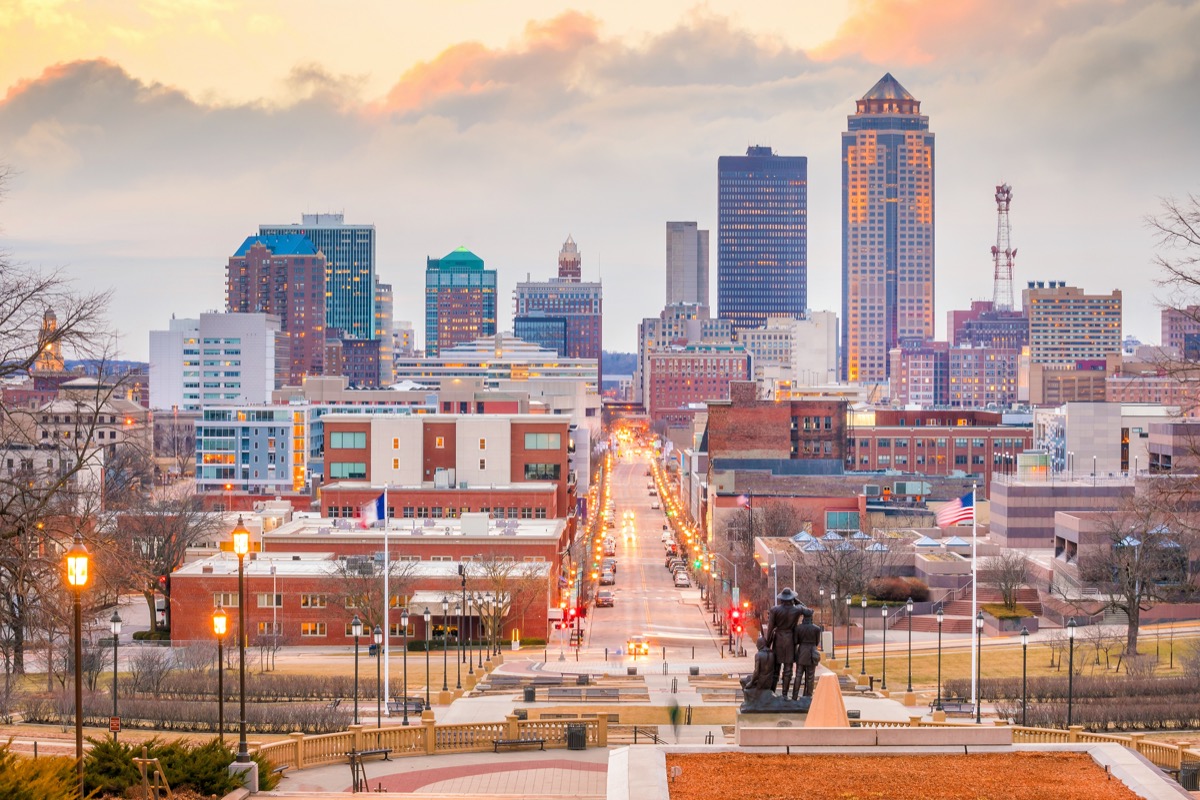
Residents who've experienced violent crime, or knows someone who has: 12 percent
Hate groups per capita: 0.95
Hate crimes per capita: 0.32
Workplace discrimination complaints per capita: 5.6
Hate Index Score: 0.00
49
Maine
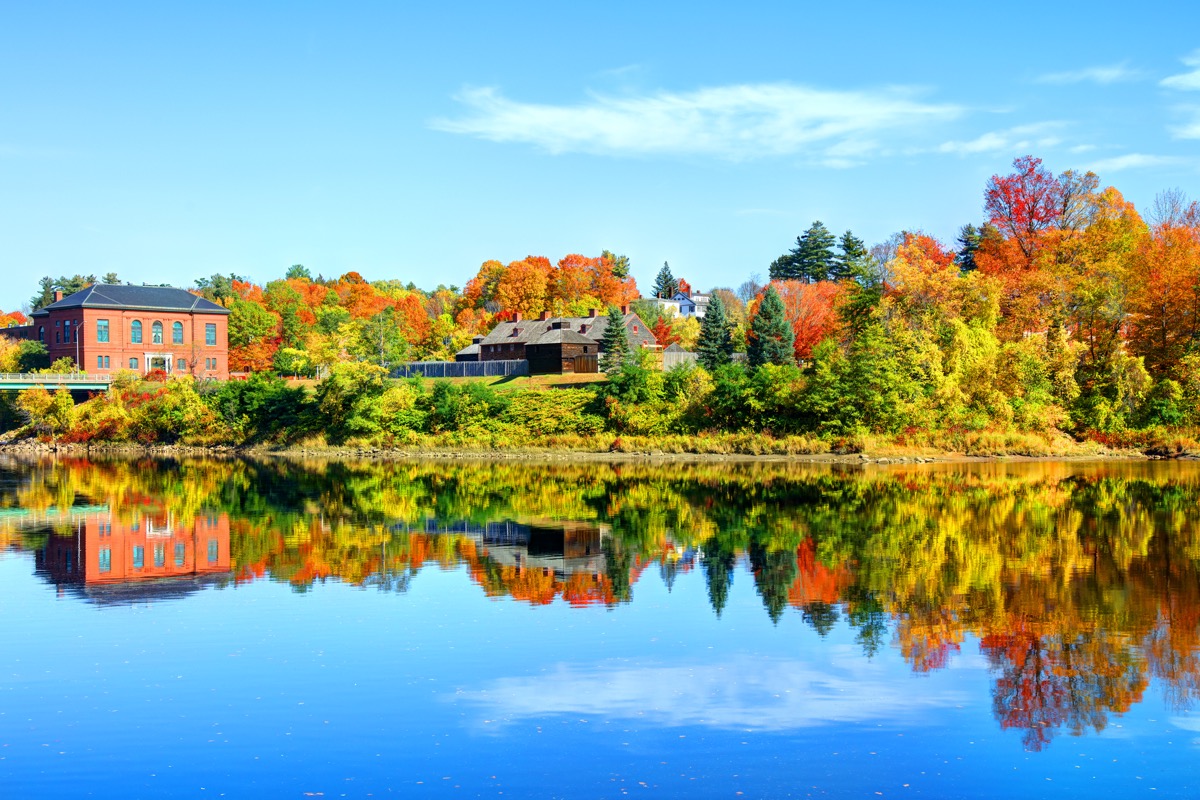
Residents who've experienced violent crime, or knows someone who has: 9 percent
Hate groups per capita: 1.49
Hate crimes per capita: 1.41
Workplace discrimination complaints per capita: 2.5
Hate Index Score: 3.21
48
Rhode Island

Residents who've experienced violent crime, or knows someone who has: 11 percent
Hate groups per capita: 0.94
Hate crimes per capita: 1.61
Workplace discrimination complaints per capita: 5.6
Hate Index Score: 5.96
47
New Hampshire
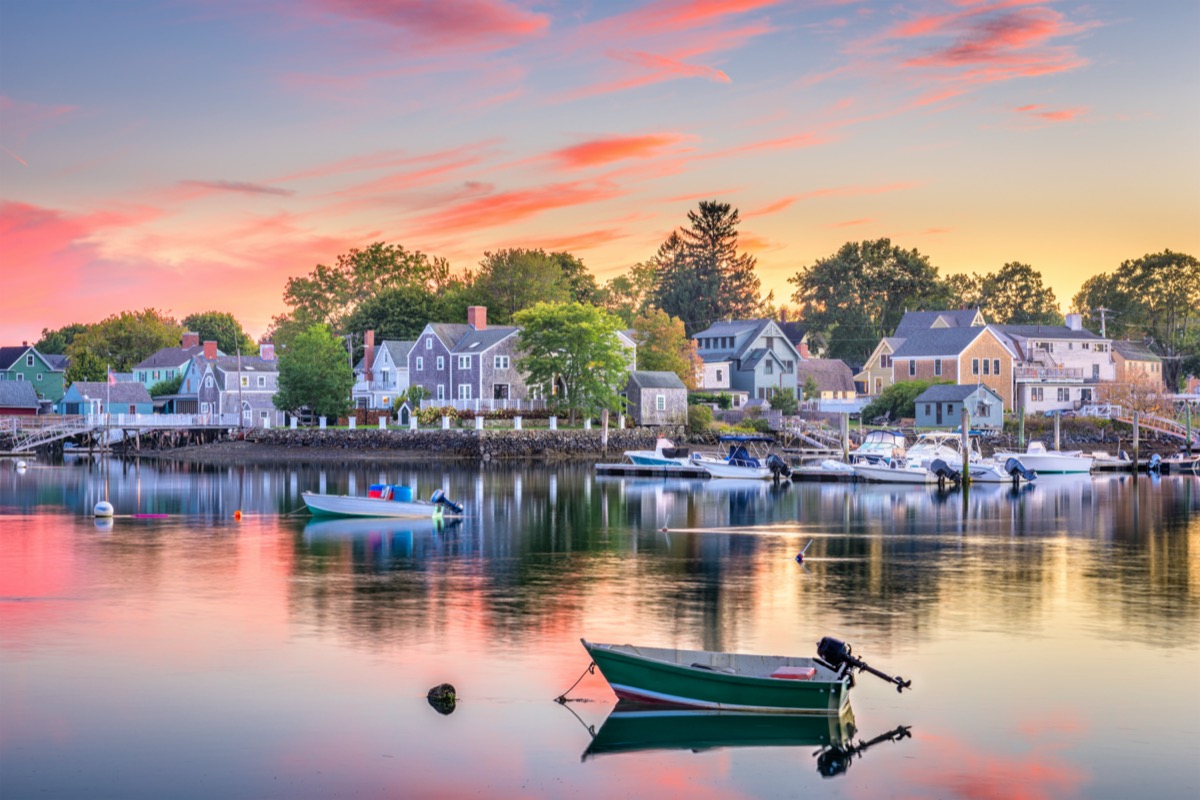
Residents who've experienced violent crime, or knows someone who has: 5 percent
Hate groups per capita: 2.96
Hate crimes per capita: 1.22
Workplace discrimination complaints per capita: 4.0
Hate Index Score: 7.06
46
Idaho

Residents who've experienced violent crime, or knows someone who has: 2 percent
Hate groups per capita: 4.00
Hate crimes per capita: 1.35
Workplace discrimination complaints per capita: 4.3
Hate Index Score: 10.63
45
Utah
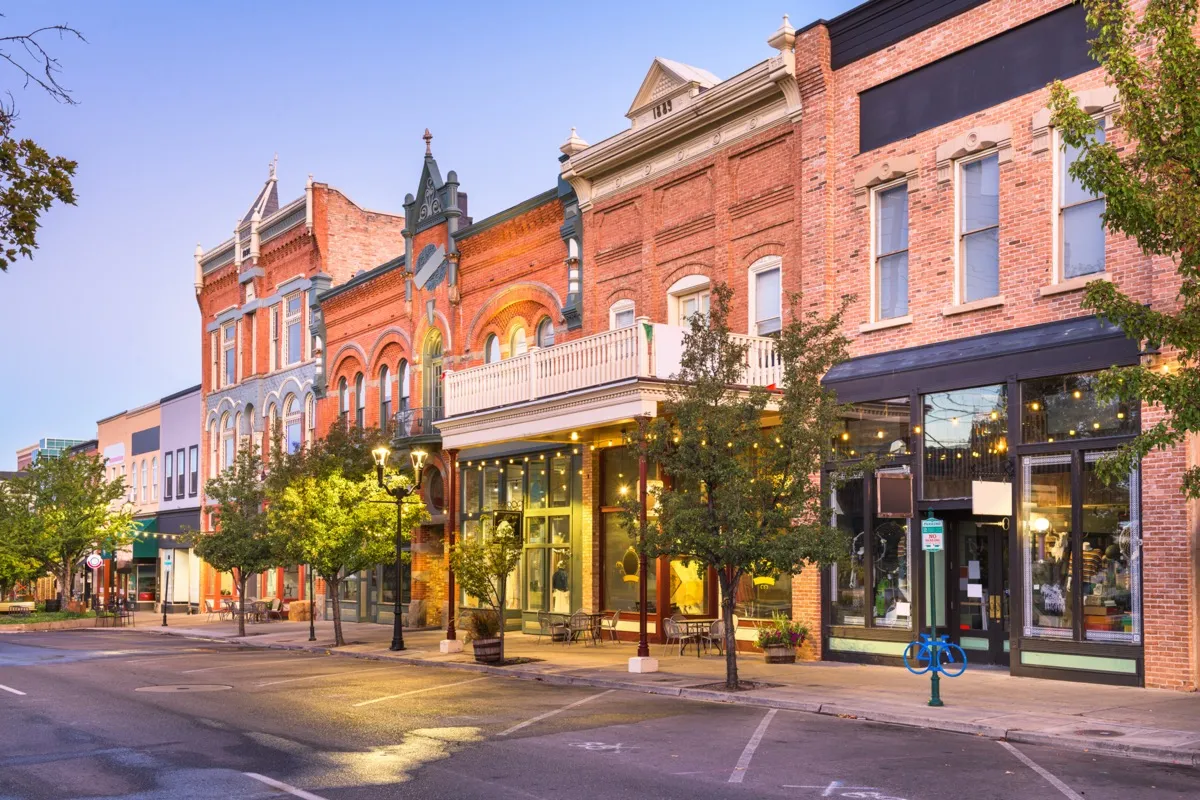
Residents who've experienced violent crime, or knows someone who has: 15 percent
Hate groups per capita: 1.59
Hate crimes per capita: 0.58
Workplace discrimination complaints per capita: 7.6
Hate Index Score: 13.30
44
West Virginia

Residents who've experienced violent crime, or knows someone who has: 8 percent
Hate groups per capita: 2.22
Hate crimes per capita: 1.97
Workplace discrimination complaints per capita: 7.7
Hate Index Score: 13.97
43
Wyoming

Residents who've experienced violent crime, or knows someone who has: 13 percent
Hate groups per capita: 1.73
Hate crimes per capita: 0.98
Workplace discrimination complaints per capita: 9.1
Hate Index Score: 14.23
42
Connecticut

Residents who've experienced violent crime, or knows someone who has: 11 percent
Hate groups per capita: 2.24
Hate crimes per capita: 2.25
Workplace discrimination complaints per capita: 7.2
Hate Index Score: 20.95
41
Minnesota

Residents who've experienced violent crime, or knows someone who has: 9 percent
Hate groups per capita: 2.14
Hate crimes per capita: 1.88
Workplace discrimination complaints per capita: 17.9
Hate Index Score: 21.77
40
North Dakota

Residents who've experienced violent crime, or knows someone who has: 9 percent
Hate groups per capita: 2.64
Hate crimes per capita: 2.36
Workplace discrimination complaints per capita: 8.6
Hate Index Score: 22.04
39
South Carolina
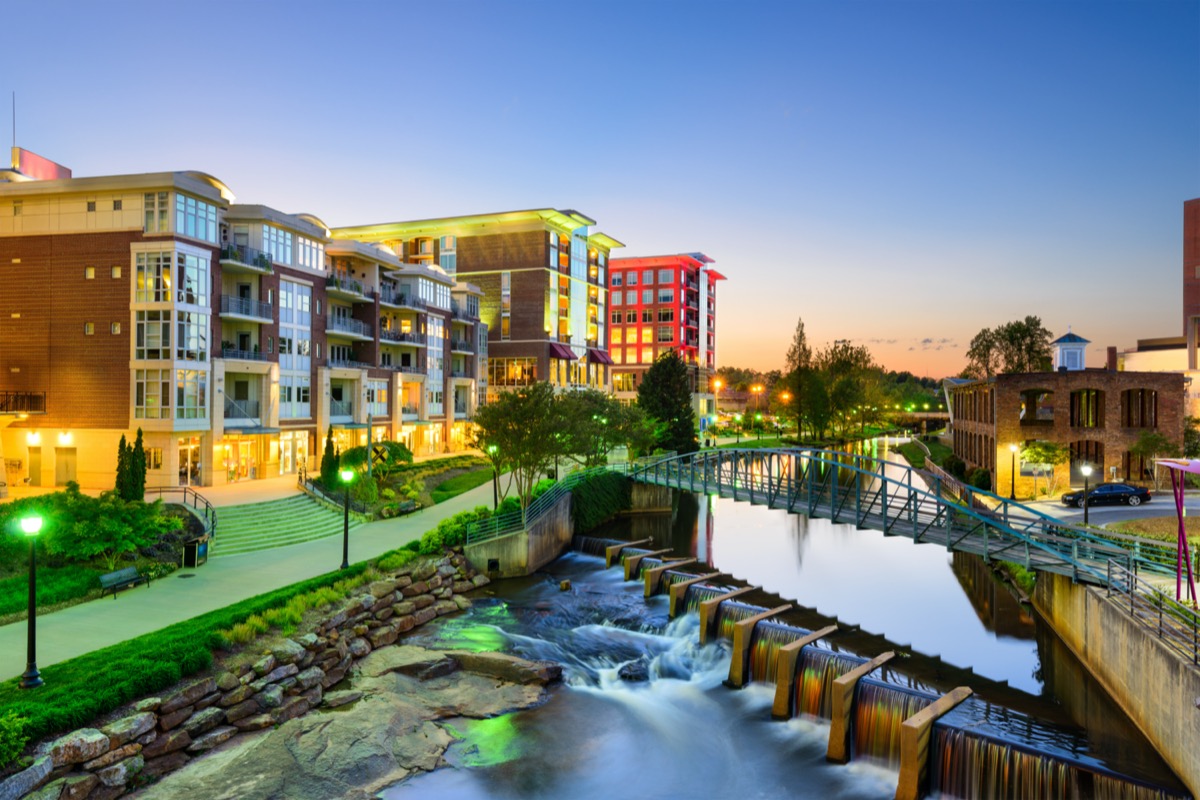
Residents who've experienced violent crime, or knows someone who has: 5 percent
Hate groups per capita: 3.34
Hate crimes per capita: 1.34
Workplace discrimination complaints per capita: 24.0
Hate Index Score: 24.74
38
Nebraska

Residents who've experienced violent crime, or knows someone who has: 10 percent
Hate groups per capita: 3.12
Hate crimes per capita: 2.54
Workplace discrimination complaints per capita: 4.3
Hate Index Score: 25.57
37
Pennsylvania
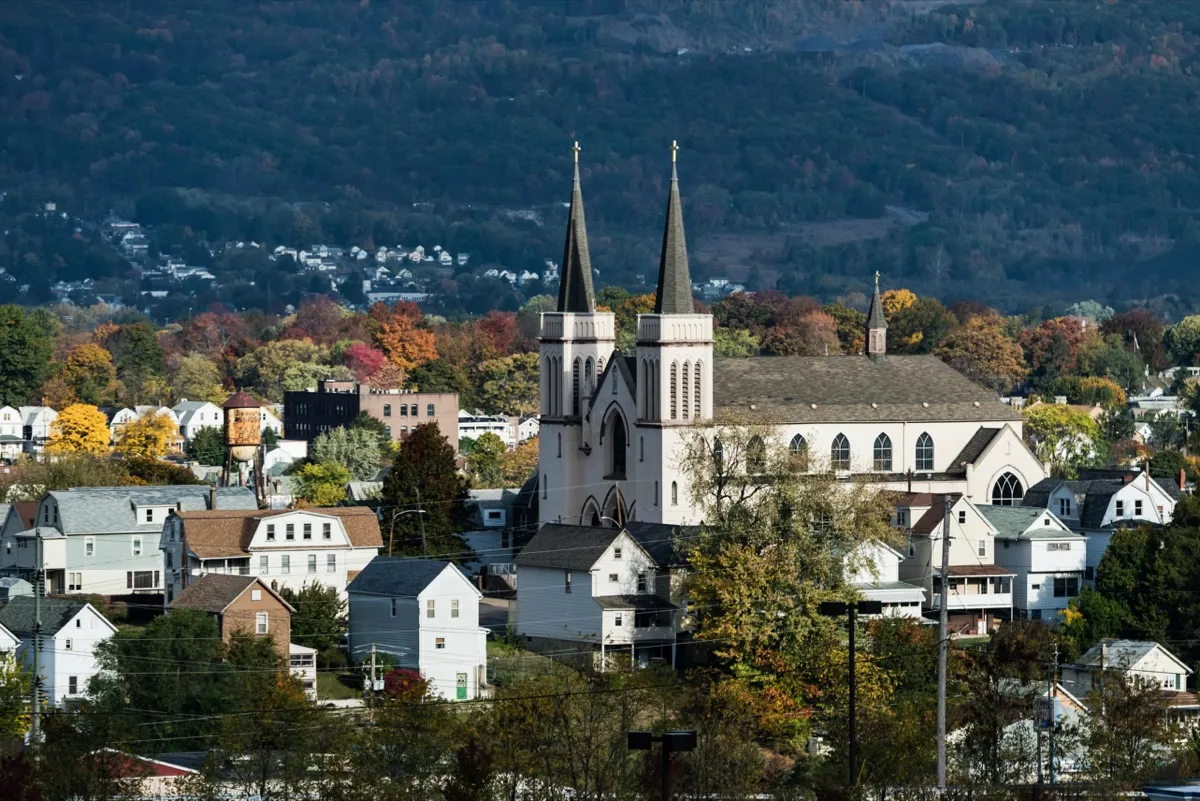
Residents who've experienced violent crime, or knows someone who has: 8 percent
Hate groups per capita: 2.81
Hate crimes per capita: 0.33
Workplace discrimination complaints per capita: 33.9
Hate Index Score: 26.85
36
Kansas

Residents who've experienced violent crime, or knows someone who has: 10 percent
Hate groups per capita: 1.03
Hate crimes per capita: 2.99
Workplace discrimination complaints per capita: 25.2
Hate Index Score: 26.90
35
Oklahoma

Residents who've experienced violent crime, or knows someone who has: 10 percent
Hate groups per capita: 2.54
Hate crimes per capita: 0.71
Workplace discrimination complaints per capita: 34.4
Hate Index Score: 31.04
34
Massachusetts
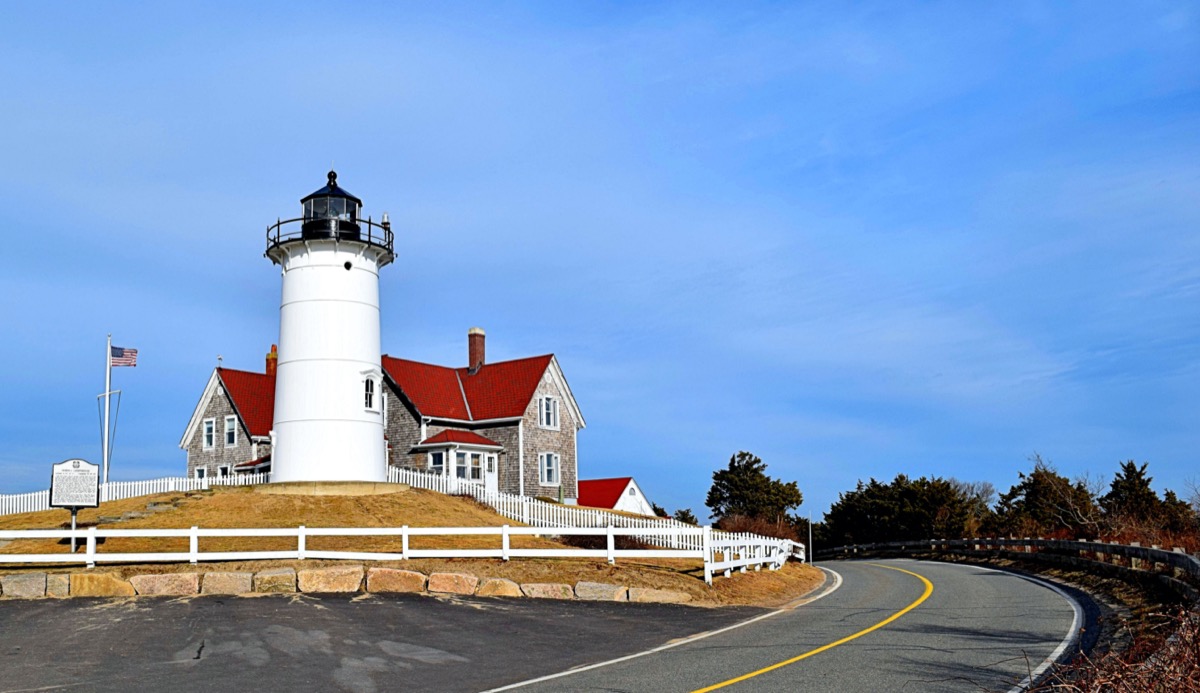
Residents who've experienced violent crime, or knows someone who has: 8 percent
Hate groups per capita: 2.18
Hate crimes per capita: 5.73
Workplace discrimination complaints per capita: 6.4
Hate Index Score: 35.64
33
Wisconsin

Residents who've experienced violent crime, or knows someone who has: 18 percent
Hate groups per capita: 2.58
Hate crimes per capita: 1.27
Workplace discrimination complaints per capita: 1.74
Hate Index Score: 37.43
32
Michigan

Residents who've experienced violent crime, or knows someone who has: 4 percent
Hate groups per capita: 2.70
Hate crimes per capita: 4.35
Workplace discrimination complaints per capita: 25.8
Hate Index Score: 37.62
31
California
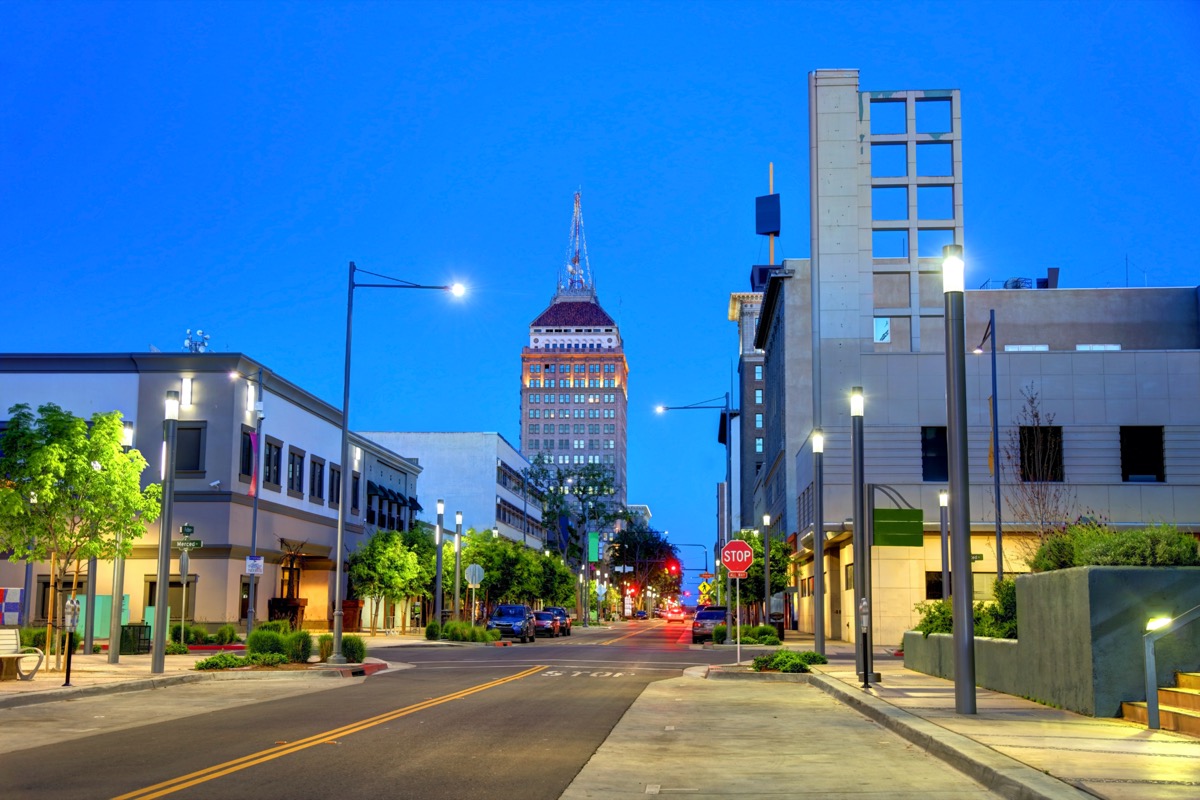
Residents who've experienced violent crime, or knows someone who has: 16 percent
Hate groups per capita: 2.23
Hate crimes per capita: 2.57
Workplace discrimination complaints per capita: 16.0
Hate Index Score: 38.00
And for the place most lacking in integrity, This Is the Most Corrupt State in America.
30
Vermont
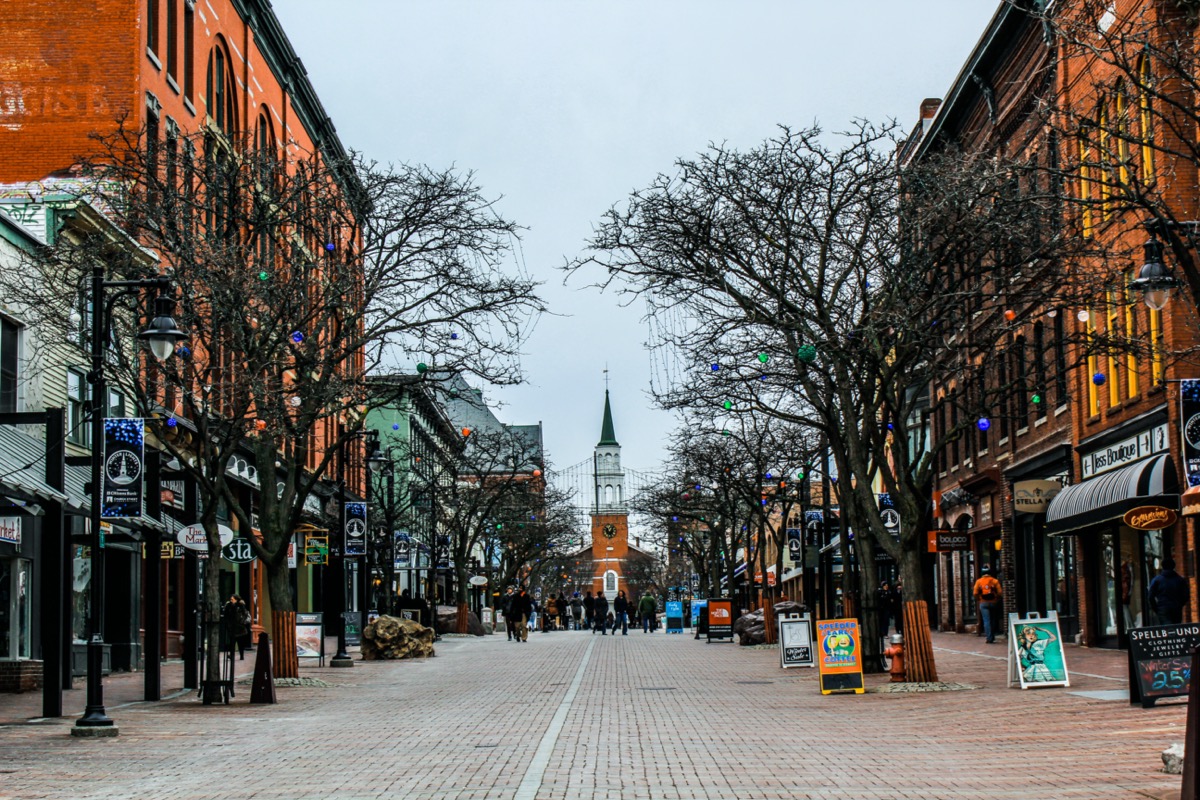
Residents who've experienced violent crime, or knows someone who has: 7 percent
Hate groups per capita: 3.20
Hate crimes per capita: 5.25
Workplace discrimination complaints per capita: 5.3
Hate Index Score: 38.01
29
New York
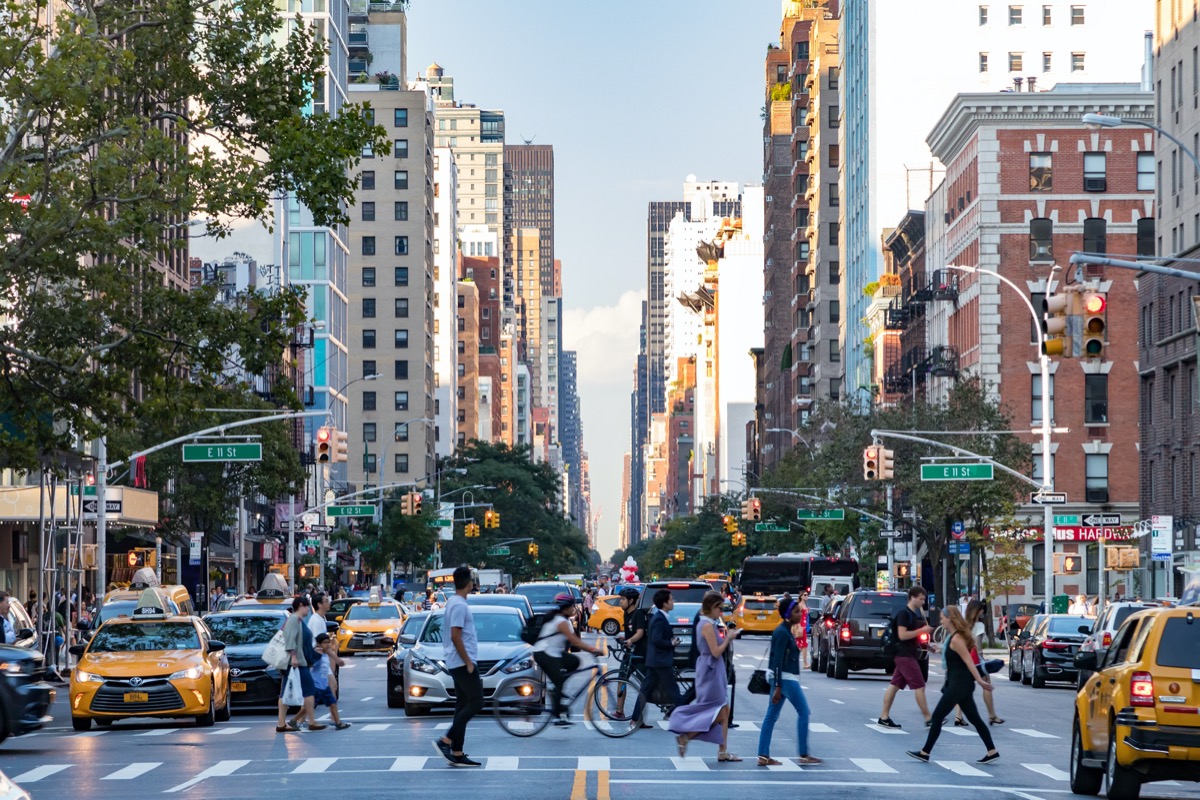
Residents who've experienced violent crime, or knows someone who has: 13 percent
Hate groups per capita: 2.25
Hate crimes per capita: 3.22
Workplace discrimination complaints per capita: 19.1
Hate Index Score: 38.89
28
New Jersey

Residents who've experienced violent crime, or knows someone who has: 6 percent
Hate groups per capita: 2.36
Hate crimes per capita: 5.46
Workplace discrimination complaints per capita: 18.6
Hate Index Score: 40.34
27
Illinois
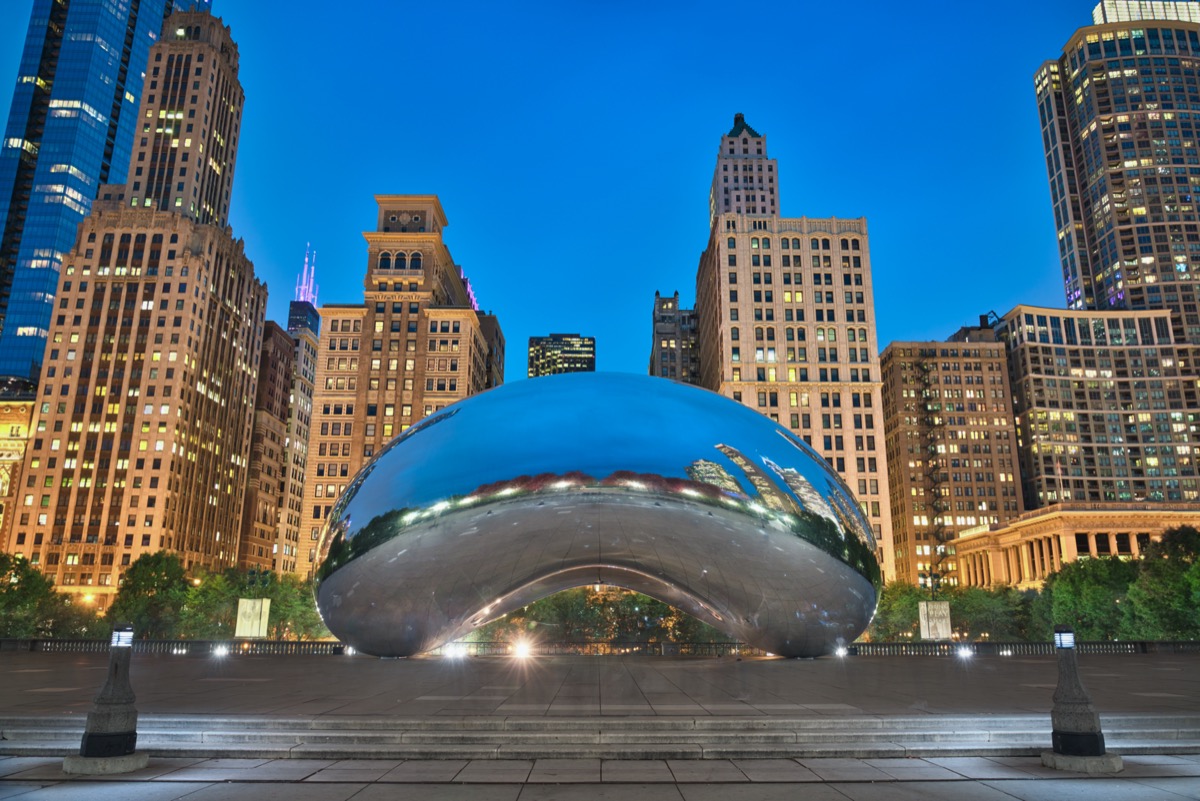
Residents who've experienced violent crime, or knows someone who has: 16 percent
Hate groups per capita: 2.04
Hate crimes per capita: 0.54
Workplace discrimination complaints per capita: 39.5
Hate Index Score: 40.62
And for more on the place that's filled with some scandalous activities, This Is the Freakiest State in America.
26
Virginia

Residents who've experienced violent crime, or knows someone who has: 4 percent
Hate groups per capita: 4.23
Hate crimes per capita: 1.91
Workplace discrimination complaints per capita: 35.2
Hate Index Score: 41.08
25
Delaware
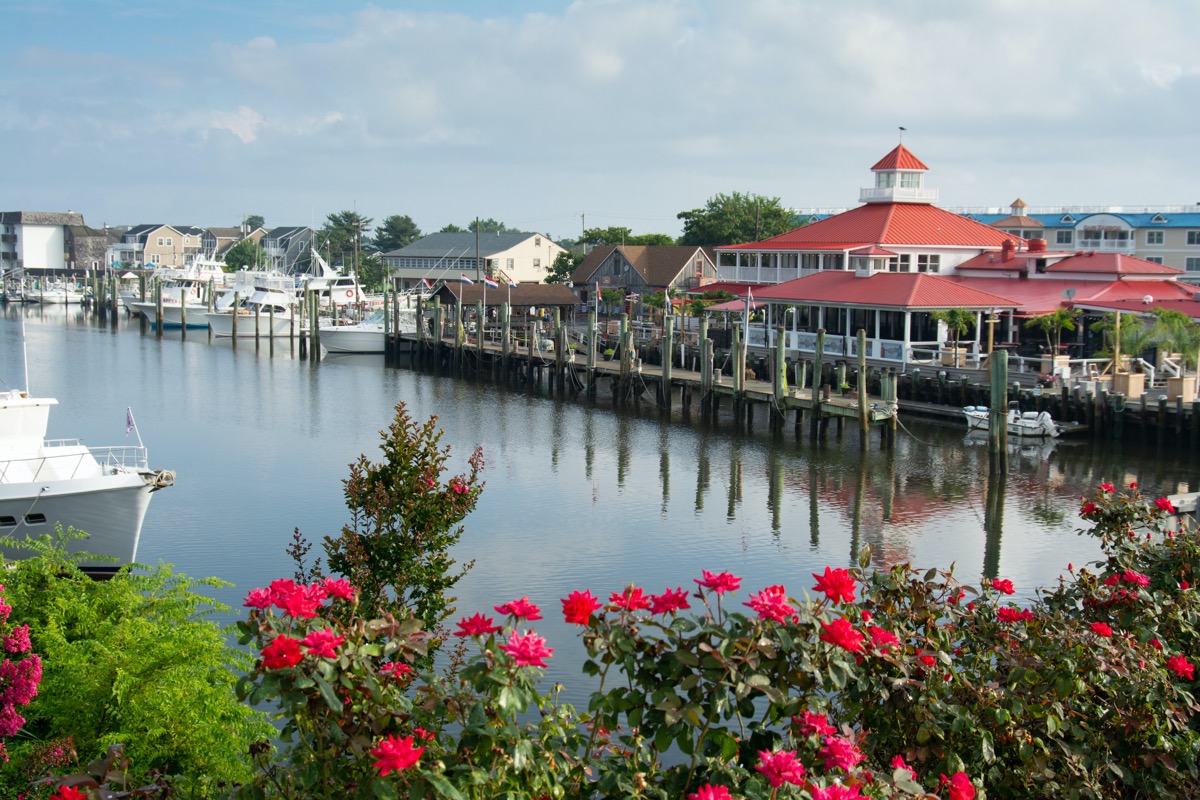
Residents who've experienced violent crime, or knows someone who has: 15 percent
Hate groups per capita: 3.11
Hate crimes per capita: 2.26
Workplace discrimination complaints per capita: 17.4
Hate Index Score: 42.02
24
Texas
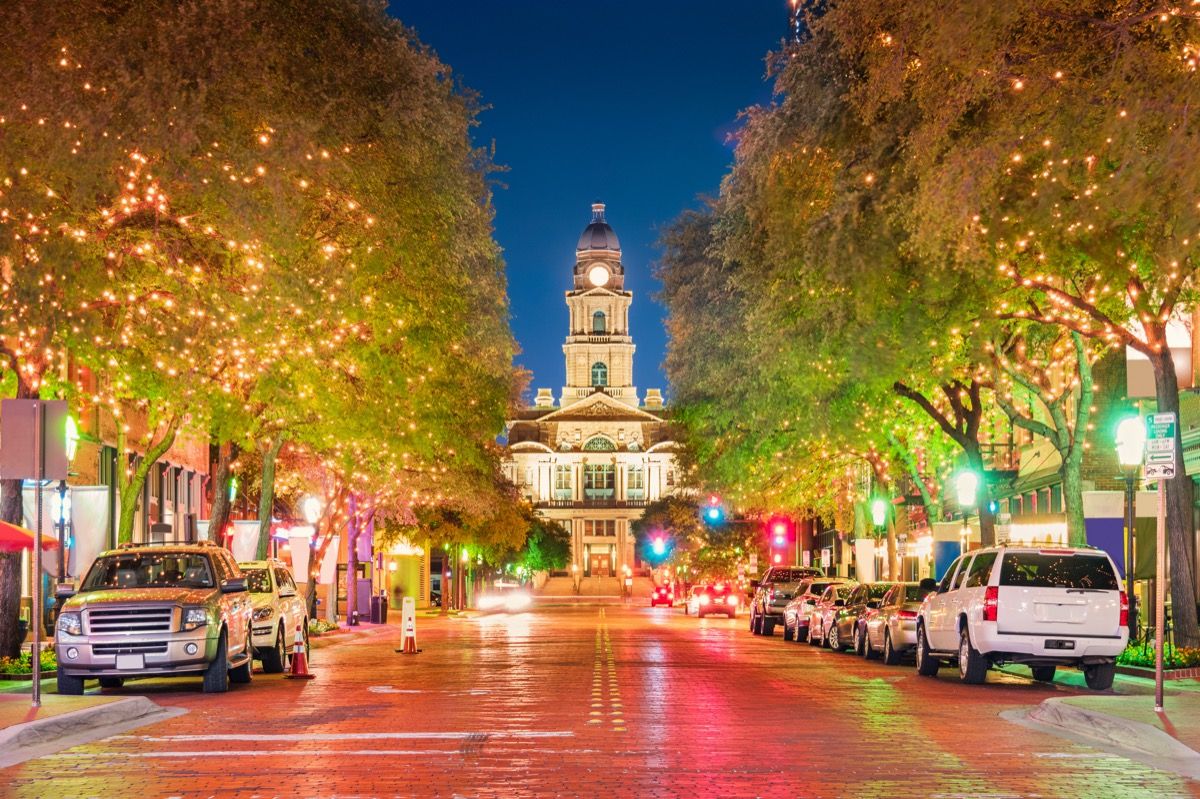
Residents who've experienced violent crime, or knows someone who has: 16 percent
Hate groups per capita: 2.20
Hate crimes per capita: 1.58
Workplace discrimination complaints per capita: 31.1
Hate Index Score: 42.30
And for more on the state where people struggle to trust each other, This Is the Most Jealous State in America.
23
South Dakota

Residents who've experienced violent crime, or knows someone who has: 13 percent
Hate groups per capita: 4.55
Hate crimes per capita: 2.36
Workplace discrimination complaints per capita: 6.8
Hate Index Score: 42.68
22
Montana

Residents who've experienced violent crime, or knows someone who has: 8 percent
Hate groups per capita: 5.66
Hate crimes per capita: 3.03
Workplace discrimination complaints per capita: 2.6
Hate Index Score: 43.29
21
Alaska

Residents who've experienced violent crime, or knows someone who has: 22 percent
Hate groups per capita: 2.72
Hate crimes per capita: 1.51
Workplace discrimination complaints per capita: 12.2
Hate Index Score: 43.54
20
Florida

Residents who've experienced violent crime, or knows someone who has: 15 percent
Hate groups per capita: 3.15
Hate crimes per capita: 0.53
Workplace discrimination complaints per capita: 34.8
Hate Index Score: 44.02
And for more on the place where people are full of rage, This Is the Angriest State in America.
19
Kentucky
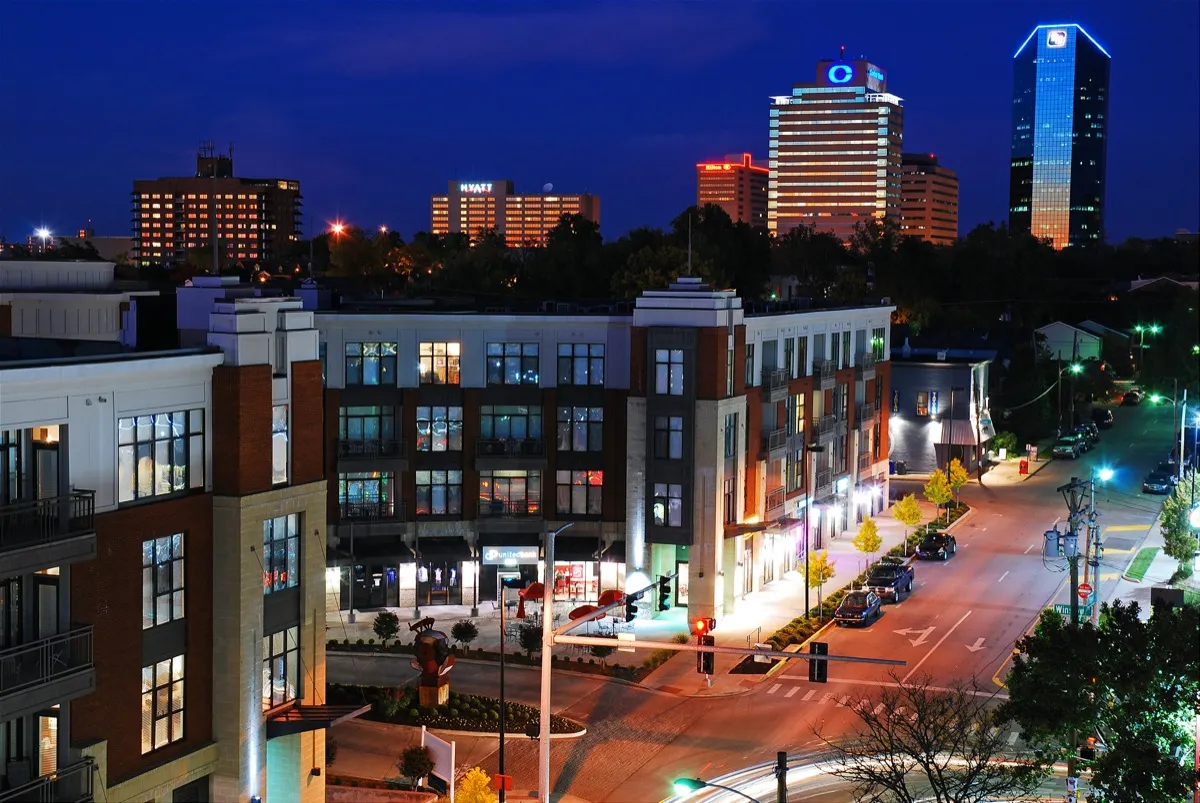
Residents who've experienced violent crime, or knows someone who has: 11 percent
Hate groups per capita: 3.36
Hate crimes per capita: 3.27
Workplace discrimination complaints per capita: 21.3
Hate Index Score: 45.63
18
Arizona

Residents who've experienced violent crime, or knows someone who has: 8 percent
Hate groups per capita: 2.93
Hate crimes per capita: 3.27
Workplace discrimination complaints per capita: 34.0
Hate Index Score: 45.74
17
Missouri

Residents who've experienced violent crime, or knows someone who has: 13 percent
Hate groups per capita: 3.43
Hate crimes per capita: 1.37
Workplace discrimination complaints per capita: 33.5
Hate Index Score: 46.69
16
Hawaii

Residents who've experienced violent crime, or knows someone who has: 11 percent
Hate groups per capita: 2.82
Hate crimes per capita: 4.21
Workplace discrimination complaints per capita: 22.6
Hate Index Score: 48.01
15
Oregon

Residents who've experienced violent crime, or knows someone who has: 14 percent
Hate groups per capita: 3.59
Hate crimes per capita: 4.31
Workplace discrimination complaints per capita: 5.9
Hate Index Score: 48.36
14
Nevada

Residents who've experienced violent crime, or knows someone who has: 15 percent
Hate groups per capita: 2.97
Hate crimes per capita: 1.43
Workplace discrimination complaints per capita: 38.2
Hate Index Score: 50.49
13
Colorado
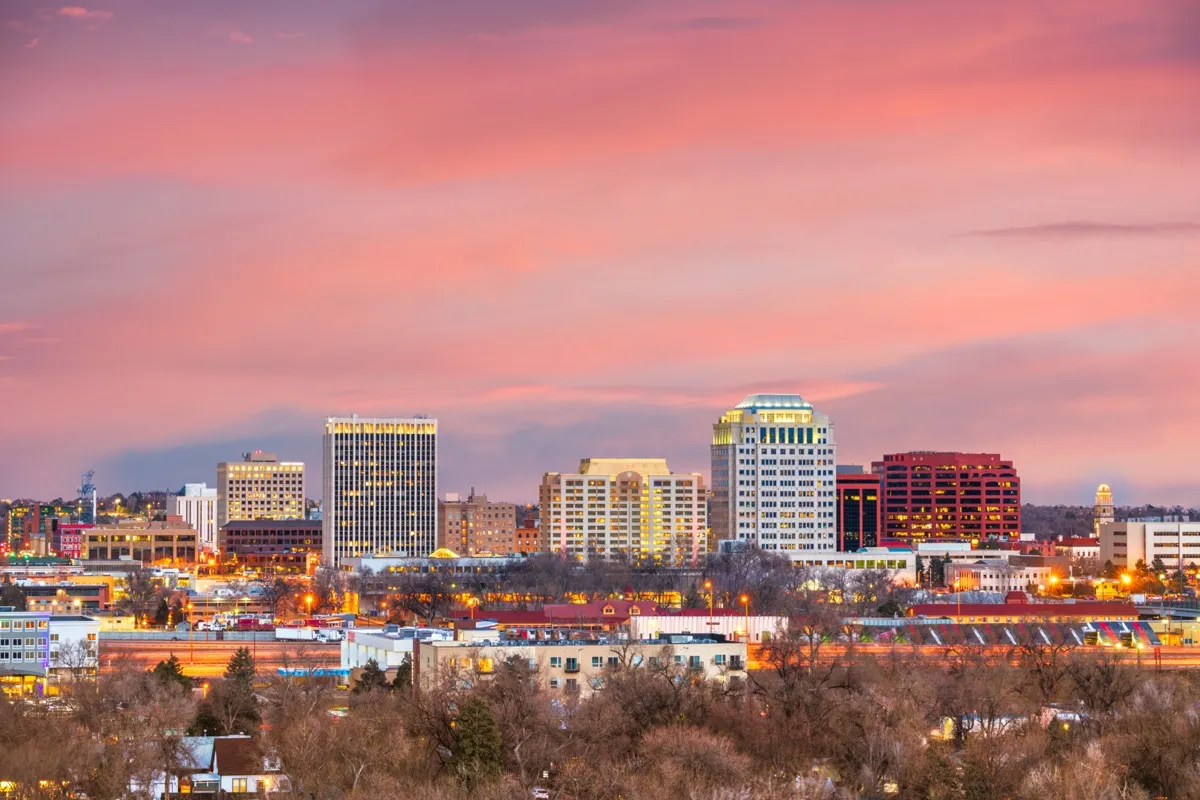
Residents who've experienced violent crime, or knows someone who has: 6 percent
Hate groups per capita: 3.87
Hate crimes per capita: 3.68
Workplace discrimination complaints per capita: 33.5
Hate Index Score: 51.44
12
Maryland

Residents who've experienced violent crime, or knows someone who has: 18 percent
Hate groups per capita: 3.31
Hate crimes per capita: 0.30
Workplace discrimination complaints per capita: 38.9
Hate Index Score: 52.12
11
North Carolina
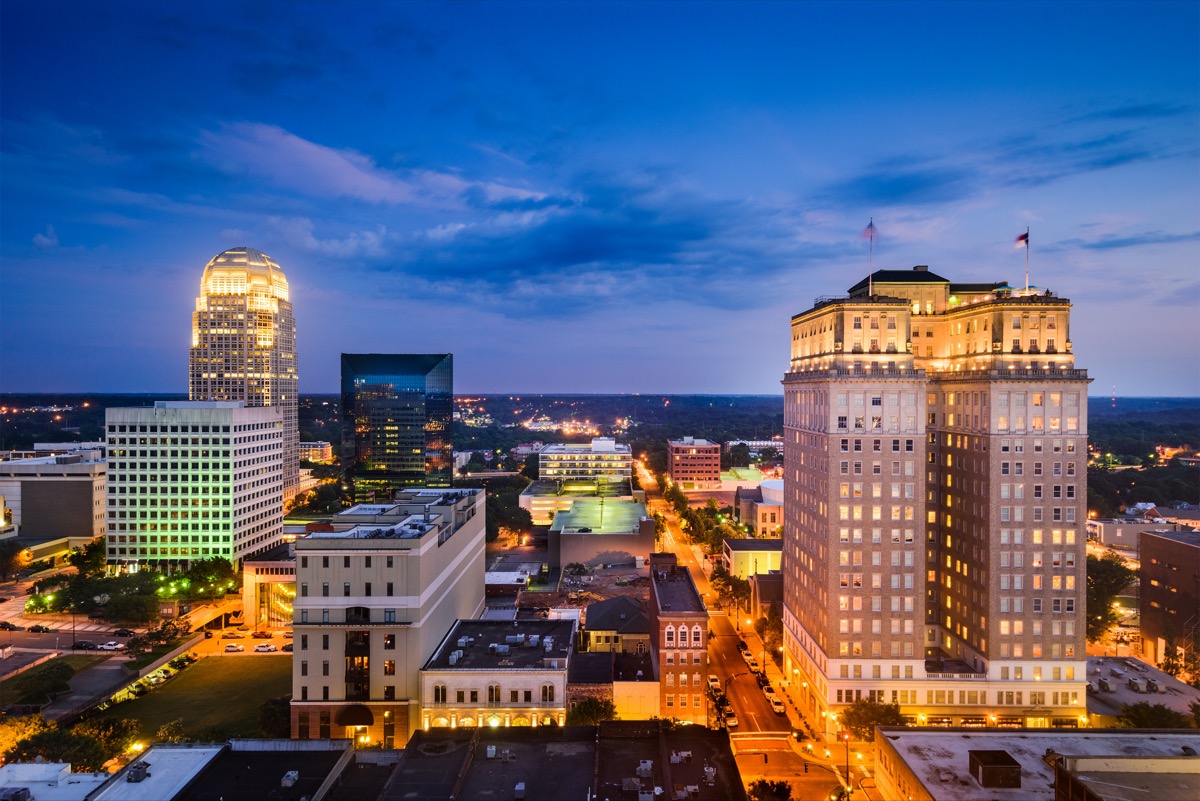
Residents who've experienced violent crime, or knows someone who has: 11 percent
Hate groups per capita: 3.08
Hate crimes per capita: 2.40
Workplace discrimination complaints per capita: 42.4
Hate Index Score: 52.92
10
Indiana

Residents who've experienced violent crime, or knows someone who has: 14 percent
Hate groups per capita: 2.99
Hate crimes per capita: 2.06
Workplace discrimination complaints per capita: 41.0
Hate Index Score: 54.55
And for more exclusive state guides delivered straight to your inbox, sign up for our daily newsletter.
9
Georgia

Residents who've experienced violent crime, or knows someone who has: 11 percent
Hate groups per capita: 3.08
Hate crimes per capita: 2.40
Workplace discrimination complaints per capita: 42.4
Hate Index Score: 54.60
8
New Mexico
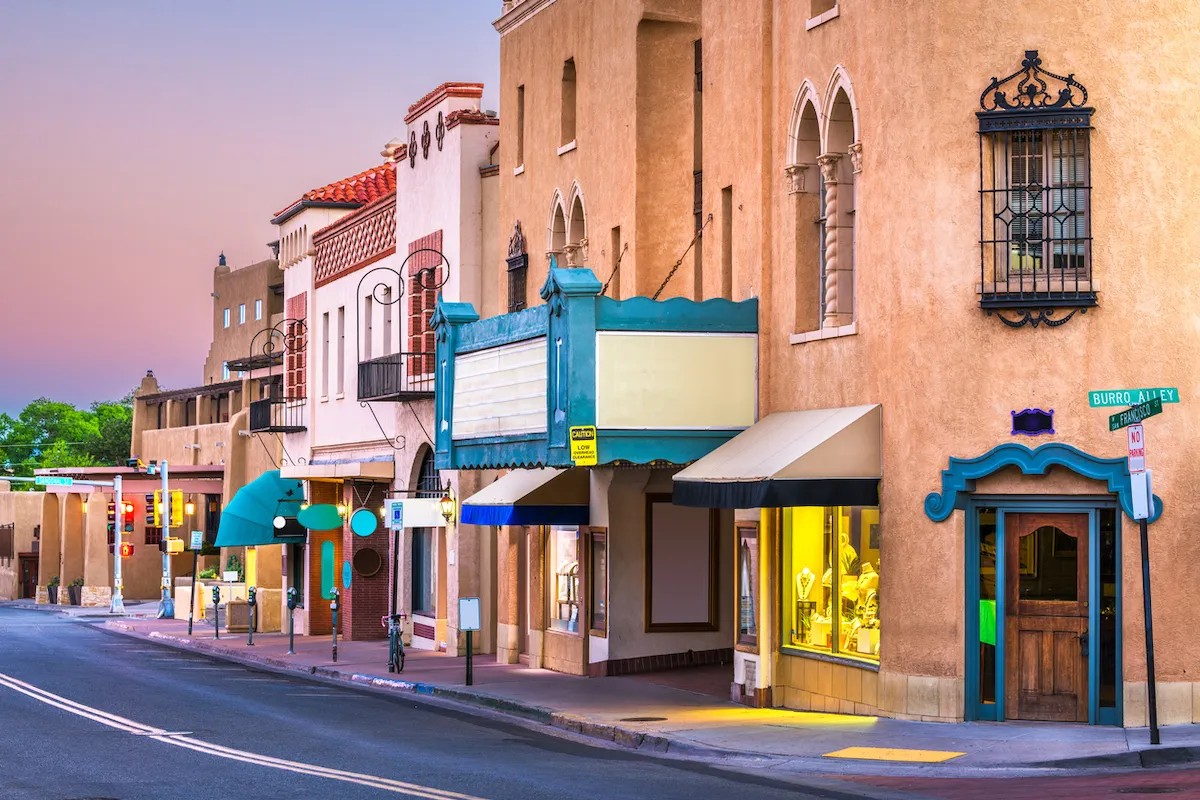
Residents who've experienced violent crime, or knows someone who has: 14 percent
Hate groups per capita: 0.48
Hate crimes per capita: 6.10
Workplace discrimination complaints per capita: 48.1
Hate Index Score: 64.84
7
Washington

Residents who've experienced violent crime, or knows someone who has: 9 percent
Hate groups per capita: 3.99
Hate crimes per capita: 7.14
Workplace discrimination complaints per capita: 16.5
Hate Index Score: 66.99
6
Louisiana

Residents who've experienced violent crime, or knows someone who has: 20 percent
Hate groups per capita: 4.51
Hate crimes per capita: 0.74
Workplace discrimination complaints per capita: 39.2
Hate Index Score: 67.78
5
Ohio

Residents who've experienced violent crime, or knows someone who has: 24 percent
Hate groups per capita: 2.65
Hate crimes per capita: 4.02
Workplace discrimination complaints per capita: 24.8
Hate Index Score: 70.70
4
Arkansas
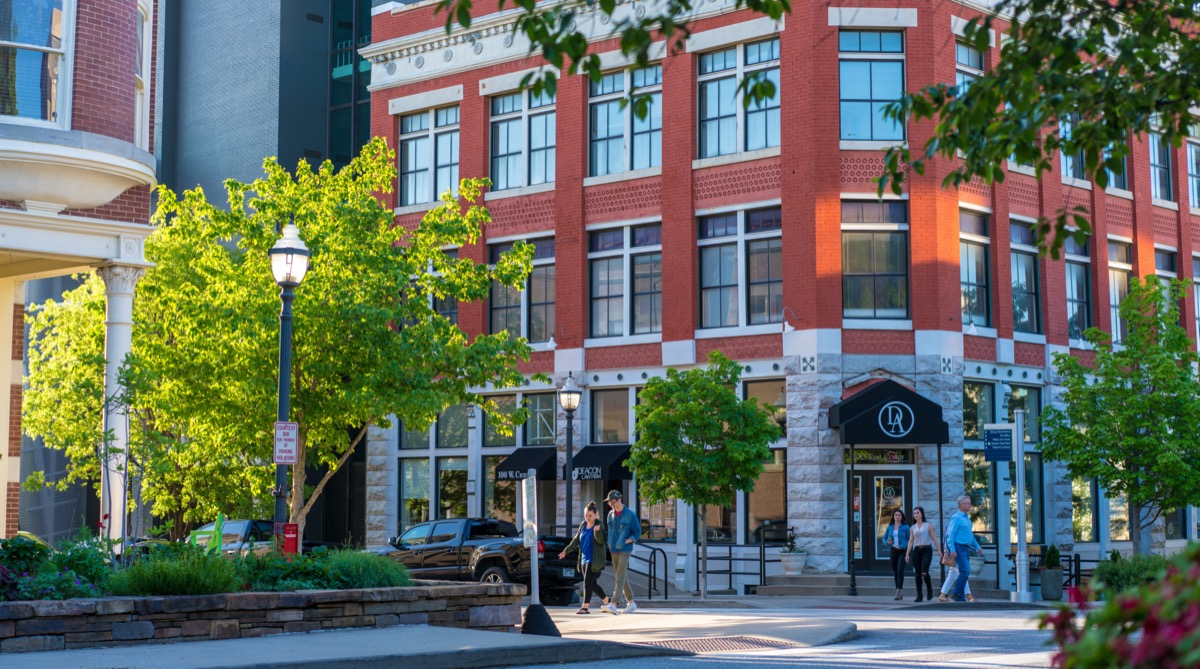
Residents who've experienced violent crime, or knows someone who has: 20 percent
Hate groups per capita: 4.98
Hate crimes per capita: 0.32
Workplace discrimination complaints per capita: 51.7
Hate Index Score: 77.64
3
Mississippi

Residents who've experienced violent crime, or knows someone who has: 18 percent
Hate groups per capita: 4.03
Hate crimes per capita: 1.59
Workplace discrimination complaints per capita: 60.8
Hate Index Score: 80.73
2
Tennessee

Residents who've experienced violent crime, or knows someone who has: 17 percent
Hate groups per capita: 5.61
Hate crimes per capita: 1.71
Workplace discrimination complaints per capita: 44.9
Hate Index Score: 80.76
1
Alabama
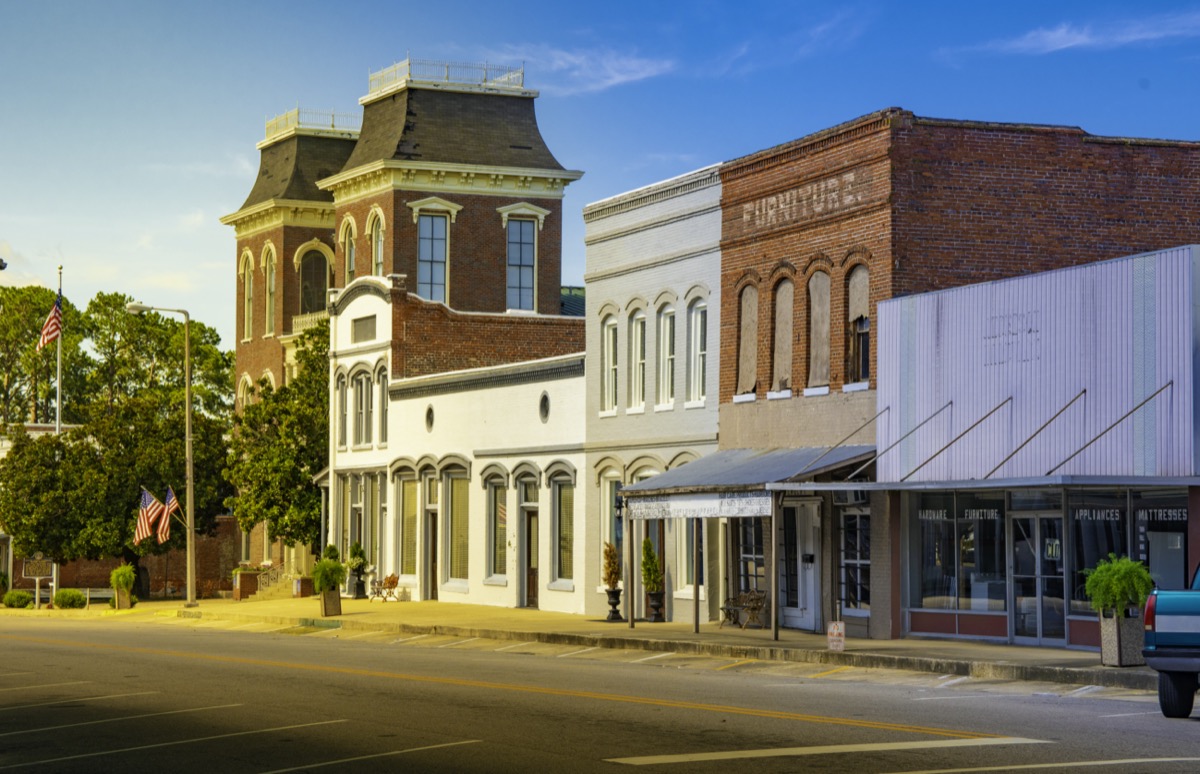
Residents who've experienced violent crime, or knows someone who has: 18 percent
Hate groups per capita: 3.27
Hate crimes per capita: n/a
Workplace discrimination complaints per capita: 62.2
Hate Index Score: 100.00
And for the one state that no one wants to go to, This Is the Most Hated State in America.


