The 50 Hardest Working Cities in the U.S.

As anyone who’s worked in a hyper-competitive job environment knows, hard work is truly infectious. But what many workers may not have realized: apparently that hyper-competitiveness can apply to more than just your team.
It applies to your entire city.
There are some places in the U.S. where people are really putting their noses to the grindstone. We know. We’ve compiled all of the relevant data on America’s 200 largest cities, factoring in, among other things, the average hours most workers log, their commute times, and even the amount of time they spend volunteering on their off-hours when they’re not content simply clocking out. So read on, and let the work ethics of your fellow citizens inspire you. And if you find yourself working more than usual, make sure you’re maximizing your space with these 20 Office Essentials.
To determine these rankings, we analyzed data from the U.S. Census and Corporation for National & Community Service, giving significant weight to the mean usual hours worked per person while taking into consideration the length of commute and how much time locals put into volunteer work in their off-hours.
50
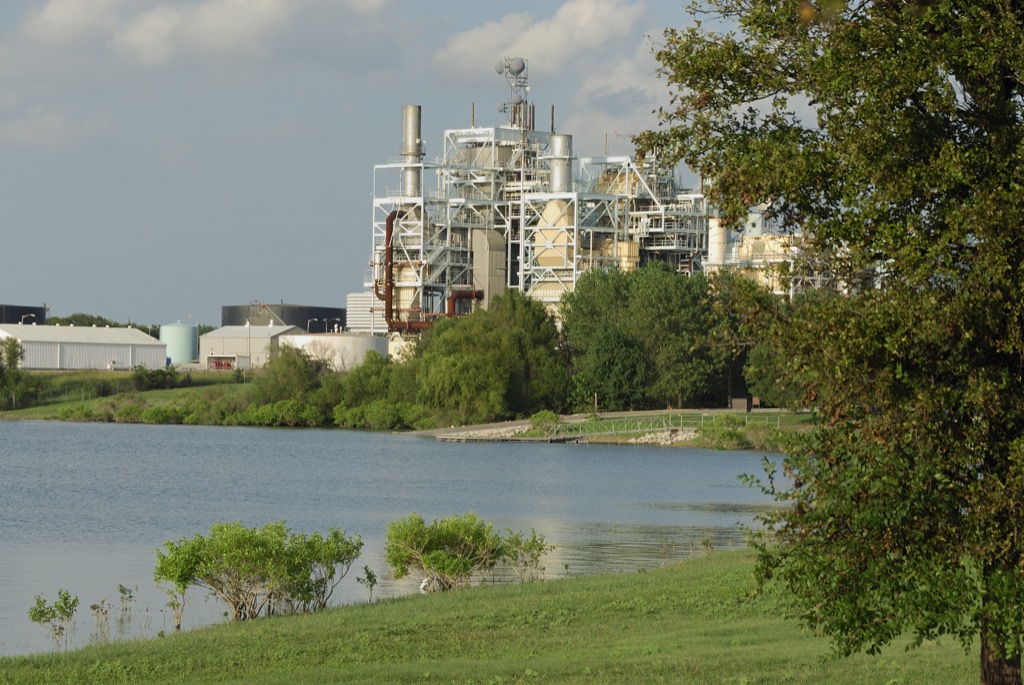
Pasadena, TX

Population: 153,351
Mean usual hours worked for workers: 40.80
Percent fully employed: 65.60%
Mean travel time to work (minutes): 25.90
Volunteer Hours Per Resident: 28.2
Hard Work Score: 67.10
49
Bellevue, WA
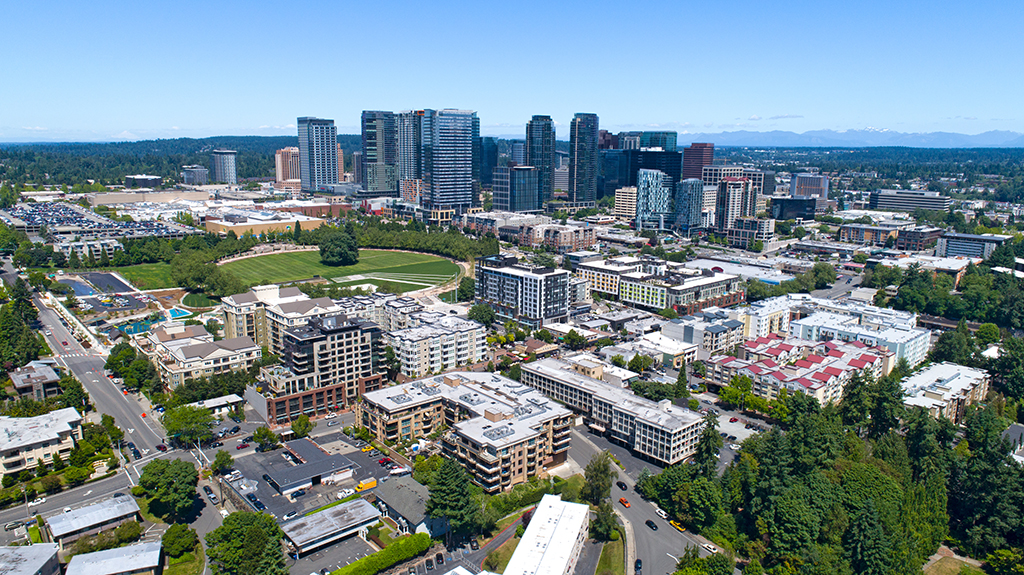
Population: 141,400
Mean usual hours worked for workers: 39.20
Percent fully employed: 67.00%
Mean travel time to work (minutes): 22.60
Volunteer Hours Per Resident: 33.40
Hard Work Score: 67.13
48
Baltimore, MD
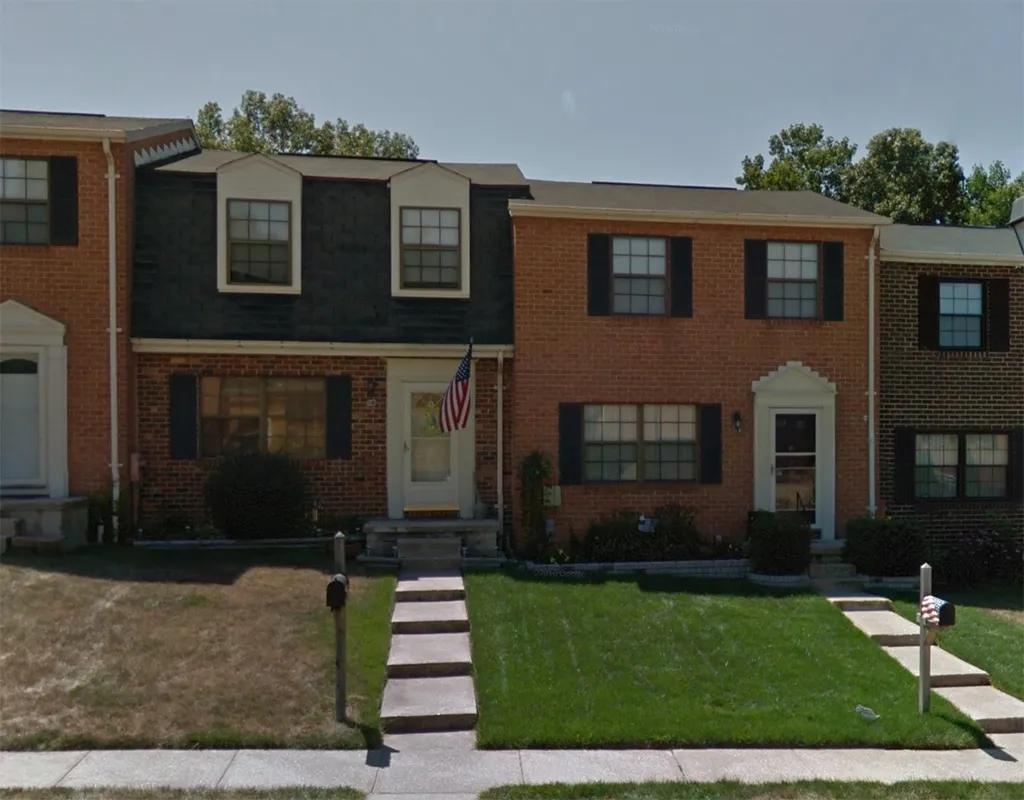
Population: 614,664
Mean usual hours worked for workers: 38.60
Percent fully employed: 64.70%
Mean travel time to work (minutes): 30.50
Volunteer Hours Per Resident: 29.50
Hard Work Score: 67.30
If you’re working hard and toward an early retirement, make sure to check 31 essential saving tips to get there faster.
47
Garland, TX
Population: 234,943
Mean usual hours worked for workers: 39.20
Percent fully employed: 67.60%
Mean travel time to work (minutes): 27.90
Volunteer Hours Per Resident: 28.2
Hard Work Score: 67.37
46
Orlando, FL

Population: 277,173
Mean usual hours worked for workers: 38.60
Percent fully employed: 65.30%
Mean travel time to work (minutes): 25.10
Volunteer Hours Per Resident: 34.60
Hard Work Score: 67.40
45
Phoenix, AZ

Population: 1,615,017
Mean usual hours worked for workers: 38.80
Percent fully employed: 66.80%
Mean travel time to work (minutes): 24.80
Volunteer Hours Per Resident: 33.30
Hard Work Score: 67.50
Sometimes it’s hard to stay motivated. These life-changing lessons from successful men are here to keep you on track.
44
Glendale, AZ

Population: 245,895
Mean usual hours worked for workers: 38.20
Percent fully employed: 66.00%
Mean travel time to work (minutes): 27.20
Volunteer Hours Per Resident: 33.7
Hard Work Score: 67.77
43
Scottsdale, AZ

Population: 246,645
Mean usual hours worked for workers: 40.20
Percent fully employed: 67.70%
Mean travel time to work (minutes): 21.90
Volunteer Hours Per Resident: 33.30
Hard Work Score: 67.77
42
Killeen, TX
Population: 143,400
Mean usual hours worked for workers: 42.50
Percent fully employed: 69.20%
Mean travel time to work (minutes): 21.10
Volunteer Hours Per Resident: 28.2
Hard Work Score: 67.83
41
Midland, TX

Population: 134,610
Mean usual hours worked for workers: 42.90
Percent fully employed: 71.20%
Mean travel time to work (minutes): 18.50
Volunteer Hours Per Resident: 28.2
Hard Work Score: 67.90
40
Lakewood,CO
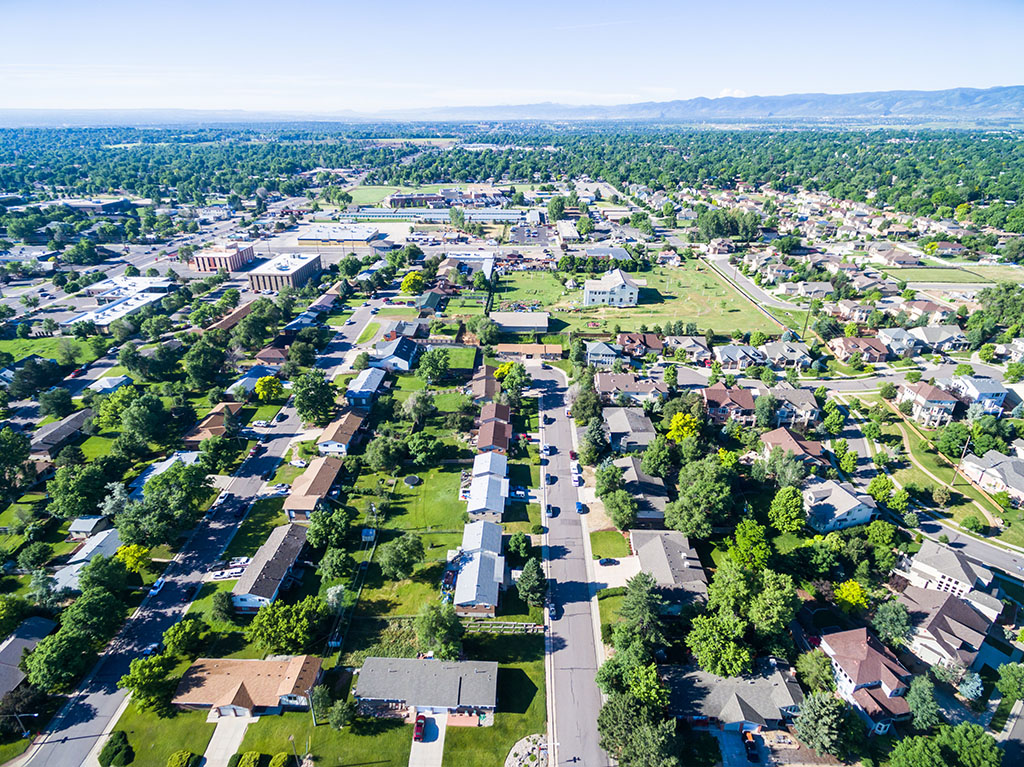
Population: 154,393
Mean usual hours worked for workers: 38.40
Percent fully employed: 66.40%
Mean travel time to work (minutes): 25.80
Volunteer Hours Per Resident: 34.7
Hard Work Score: 67.90
39
Irving, TX

Population: 238,289
Mean usual hours worked for workers: 40.30
Percent fully employed: 71.50%
Mean travel time to work (minutes): 23.40
Volunteer Hours Per Resident: 28.2
Hard Work Score: 67.90
38
Charlotte, NC

Population: 842,051
Mean usual hours worked for workers: 39.50
Percent fully employed: 64.80%
Mean travel time to work (minutes): 24.90
Volunteer Hours Per Resident: 35.00
Hard Work Score: 67.90
37
Elk Grove, CA

Population: 169,743
Mean usual hours worked for workers: 37.90
Percent fully employed: 65.70%
Mean travel time to work (minutes): 31.10
Volunteer Hours Per Resident: 31.2
Hard Work Score: 67.93
36
Kansas City, MO

Population: 481,420
Mean usual hours worked for workers: 38.90
Percent fully employed: 66.10%
Mean travel time to work (minutes): 21.60
Volunteer Hours Per Resident: 38.40
Hard Work Score: 67.97
35
Chicago, IL

Population: 2,704,958
Mean usual hours worked for workers: 38.60
Percent fully employed: 64.70%
Mean travel time to work (minutes): 34.10
Volunteer Hours Per Resident: 27.90
Hard Work Score: 67.97
34
Pembroke Pines, FL
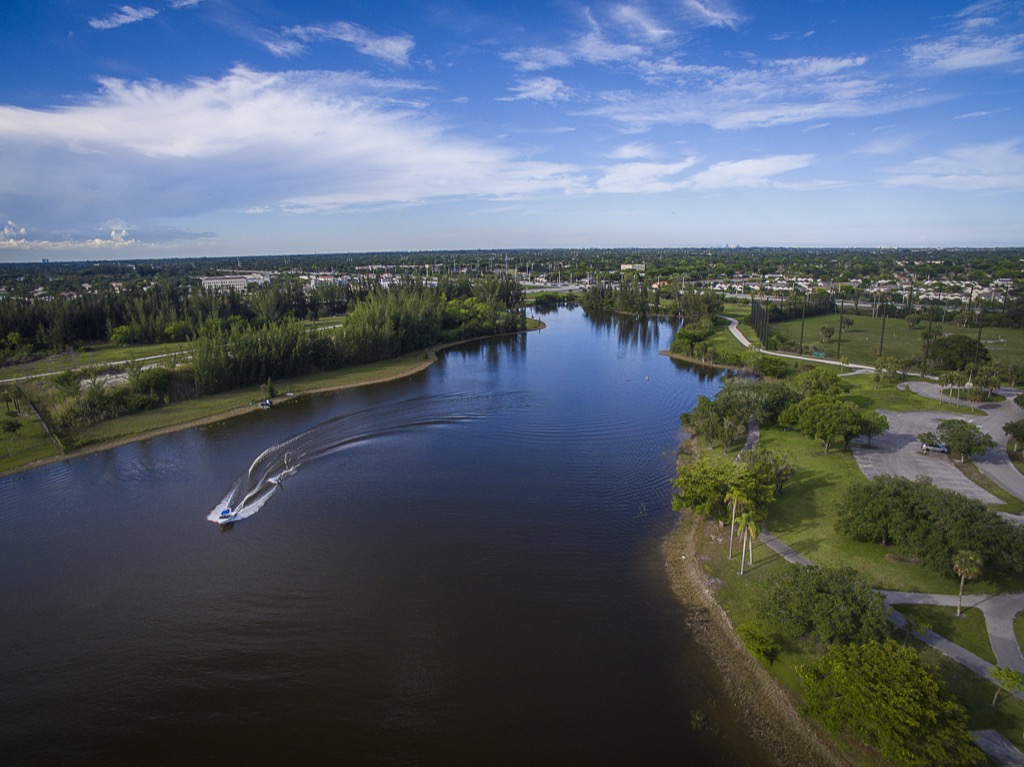
Population: 168,587
Mean usual hours worked for workers: 38.70
Percent fully employed: 67.60%
Mean travel time to work (minutes): 30.60
Volunteer Hours Per Resident: 28.8
Hard Work Score: 68.13
33
Naperville, IL
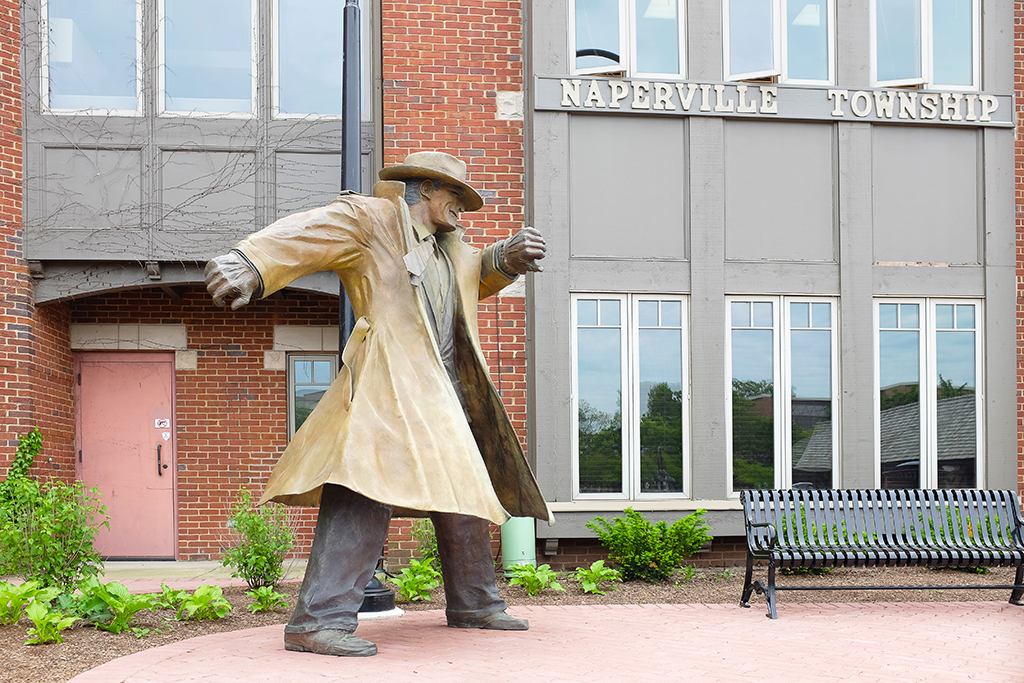
Population: 147,122
Mean usual hours worked for workers: 38.80
Percent fully employed: 65.50%
Mean travel time to work (minutes): 33.60
Volunteer Hours Per Resident: 27.90
Hard Work Score: 68.20
32
Mesquite, TX
Population: 143,736
Mean usual hours worked for workers: 39.40
Percent fully employed: 68.50%
Mean travel time to work (minutes): 29.50
Volunteer Hours Per Resident: 28.2
Hard Work Score: 68.33
31
Overland Park, KS

Population: 188,966
Mean usual hours worked for workers: 40.60
Percent fully employed: 68.30%
Mean travel time to work (minutes): 20.70
Volunteer Hours Per Resident: 34.8
Hard Work Score: 68.33
Fort Worth, TX
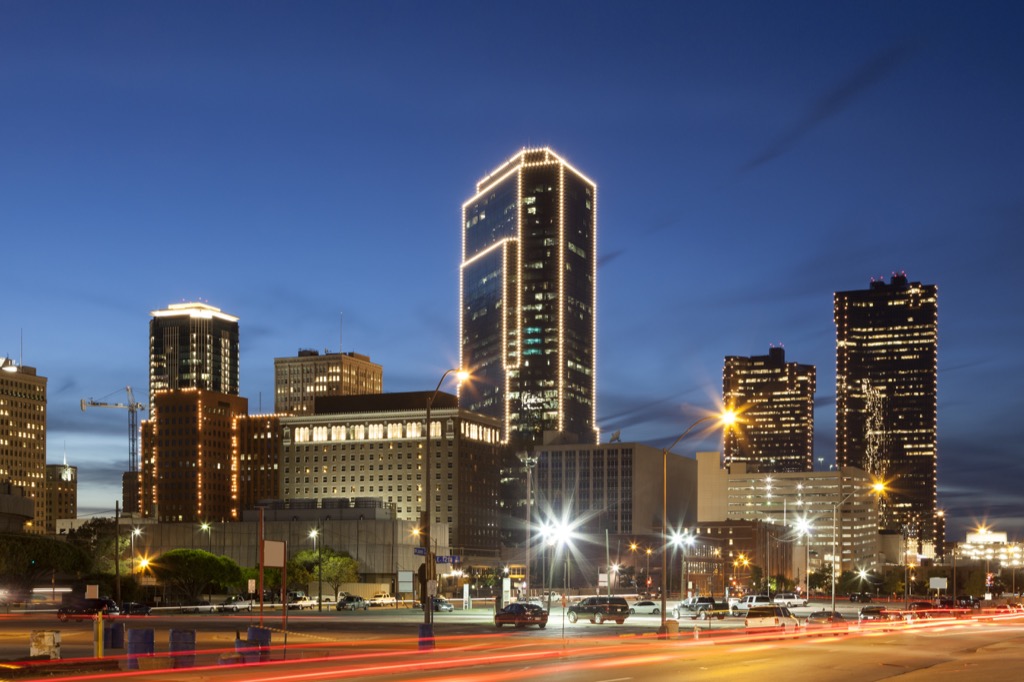
Population: 854,113
Mean usual hours worked for workers: 39.80
Percent fully employed: 67.70%
Mean travel time to work (minutes): 26.30
Volunteer Hours Per Resident: 31.60
Hard Work Score: 68.40
29
Grand Prairie, TX

Population: 190,682
Mean usual hours worked for workers: 39.60
Percent fully employed: 70.90%
Mean travel time to work (minutes): 27.10
Volunteer Hours Per Resident: 28.2
Hard Work Score: 68.47
28
San Jose, CA

Population: 1,025,350
Mean usual hours worked for workers: 37.90
Percent fully employed: 64.60%
Mean travel time to work (minutes): 27.50
Volunteer Hours Per Resident: 38.00
Hard Work Score: 68.63
27
Dallas, TX

Population: 1,317,929
Mean usual hours worked for workers: 39.90
Percent fully employed: 69.00%
Mean travel time to work (minutes): 26.00
Volunteer Hours Per Resident: 31.60
Hard Work Score: 68.80
26
Newport News, VA

Population: 181,825
Mean usual hours worked for workers: 38.70
Percent fully employed: 63.60%
Mean travel time to work (minutes): 23.00
Volunteer Hours Per Resident: 42.50
Hard Work Score: 68.83
25
Miramar, FL

Population: 138,449
Mean usual hours worked for workers: 38.90
Percent fully employed: 69.50%
Mean travel time to work (minutes): 30.70
Volunteer Hours Per Resident: 28.8
Hard Work Score: 68.93
24
Hampton, VA

Population: 135,410
Mean usual hours worked for workers: 38.40
Percent fully employed: 65.60%
Mean travel time to work (minutes): 22.20
Volunteer Hours Per Resident: 42.3
Hard Work Score: 68.97
23
Peoria, AZ

Population: 164,173
Mean usual hours worked for workers: 39.10
Percent fully employed: 68.10%
Mean travel time to work (minutes): 27.40
Volunteer Hours Per Resident: 33.7
Hard Work Score: 69.13
22
Plano, TX

Population: 286,057
Mean usual hours worked for workers: 40.50
Percent fully employed: 72.50%
Mean travel time to work (minutes): 26.00
Volunteer Hours Per Resident: 28.2
Hard Work Score: 69.23
21
San Francisco, CA

Population: 870,887
Mean usual hours worked for workers:39.80
Percent fully employed: 65.00%
Mean travel time to work (minutes): 31.70
Volunteer Hours Per Resident: 31.90
Hard Work Score: 69.40
20
Palmdale, CA

Population: 157,356
Mean usual hours worked for workers: 37.50
Percent fully employed: 62.00%
Mean travel time to work (minutes): 40.70
Volunteer Hours Per Resident: 31.2
Hard Work Score: 69.63
19
Lancaster, CA

Population: 160,106
Mean usual hours worked for workers: 38.00
Percent fully employed: 71.60
Mean travel time to work (minutes): 31.10
Volunteer Hours Per Resident: 31.2
Hard Work Score: 69.97
18
San Diego, CA
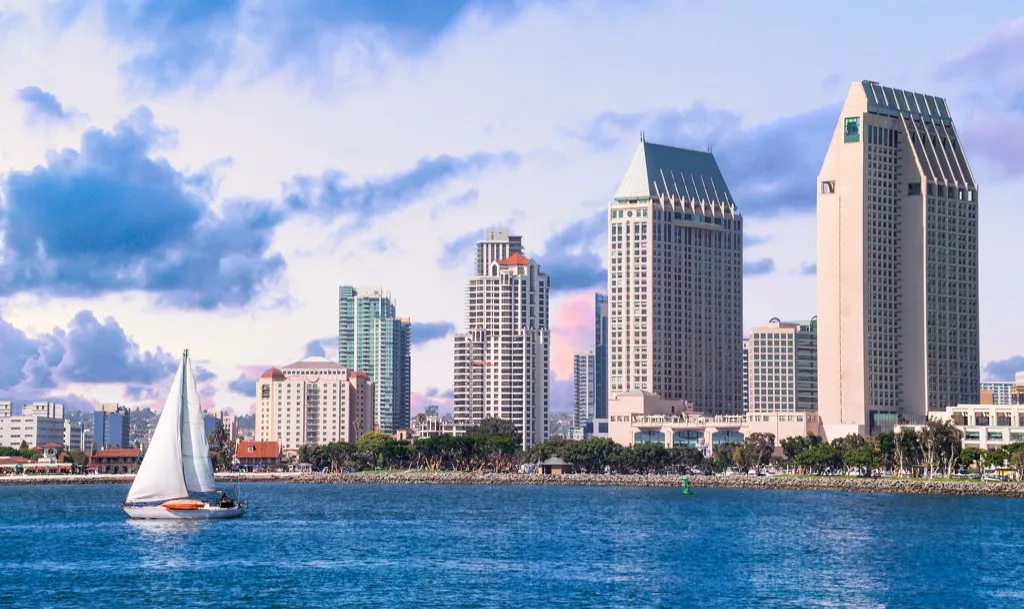
Population: 1,406,630
Mean usual hours worked for workers: 38.30
Percent fully employed: 64.00%
Mean travel time to work (minutes): 23.20
Volunteer Hours Per Resident: 46.50
Hard Work Score: 70.10
17
Fremont, CA

Population: 233,136
Mean usual hours worked for workers: 38.30
Percent fully employed: 70.30%
Mean travel time to work (minutes): 32.00
Volunteer Hours Per Resident: 31.90
Hard Work Score: 70.27
16
Corona, CA
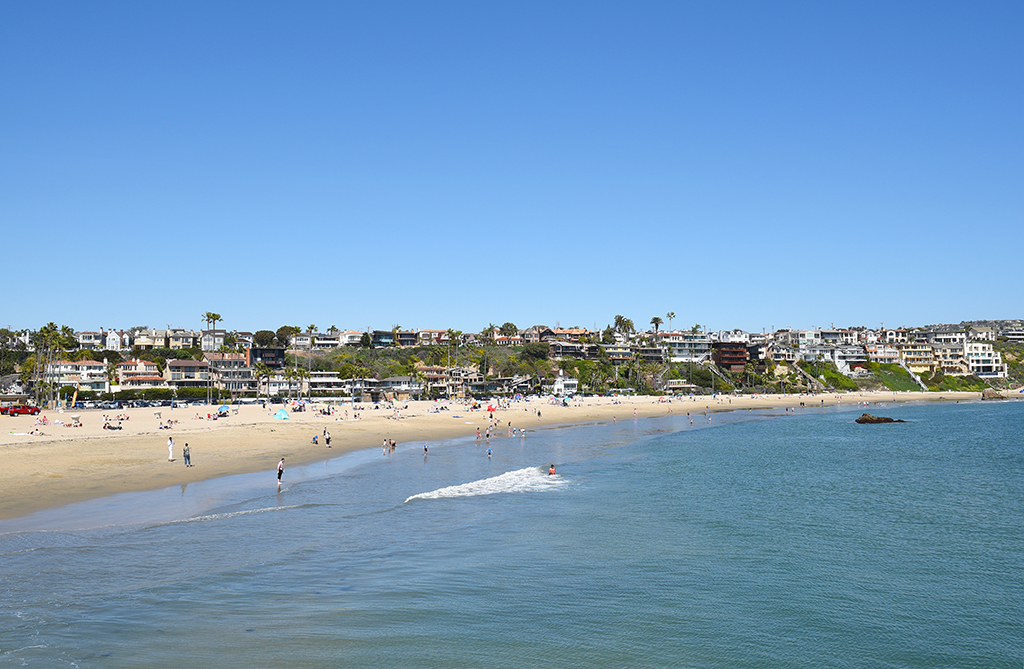
Population: 166,785
Mean usual hours worked for workers: 38.10
Percent fully employed: 67.80%
Mean travel time to work (minutes): 35.70
Volunteer Hours Per Resident: 31.2
Hard Work Score: 70.30
15
Sunnyvale, CA

Population: 152,771
Mean usual hours worked for workers: 39.60
Percent fully employed: 70.70%
Mean travel time to work (minutes): 23.60
Volunteer Hours Per Resident: 38.00
Hard Work Score: 70.50
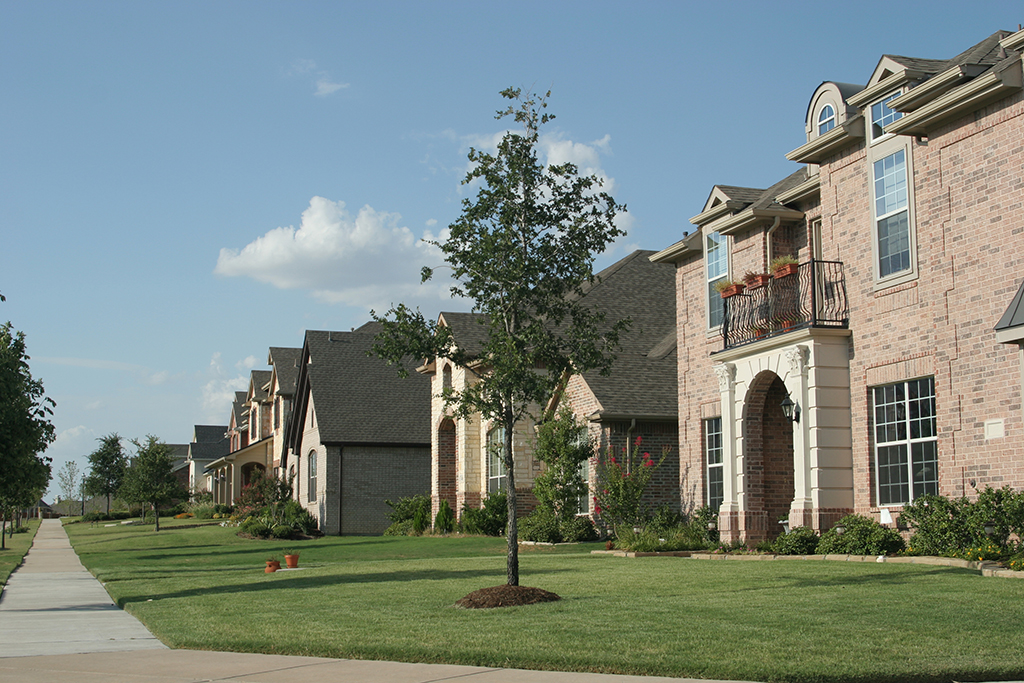
14
McKinney, TX
Population: 172,298
Mean usual hours worked for workers: 40.5
Percent fully employed: 73.70%
Mean travel time to work (minutes): 29.10
Volunteer Hours Per Resident: 28.2
Hard Work Score: 70.67
13
Yonkers, NY
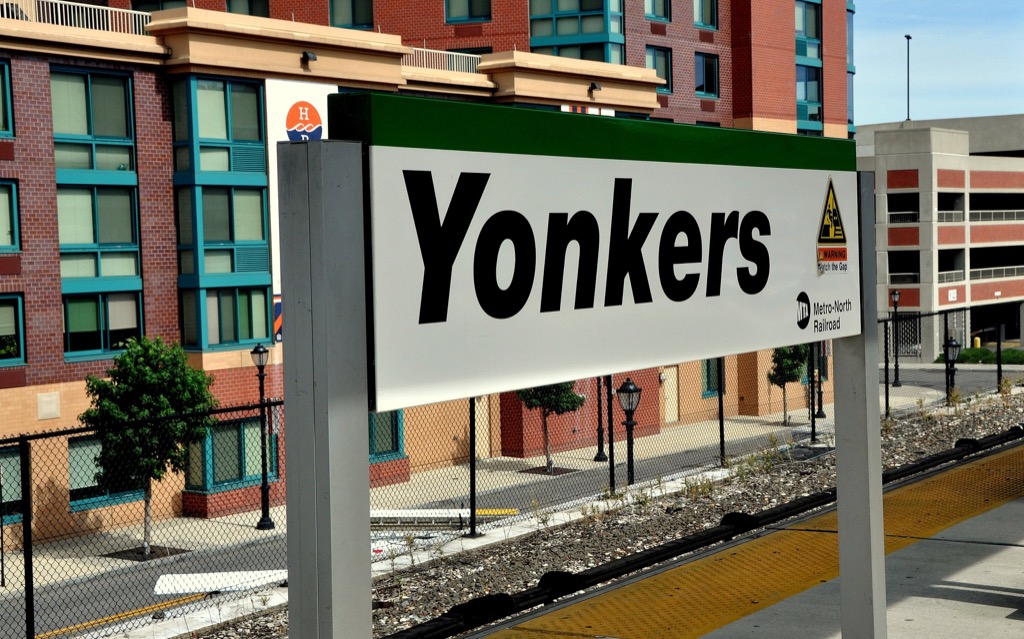
Population: 200,807
Mean usual hours worked for workers: 38.40
Percent fully employed: 67.20%
Mean travel time to work (minutes): 33.20
Volunteer Hours Per Resident: 35.3
Hard Work Score: 70.83
12
Thornton, CO

Population: 136,703
Mean usual hours worked for workers: 39.9
Percent fully employed: 68.40%
Mean travel time to work (minutes): 29.70
Volunteer Hours Per Resident: 34.7
Hard Work Score: 70.87
11
Arlington, TX

Population: 392,772
Mean usual hours worked for workers: 39.20
Percent fully employed: 66.90%
Mean travel time to work (minutes): 26.60
Volunteer Hours Per Resident: 41.30
Hard Work Score: 71.07
10
Frisco, TX

Population: 163,656
Mean usual hours worked for workers: 41.20
Percent fully employed: 73.70%
Mean travel time to work (minutes): 29.40
Volunteer Hours Per Resident: 28.2
Hard Work Score: 71.23
9
Virginia Beach, VA

Population: 452,602
Mean usual hours worked for workers: 40.20
Percent fully employed: 69.40%
Mean travel time to work (minutes): 23.20
Volunteer Hours Per Resident: 42.50
Hard Work Score: 71.83
8
Jersey City, NJ

Population: 264,152
Mean usual hours worked for workers: 39.40
Percent fully employed: 70.30%
Mean travel time to work (minutes): 36.20
Volunteer Hours Per Resident: 30.5
Hard Work Score: 71.93
7
Chesapeake, V

Population: 237,940
Mean usual hours worked for workers: 39.20
Percent fully employed: 70.20%
Mean travel time to work (minutes): 25.00
Volunteer Hours Per Resident: 42.3
Hard Work Score: 71.97
6
Salt Lake Cit, UT

Population:193,744
Mean usual hours worked for workers: 37.40
Percent fully employed: 60.40%
Mean travel time to work (minutes): 19.70
Volunteer Hours Per Resident: 62.60
Hard Work Score: 72.50
5
Washington DC

Population: 681,170
Mean usual hours worked for workers: 40.00
Percent fully employed: 67.70%
Mean travel time to work (minutes): 29.70
Volunteer Hours Per Resident: 41.30
Hard Work Score: 72.90
4
New York,NY

Population: 8,537,673
Mean usual hours worked for workers: 39.10
Percent fully employed: 67.10%
Mean travel time to work (minutes): 39.90
Volunteer Hours Per Resident: 35.00
Hard Work Score: 73.40
3
Alexandria, VA

Population: 155,810
Mean usual hours worked for workers: 41.10
Percent fully employed: 76.00%
Mean travel time to work (minutes): 30.80
Volunteer Hours Per Resident: 41.3
Hard Work Score: 76.77
2
Norfolk, VA

Population: 245,115
Mean usual hours worked for workers: 39.70
Percent fully employed: 67.50%
Mean travel time to work (minutes): 42.50
Volunteer Hours Per Resident: 42.3
Hard Work Score: 77.23
1
West Valley City, UT
Population: 136,574
Mean usual hours worked for workers: 38.20
Percent fully employed: 65.30%
Mean travel time to work (minutes): 22.00
Volunteer Hours Per Resident: 80.8
Hard Work Score: 81.50
And now, be sure to check out the 100 Happiest Cities In America.
For more amazing advice for living smarter, looking better, and feeling younger, follow us on Facebook now!