The Busiest Road in Every State

According to a 2017 report by international data company Inrix, the average American spends 41 painful hours (a whole workweek!) in traffic a year. And, in Los Angeles, the world’s most congested city, commuters spend up to 92 hours in traffic jams. With stats like that, it’s no surprise that we’ve come up with exaggerated terms like “Carmageddon” in reference to our roadways. But which of the nation’s roads are responsible for the most exasperating traffic buildups?
To find out, we started with the American Highway Users Alliance’s roundup of the nation’s 50 roadways with the most severe bottlenecks. The list details the cities and exact locations where these nasty bottlenecks occur, as well as the average length of the buildups and the annual total delays they cause. Next, we looked at the Federal Highway Administration’s most recent report to determine each offending highway’s mean annual average daily traffic data, or the average number of vehicles traveling over that section of road each day. Several of the less populated states don’t experience bottlenecks massive enough to be included in the AHUA report (lucky them), so for those states, we’ve reported the interstate with the highest average daily traffic. We’ve also noted the specific city where the road is located, when applicable. (Note: With so many variations in how each city collects traffic data, those popularly crammed local roads, like New York City’s FDR Drive or Boston’s Storrow Drive, didn’t make the cut for this research.)
So take a deep breath—no need to heighten your traffic-induced tension—and make sure you’re nice and relaxed before looking at the jaw-dropping numbers for the most frustratingly congested roads in every state. And for more coverage on the nation’s roadways, don’t miss the 30 Most Dangerous Roads in America.
1
Alabama: I-65
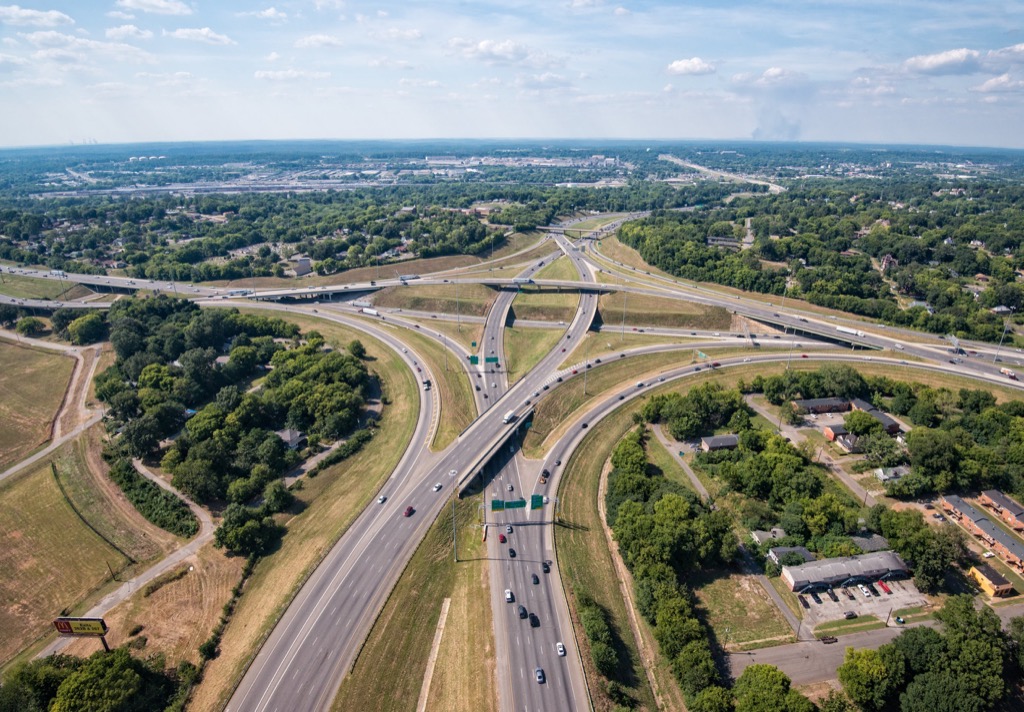
City: Birmingham
Specific Location: Between 6th Ave. N. and University Blvd.
Average Queue Length: 1.1 miles
Annual Total Delay: 190,060 hours
Mean Annual Average Daily Traffic (Urban): 57,929
Mean Annual Average Daily Traffic (Rural): 28,241
And if you’re planning to brave one of these roads this summer, check out The 25 Best Wheels for Summer Road Trips.
2
Alaska: AK-1
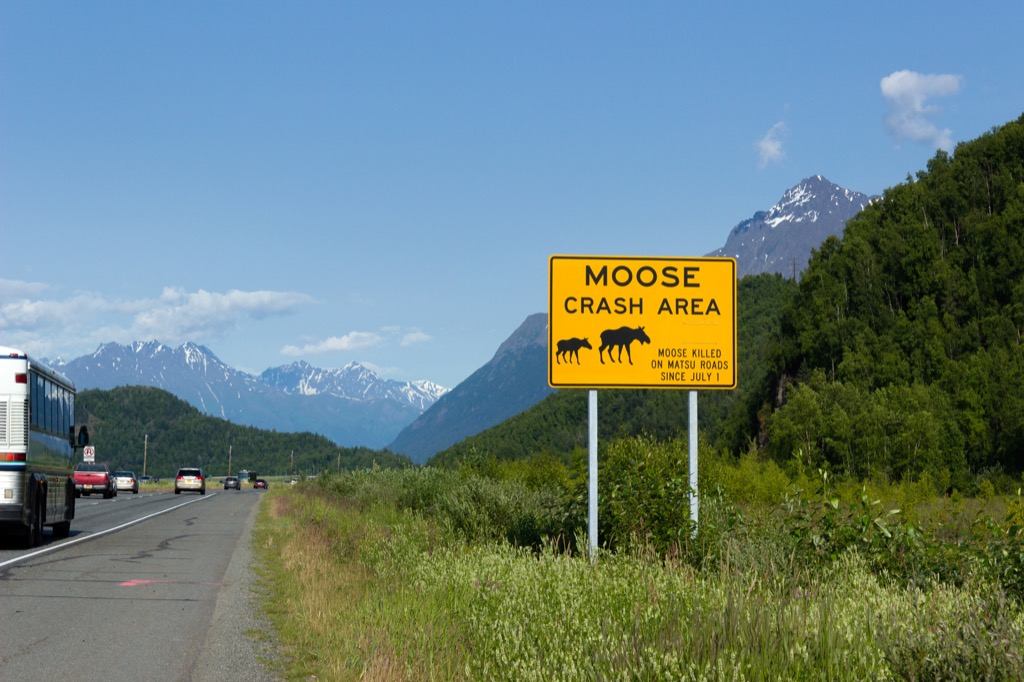
Mean Annual Average Daily Traffic (Urban): 38,341
Mean Annual Average Daily Traffic (Rural): 3,361
And for some tips to help with handling this congestion, learn how to Rule the Road with These Smart Driving Strategies.
3
Arizona: I-10
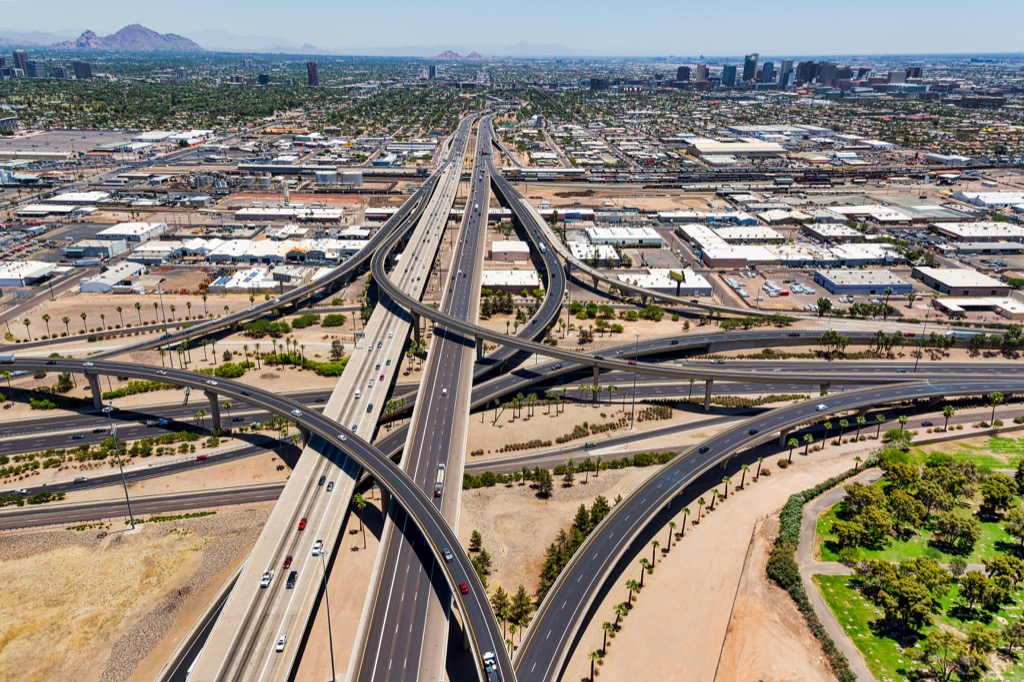
City: Phoenix
Specific Location: Between N. 16th St. and N. 7th Ave.
Average Queue Length: 1.9 miles
Annual Total Delay: 600,080 hours
Mean Annual Average Daily Traffic (Urban): 137,563
Mean Annual Average Daily Traffic (Rural): 27,839
And for more state-related trivia, See the Top Slang Term from Every U.S. State.
4
Arkansas: I-630
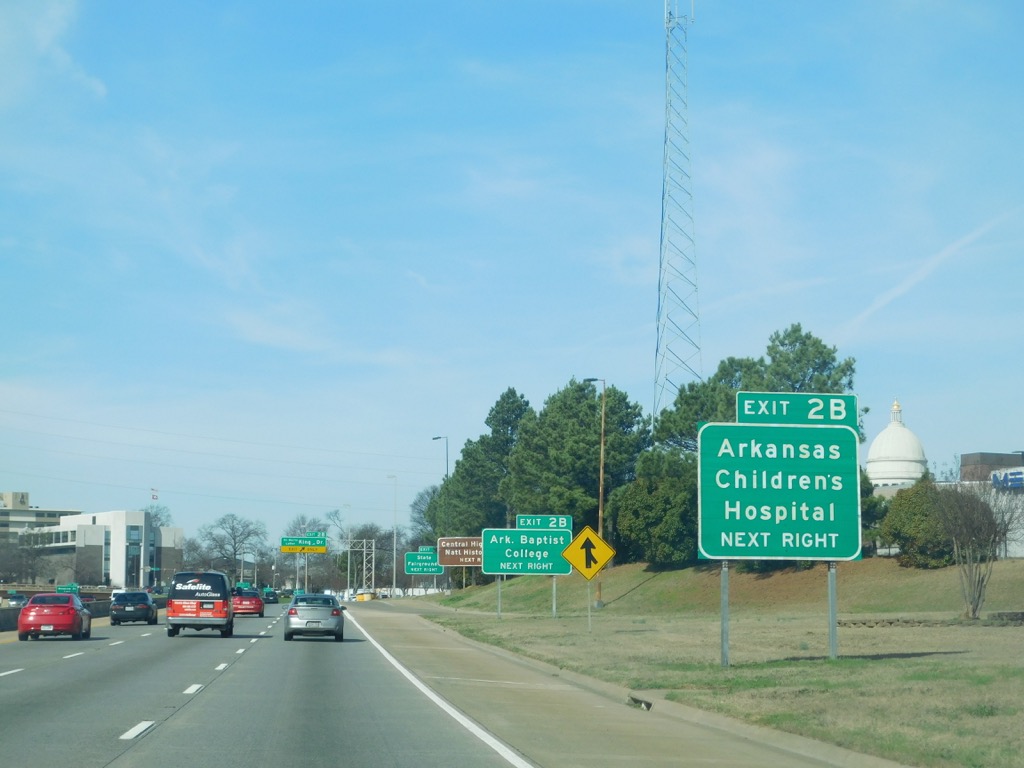
City: Little Rock
Specific Location: Between I-430 and John Barrow Road
Average Queue Length: 1.4 miles
Annual Total Delay: 230,620 hours
Mean Annual Average Daily Traffic (Urban): 102,871
5
California: I-405
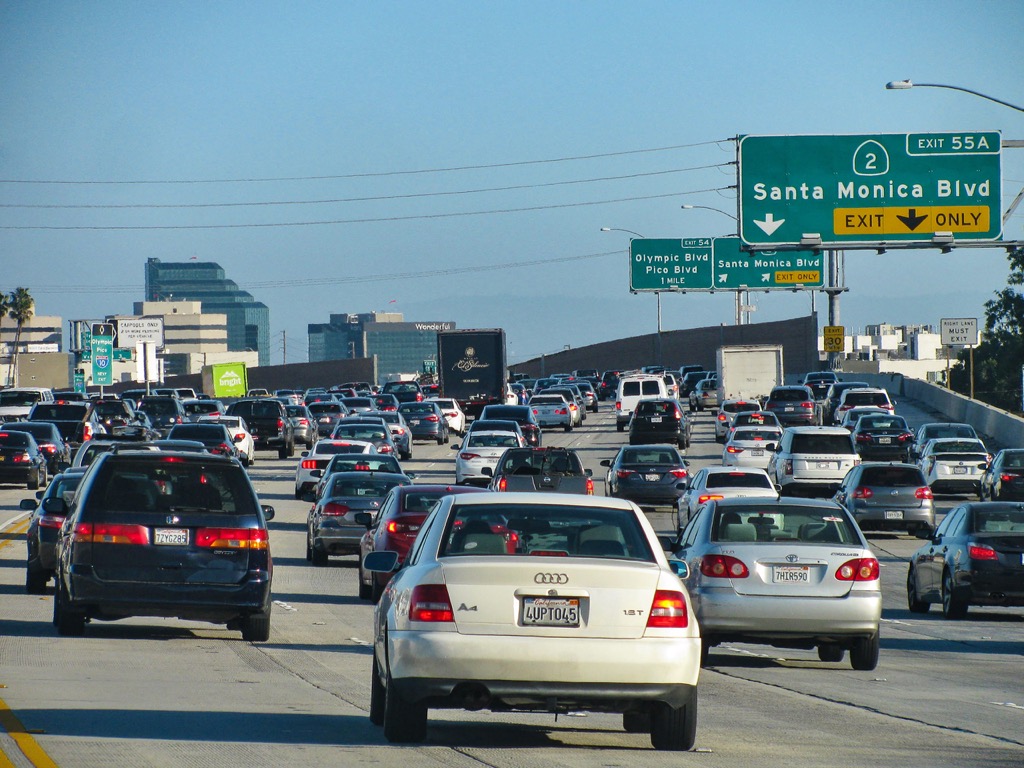
City: Los Angeles
Specific Location: Between CA-22 and I-605
Average Queue Length: 4.1 miles
Annual Total Delay: 7,100,000 hours
Mean Annual Average Daily Traffic (Urban): 273,186
6
Colorado: I-25
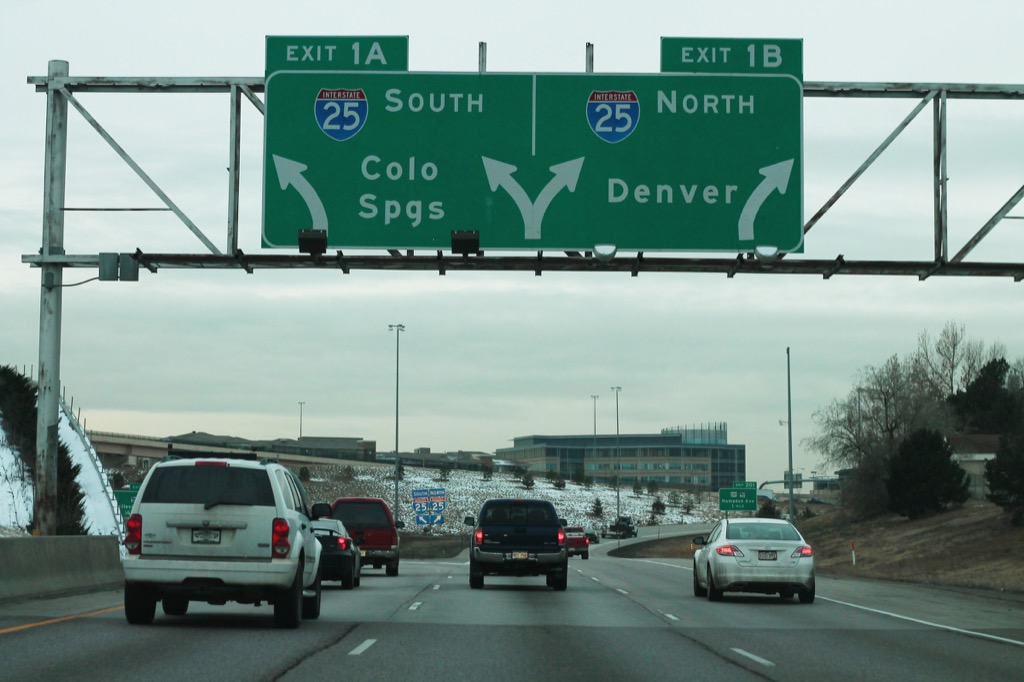
City: Denver
Specific Location: Between Santa Fe Dr. and S. Logan St.
Average Queue Length: 0.8 miles
Annual Total Delay: 700,000 hours
Mean Annual Average Daily Traffic (Urban): 107,545
Mean Annual Average Daily Traffic (Rural): 27,987
7
Connecticut: I-84
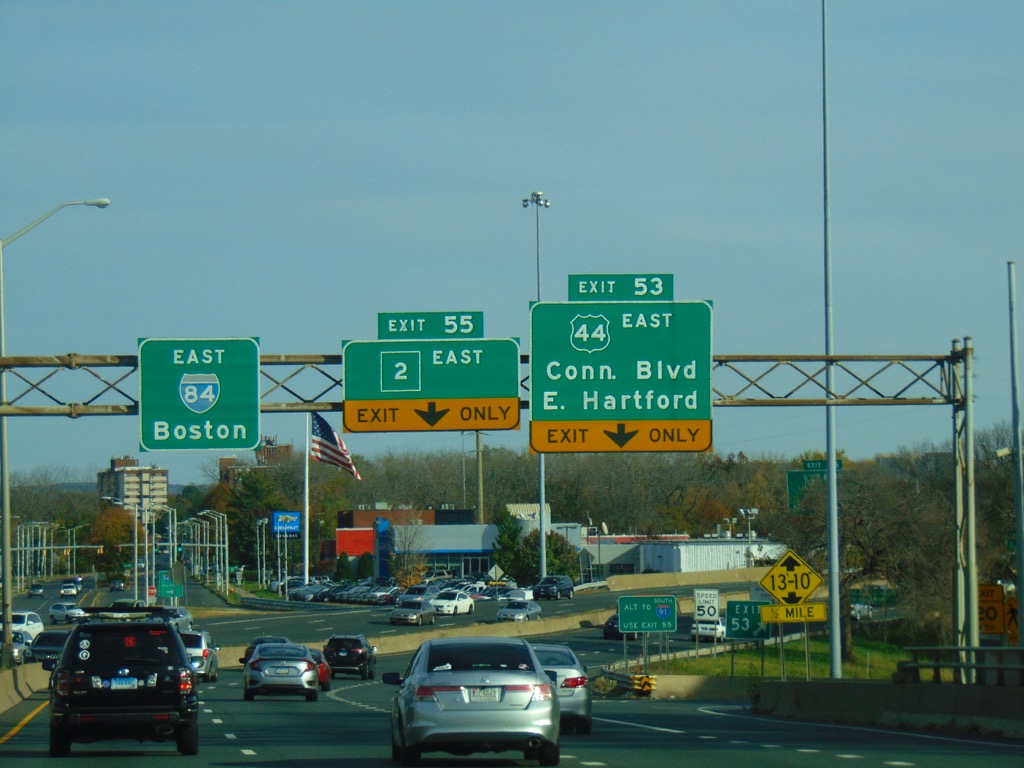
City: Hartford
Specific Location: Between Trumbull St. and Park St.
Average Queue Length: 1.4 miles
Annual Total Delay: 705,900 hours
Mean Annual Average Daily Traffic (Urban): 96,103
Mean Annual Average Daily Traffic (Rural): 54,850
8
Delaware: I-295
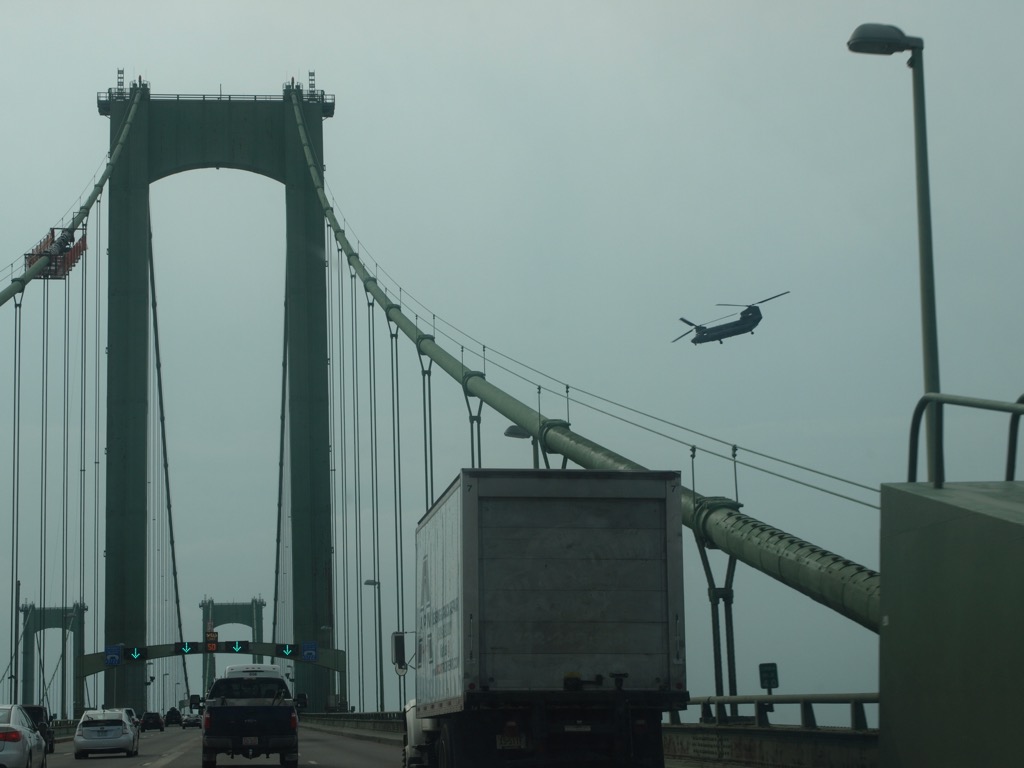
Mean Annual Average Daily Traffic (Urban): 87,215
9
Florida: Palmetto Expressway
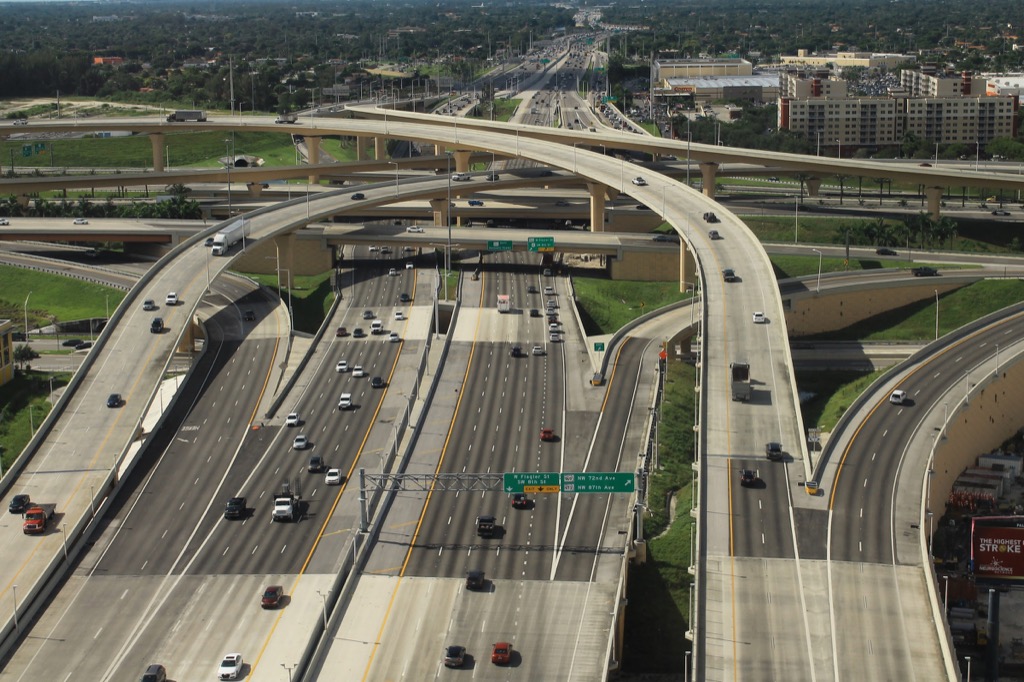
City: Miami
Specific Location: Between 41st St. and Dolphin Expressway
Average Queue Length: 1.7 miles
Annual Total Delay: 1,400,000 hours
Mean Annual Average Daily Traffic (Urban): N/A
10
Georgia: I-75
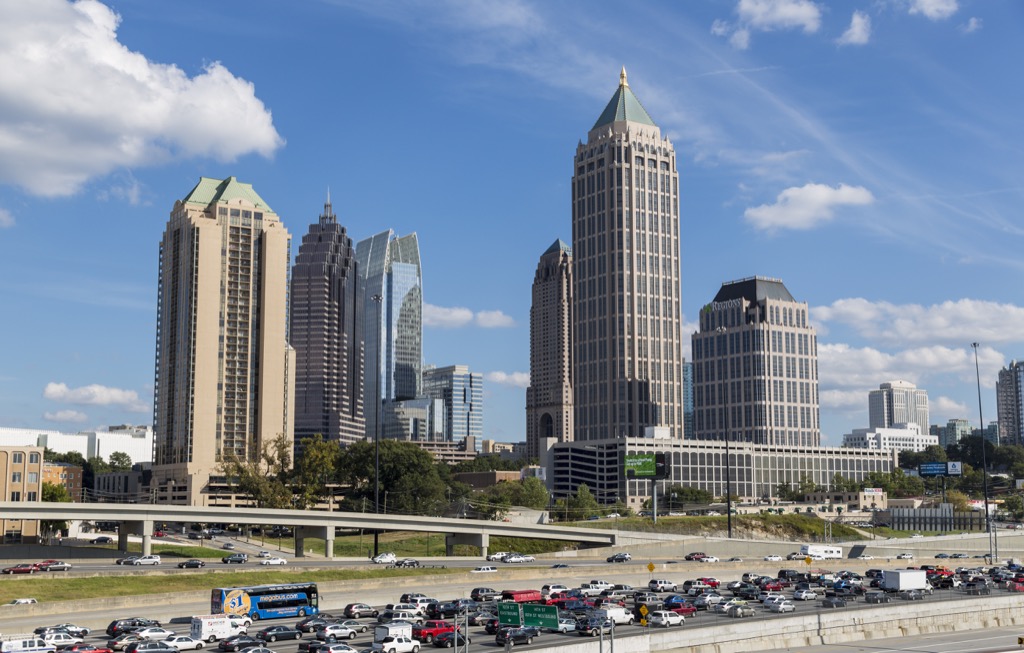
City: Atlanta
Specific Location: Between Freedom Pkwy NE and North Ave. NE
Average Queue Length: 1.3 miles
Annual Total Delay: 1,200,000 hours
Mean Annual Average Daily Traffic (Urban): 119,231
Mean Annual Average Daily Traffic (Rural): 50,938
And if you’re braving one of these roads, keep in mind that This Is the Most Dangerous Day of the Year to Drive.
11
Hawaii: H-1
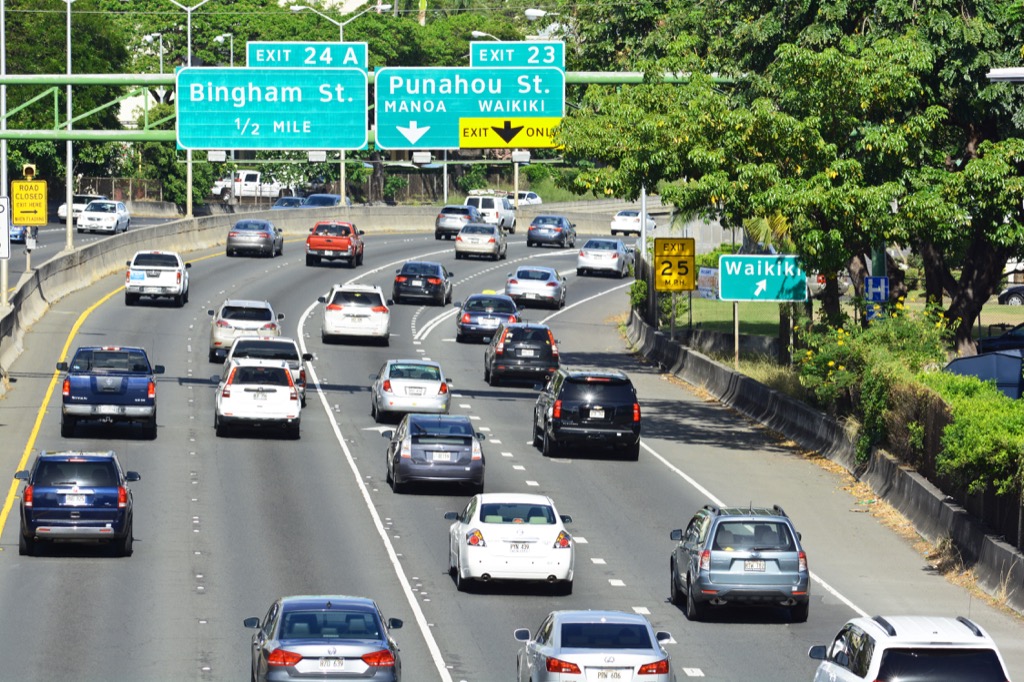
City: Honolulu
Specific Location: Between Ala Kapuna St. and Exit 1D
Average Queue Length: 0.7 miles
Annual Total Delay: 607,100 hours
Mean Annual Average Daily Traffic (Urban): 129,936
12
Idaho: I-84
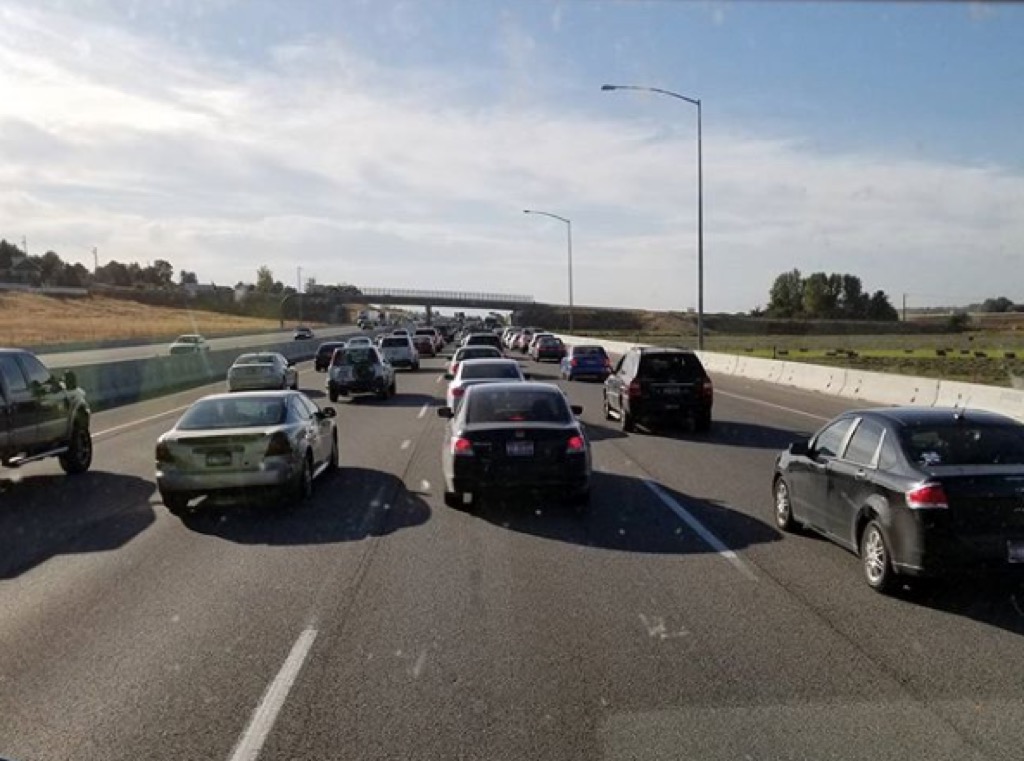
City: Boise
Specific Location: Between S. Meridian Rd. and ID-55
Average Queue Length: 1.8 miles
Annual Total Delay: 119,080 hours
Mean Annual Average Daily Traffic (Urban): 49,372
Mean Annual Average Daily Traffic (Rural): 14,173
Photo via Instagram
13
Illinois: I-90
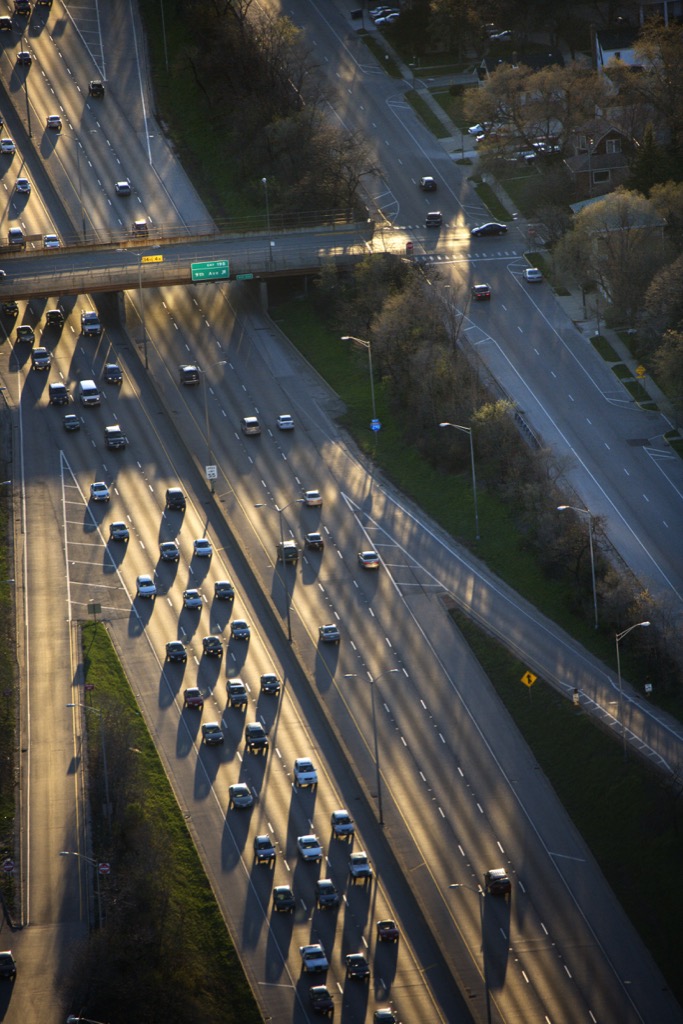
City: Chicago
Specific Location: Between Roosevelt Rd. and N. Nagle Ave.
Average Queue Length: 12 miles
Annual Total Delay: 16,900,000 hours
Mean Annual Average Daily Traffic (Urban): 202,907
Mean Annual Average Daily Traffic (Rural): 45,902
14
Indiana: I-65
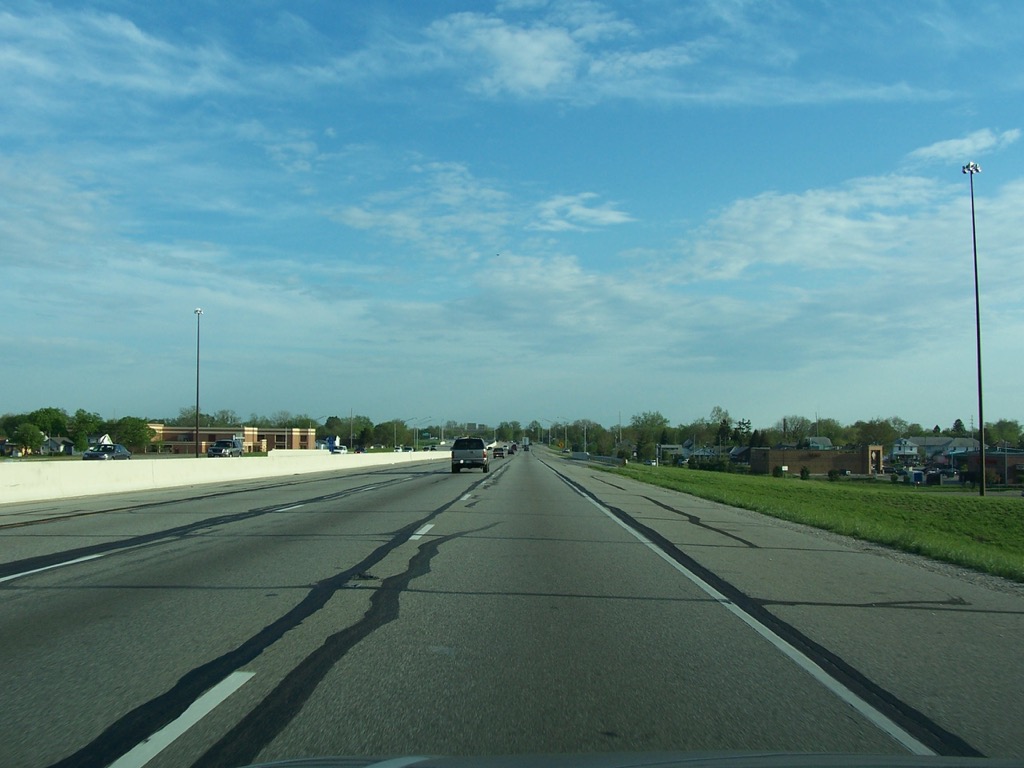
City: Indianapolis
Specific Location: Between W. 21st St. and Central Ave.
Average Queue Length: 1.7 miles
Annual Total Delay: 400,400 hours
Mean Annual Average Daily Traffic (Urban): 60,734
Mean Annual Average Daily Traffic (Rural): 38,875
15
Iowa: I-29
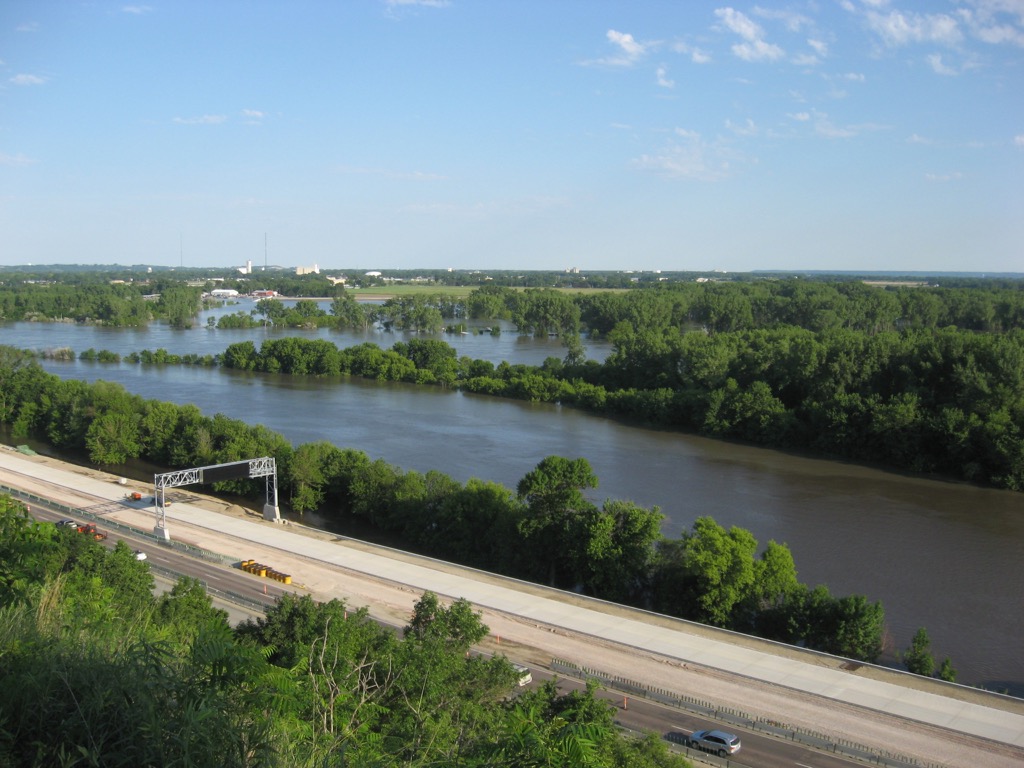
City: Council Bluffs
Specific Location: Between Plaza View Dr. and S. Expressway St.
Average Queue Length: 2.3 miles
Annual Total Delay: 117,520 hours
Interstate Mean Annual Average Daily Traffic (Urban): 33,698
Interstate Mean Annual Average Daily Traffic (Rural): 14,667
16
Kansas: US-400
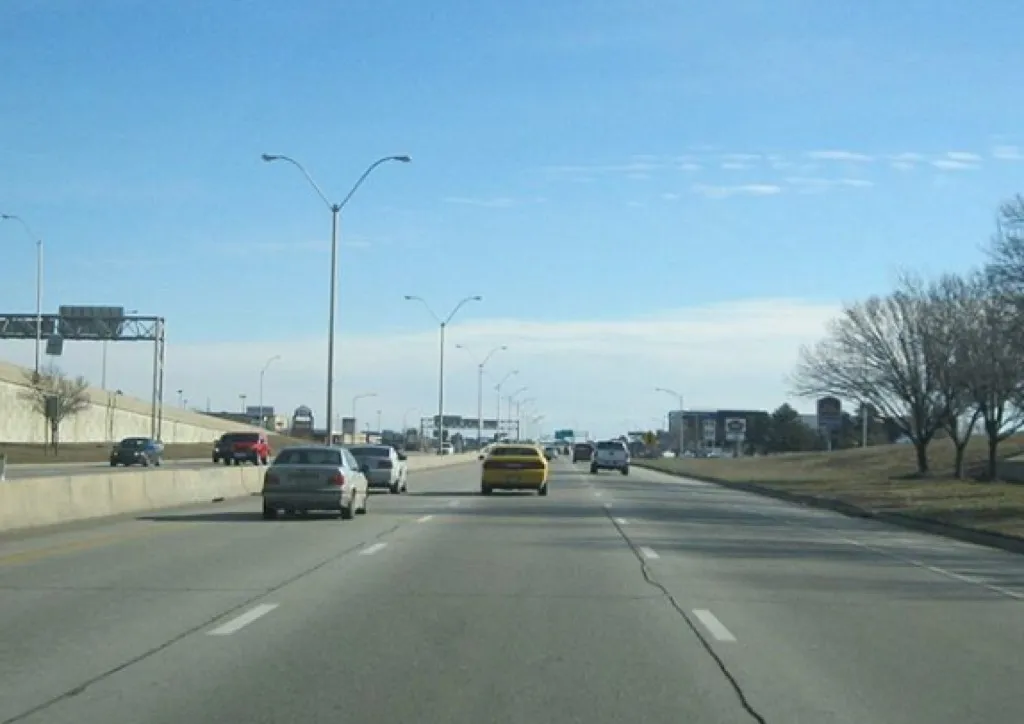
City: Wichita
Specific Location: Between Rock Rd. and I-35 (Kansas Turnpike)
Average Queue Length: 2.6 miles
Annual Total Delay: 375,180 hours
Mean Annual Average Daily Traffic (Urban): N/A
Photo via Instagram
17
Kentucky: I-65
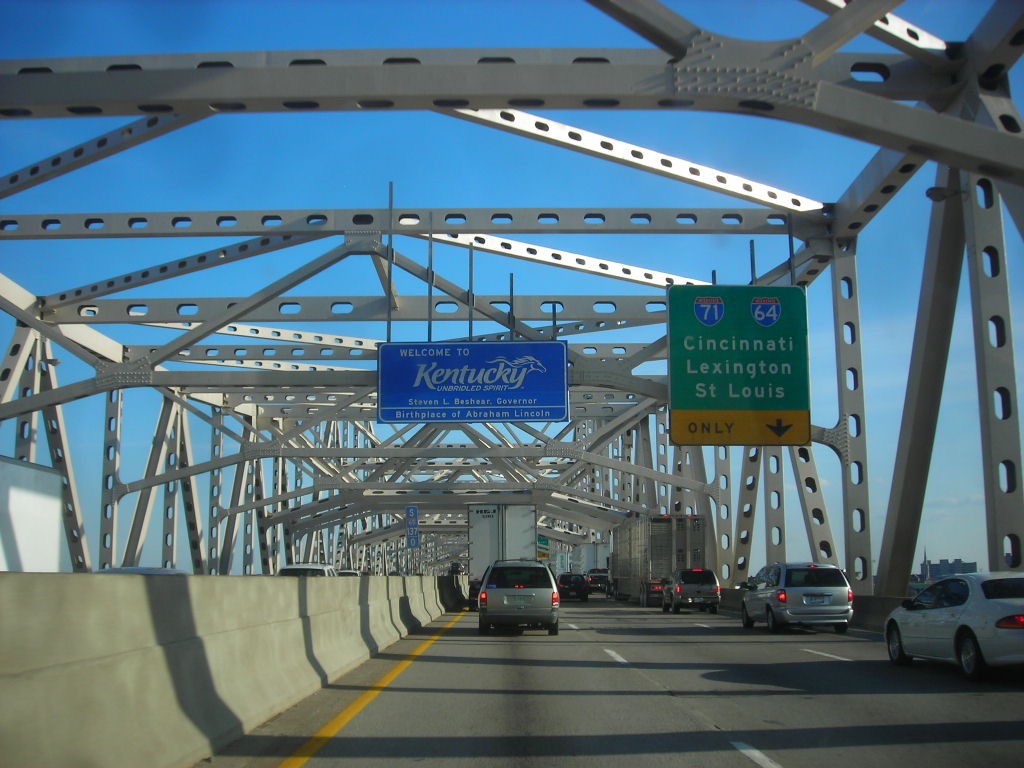
City: Louisville
Specific Location: At US-150
Average Queue Length: 1 mile
Annual Total Delay: 241,540 hours
Mean Annual Average Daily Traffic (Urban): 100,143
Mean Annual Average Daily Traffic (Rural): 43,974
18
Louisiana: US-90
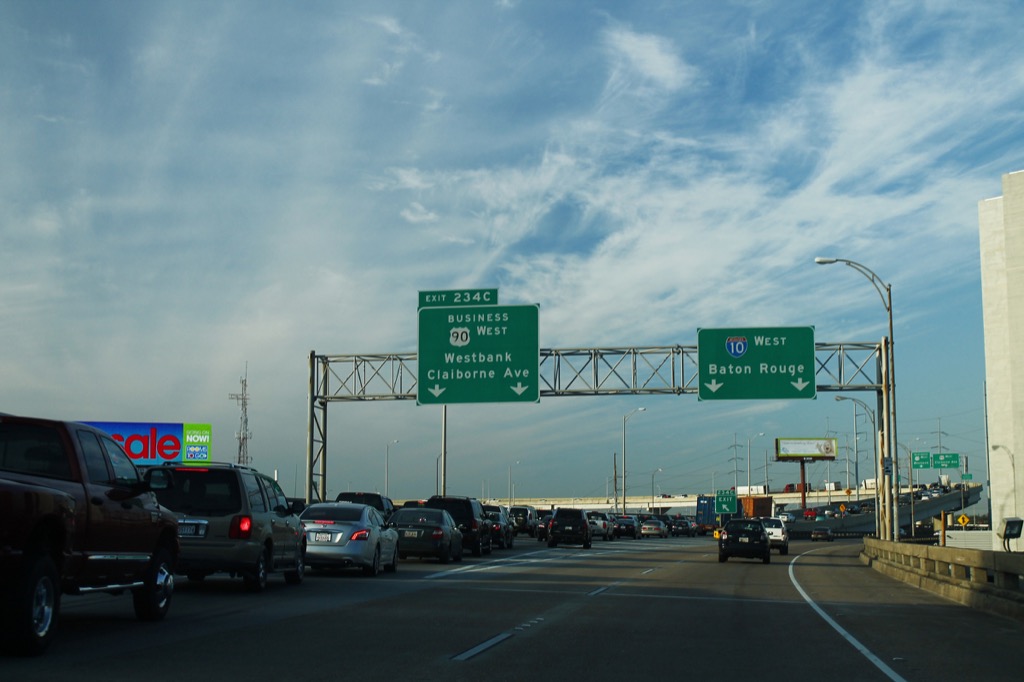
City: New Orleans
Specific Location: Between Loyola Ave. and Convention Center Blvd.
Average Queue Length: 0.9 miles
Annual Total Delay: 741,780 hours
Mean Annual Average Daily Traffic (Urban): N/A
19
Maine: I-295
Mean Annual Average Daily Traffic (Urban): 43,307
Mean Annual Average Daily Traffic (Rural): 31,029
20
Maryland: I-495
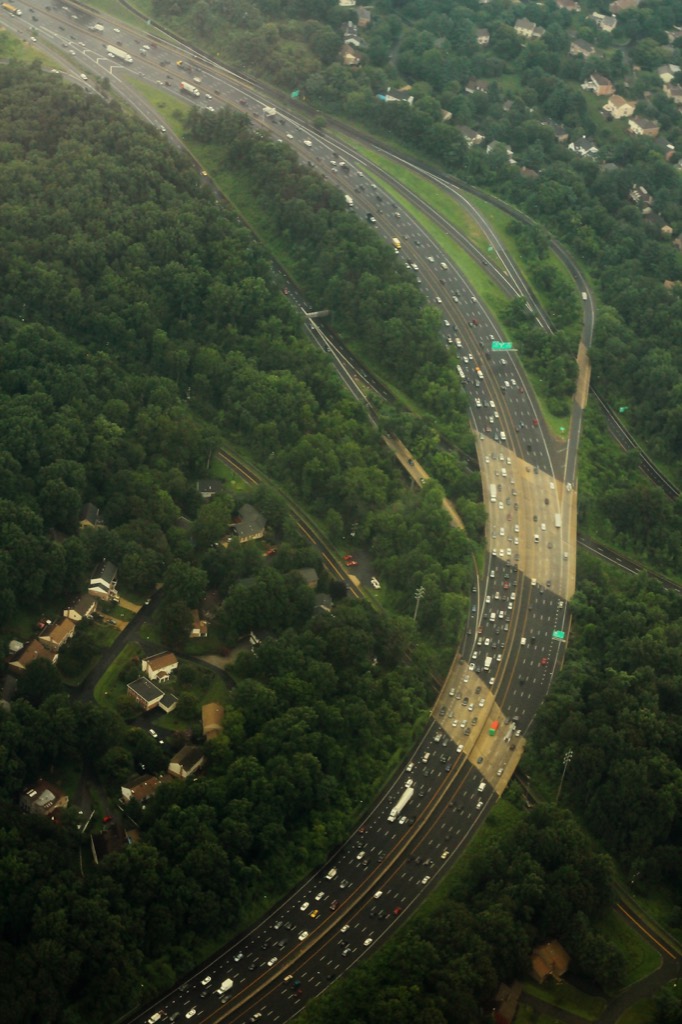
City: Bethesda
Specific Location: Between MD-190 and I-270
Average Queue Length: 1.9 miles
Annual Total Delay: 705,120 hours
Mean Annual Average Daily Traffic (Urban): 203,808
And speaking of congestion, Here’s How Many Hours You’ll Spend Stuck in Traffic During Your Life.
21
Massachusetts: I-93
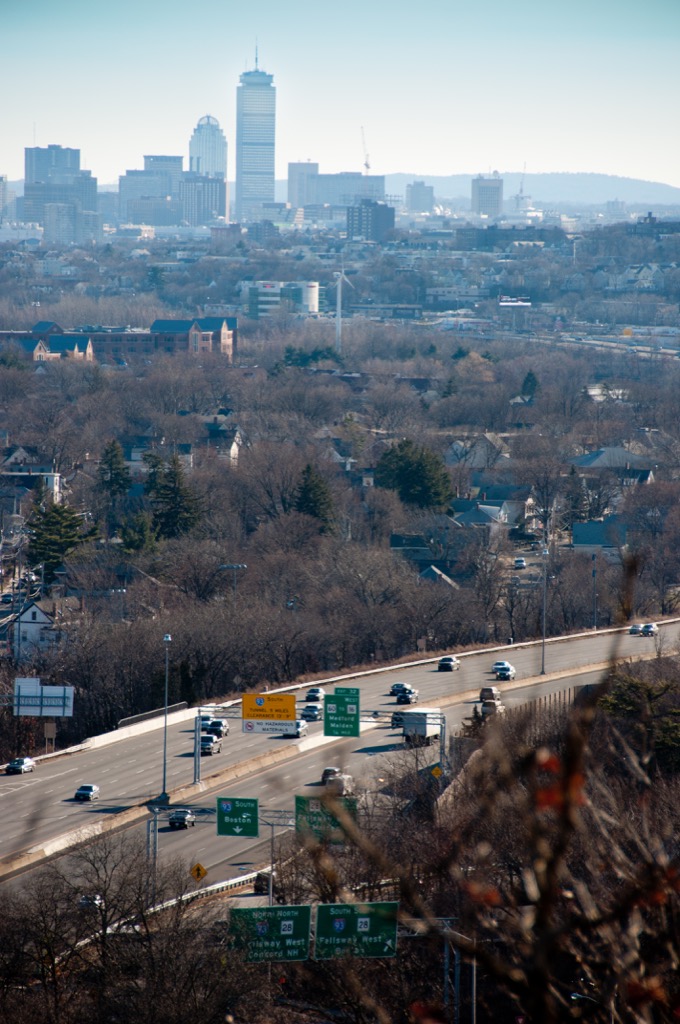
City: Boston
Specific Location: Between I-90 and US-1
Average Queue Length: 1.9 miles
Annual Total Delay: 2,100,000 hours
Mean Annual Average Daily Traffic (Urban): 153,555
22
Michigan: I-75
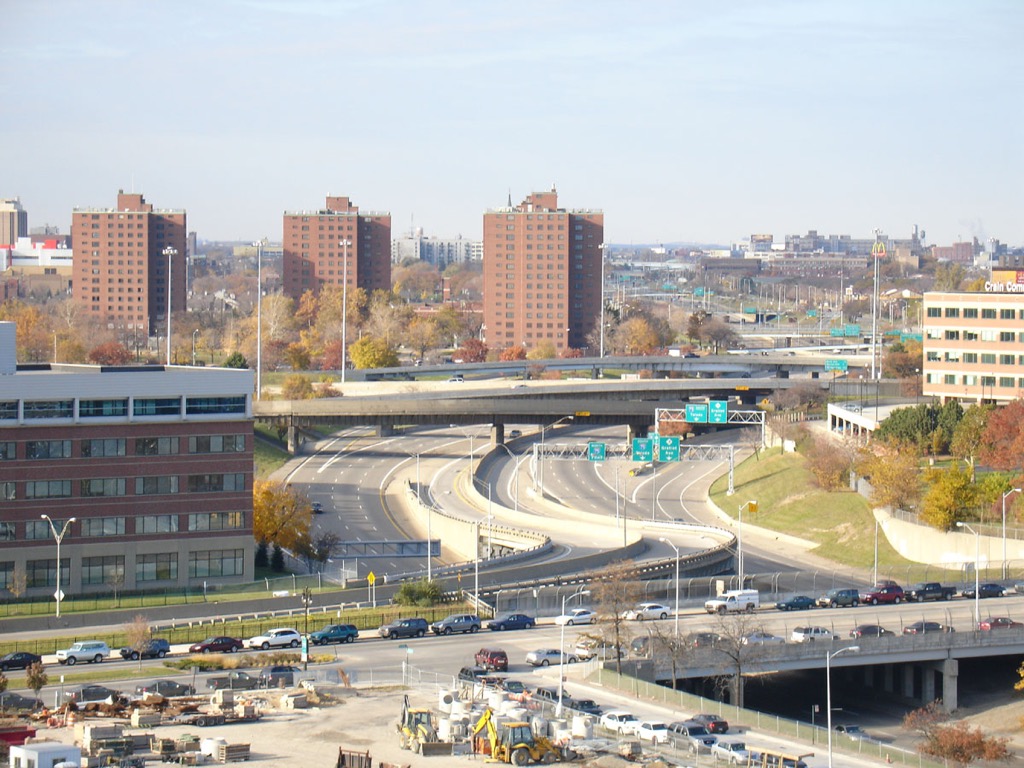
City: Detroit
Specific Location: North of I-696, between W. Lincoln St. and Twelve Mile Rd.
Average Queue Length: 1.2 miles
Annual Total Delay: 569,920 hours
Mean Annual Average Daily Traffic (Urban): 73,080
Mean Annual Average Daily Traffic (Rural): 17,012
23
Minnesota: I-94
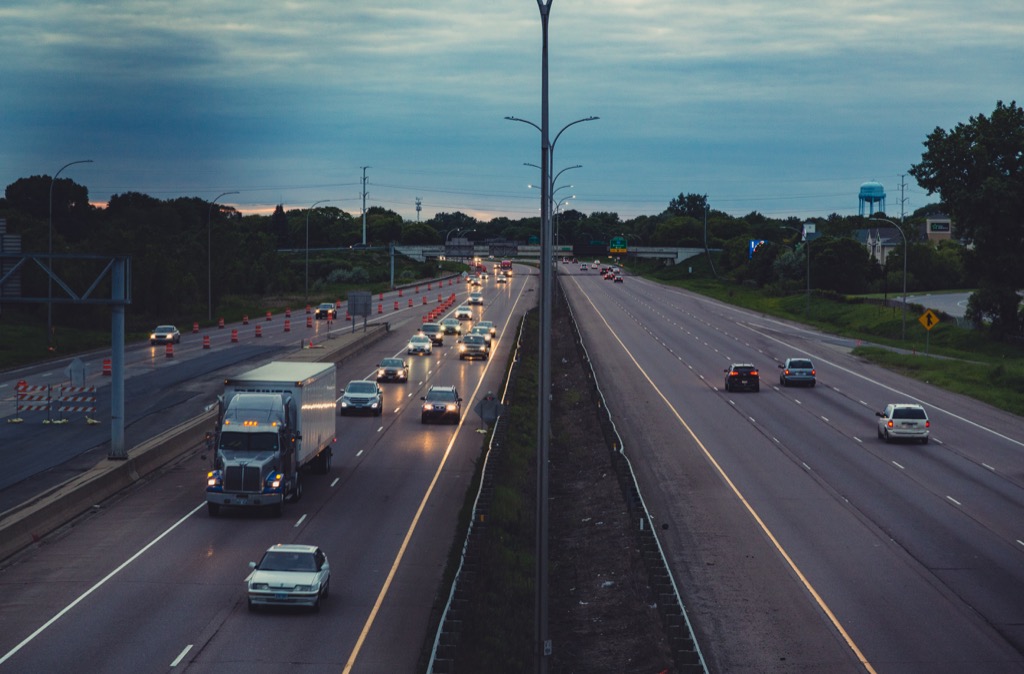
City: Minneapolis
Specific Location: Between W. River Pkwy and 22nd Ave. S.
Average Queue Length: 0.7 miles
Annual Total Delay: 362,960 hours
Mean Annual Average Daily Traffic (Urban): 101,562
Mean Annual Average Daily Traffic (Rural): 24,712
24
Mississippi: I-55
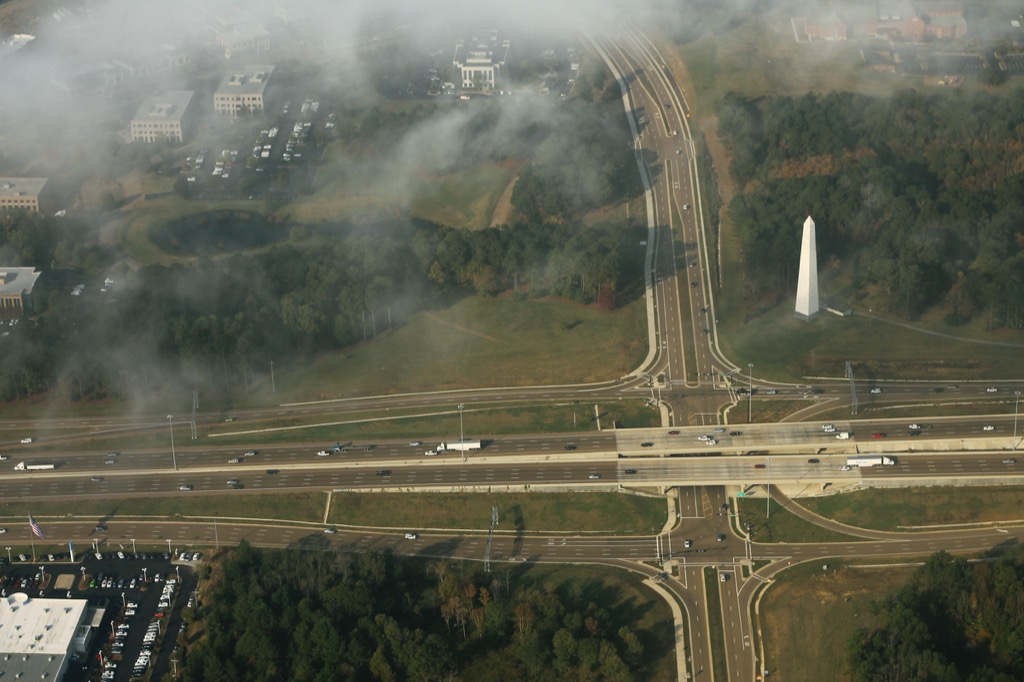
City: Jackson
Specific Location: Between Savanna St. and I-20
Average Queue Length: 2 miles
Annual Total Delay: 145,860 hours
Mean Annual Average Daily Traffic (Urban): 63,950
Mean Annual Average Daily Traffic (Rural): 18,390
25
Missouri: I-44
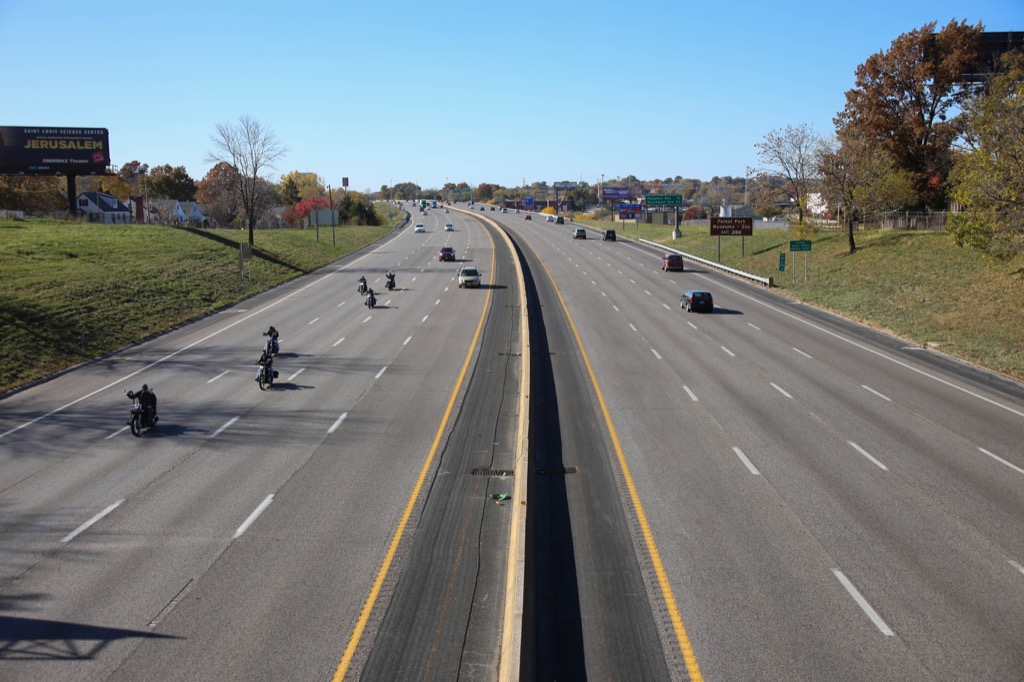
City: St. Louis
Specific Location: Beween Eads Bridge and I-70
Average Queue Length: 1.1 miles
Annual Total Delay: 417,560 hours
Mean Annual Average Daily Traffic (Urban): 65,212
Mean Annual Average Daily Traffic (Rural): 28,444
26
Montana: I-315
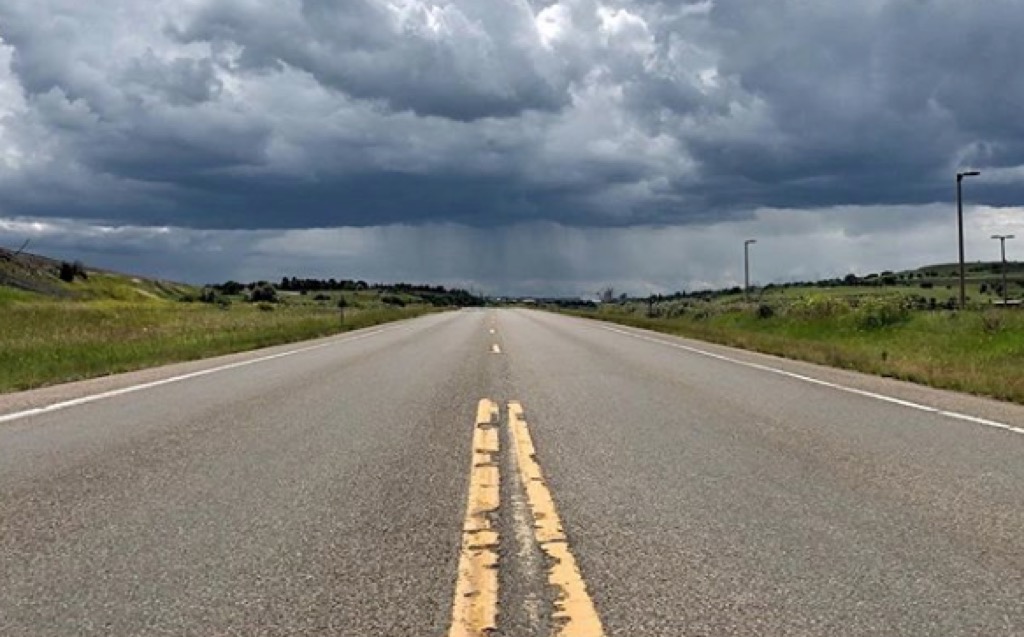
City: Great Falls
Mean Annual Average Daily Traffic (Urban): 21,687
Photo via Instagram
27
Nebraska: US-6
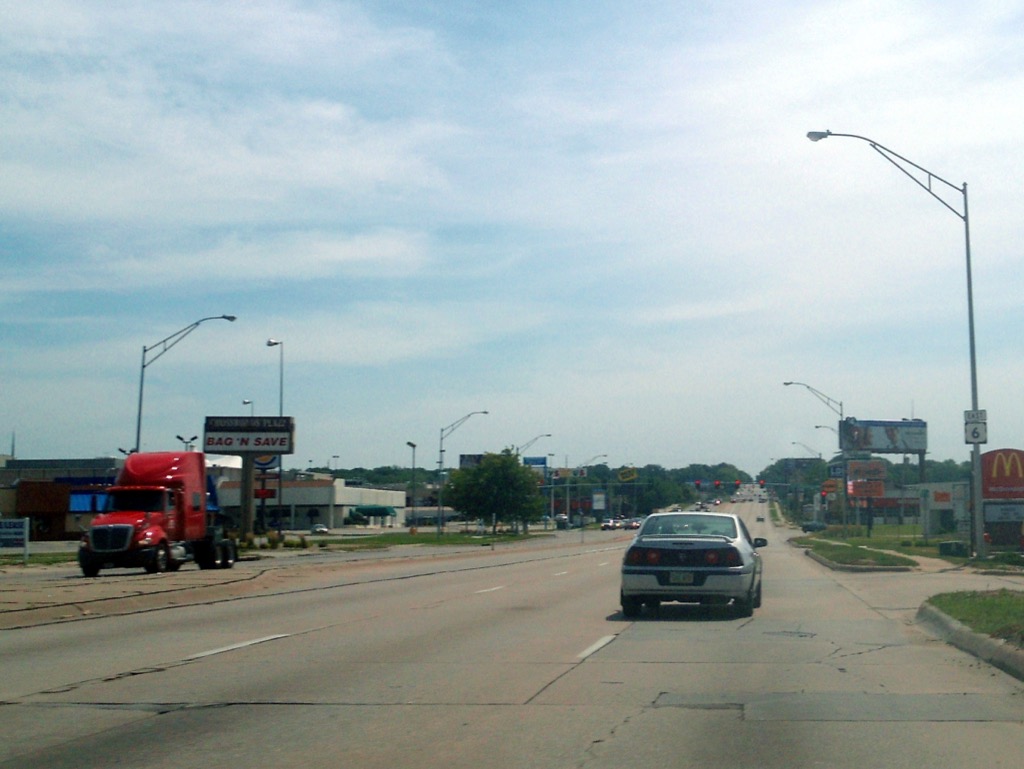
City: Omaha
Specific Location:Between N. 120th St. and S. 108th St (East of I-680)
Average Queue Length: 1 mile
Annual Total Delay: 160,420 hours
Mean Annual Average Daily Traffic (Urban): N/A
28
Nevada: I-15
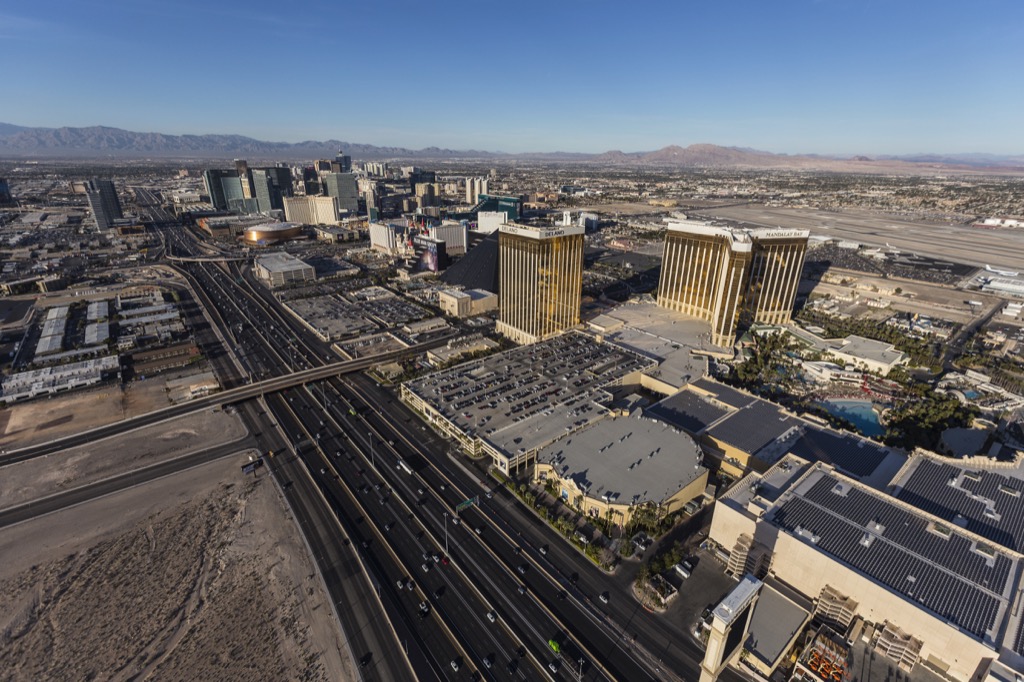
City: Las Vegas
Specific Location: Between W. Oakey Blvd. and Exit 41 (Near Las Vegas North Premium Outlets)
Average Queue Length: 0.9 miles
Annual Total Delay: 258,180 hours
Mean Annual Average Daily Traffic (Urban): 138,934
Mean Annual Average Daily Traffic (Rural): 23,723
29
New Hampshire: NH-125
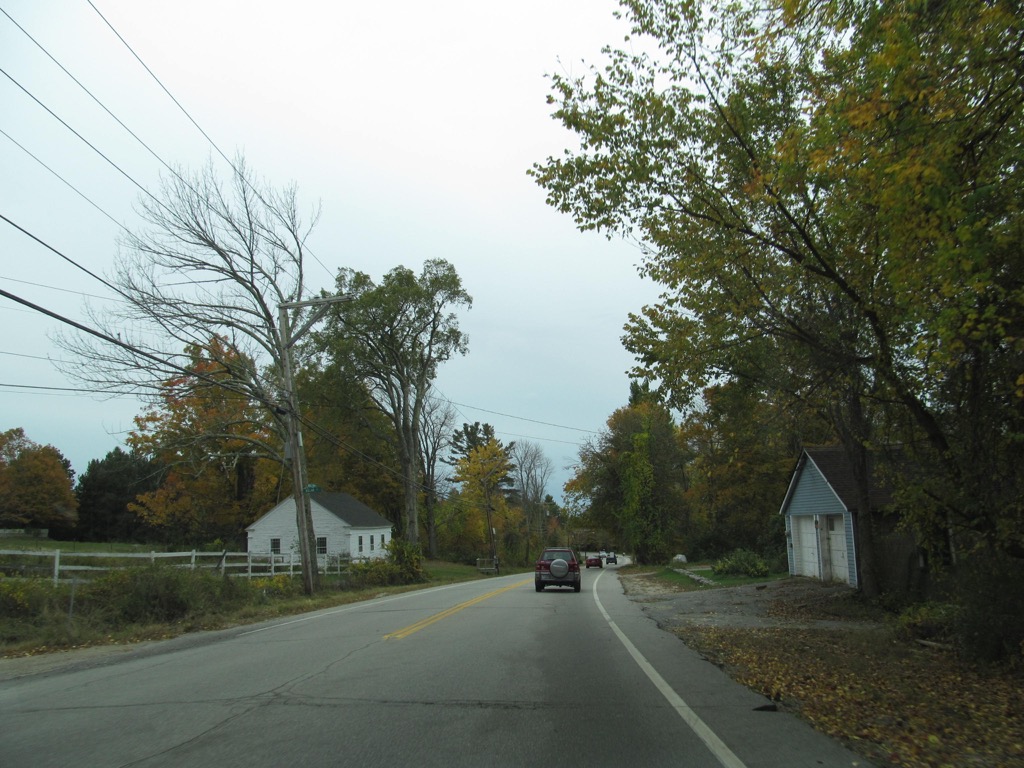
City: Epping
Specific Location: Between NH-101 and Water St.
Average Queue Length: 1 mile
Annual Total Delay: 159,120 hours
Mean Annual Average Daily Traffic (Urban): N/A
30
New Jersey: Lincoln Tunnel
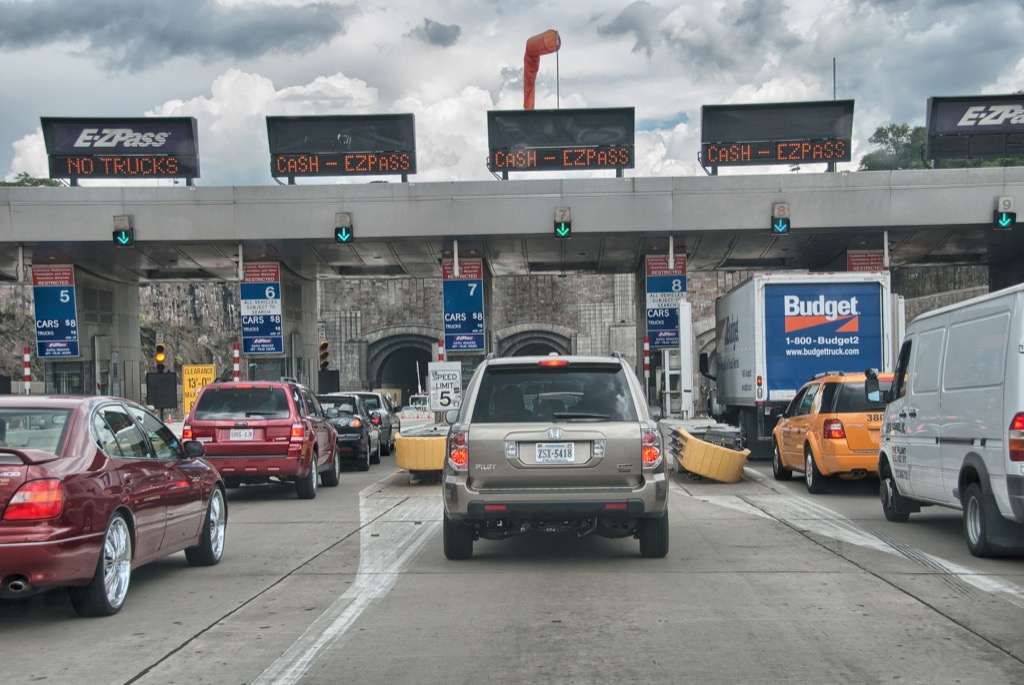
City: Weehawken (and Manhattan, NY)
Specific Location: Between 10th Ave. and John F. Kennedy Blvd.
Average Queue Length: 2.6 miles
Annual Total Delay: 3,400,000 hours
Mean Annual Average Daily Traffic (Urban): N/A
And for rides that are bound to induce more thrills than these roads, check out The Craziest Amusement Park Ride in Every State.
31
New Mexico: I-25
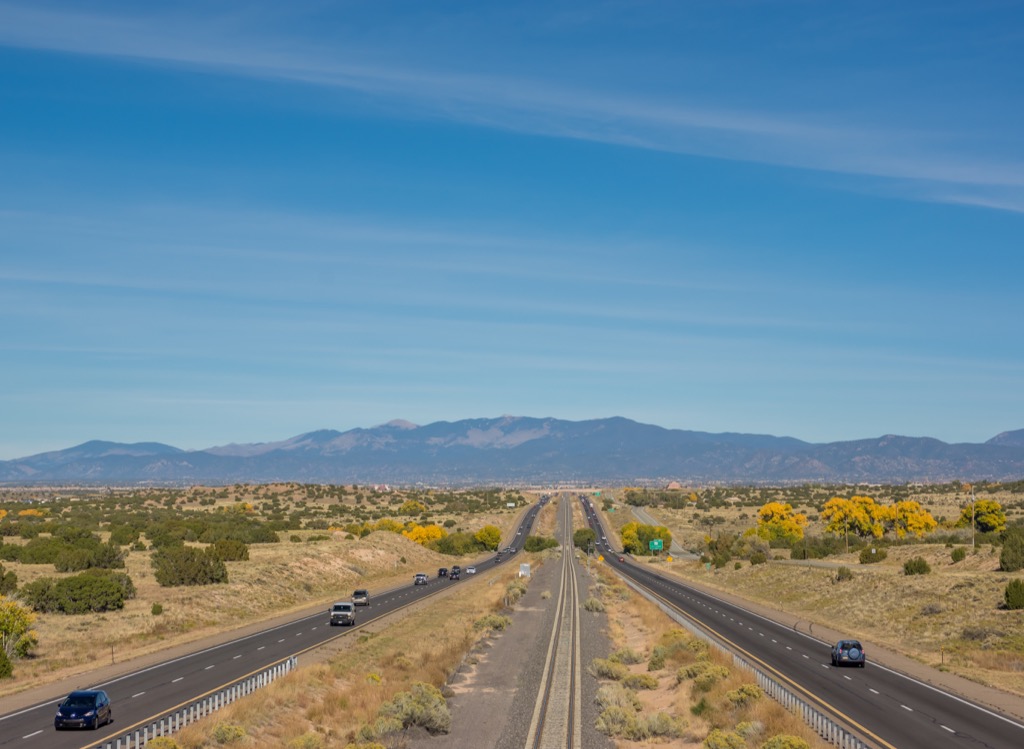
City: Albuquerque
Specific Location: Between Osuna Rd. NE and NM-423
Average Queue Length: 2.5 miles
Annual Total Delay: 666,380 hours
Mean Annual Average Daily Traffic (Urban): 58,175
Mean Annual Average Daily Traffic (Rural): 10,331
32
New York: I-95
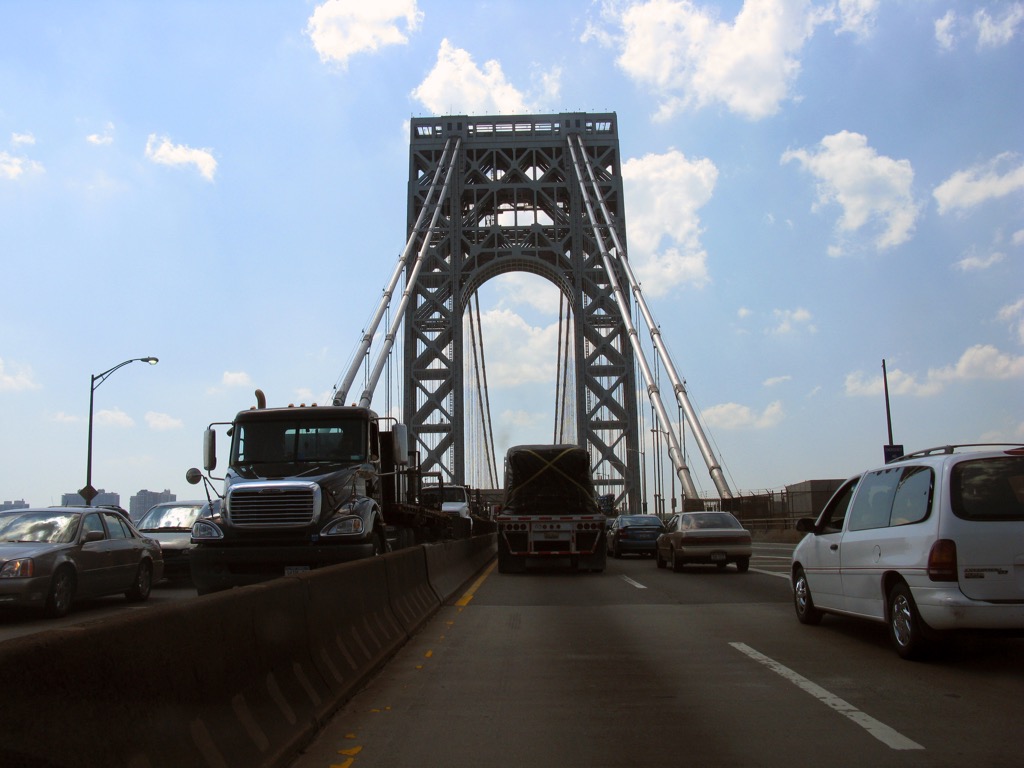
City: New York City
Specific Location: Manhattan, between I-895 and Broadway
Average Queue Length: 3.1 miles
Annual Total Delay: 3,000,000 hours
Mean Annual Average Daily Traffic (Urban): 116,620
And if you find yourself driving down one of these roads, be sure to check out the 20 Ways to Make Travel Less Stressful.
33
North Carolina: I-485
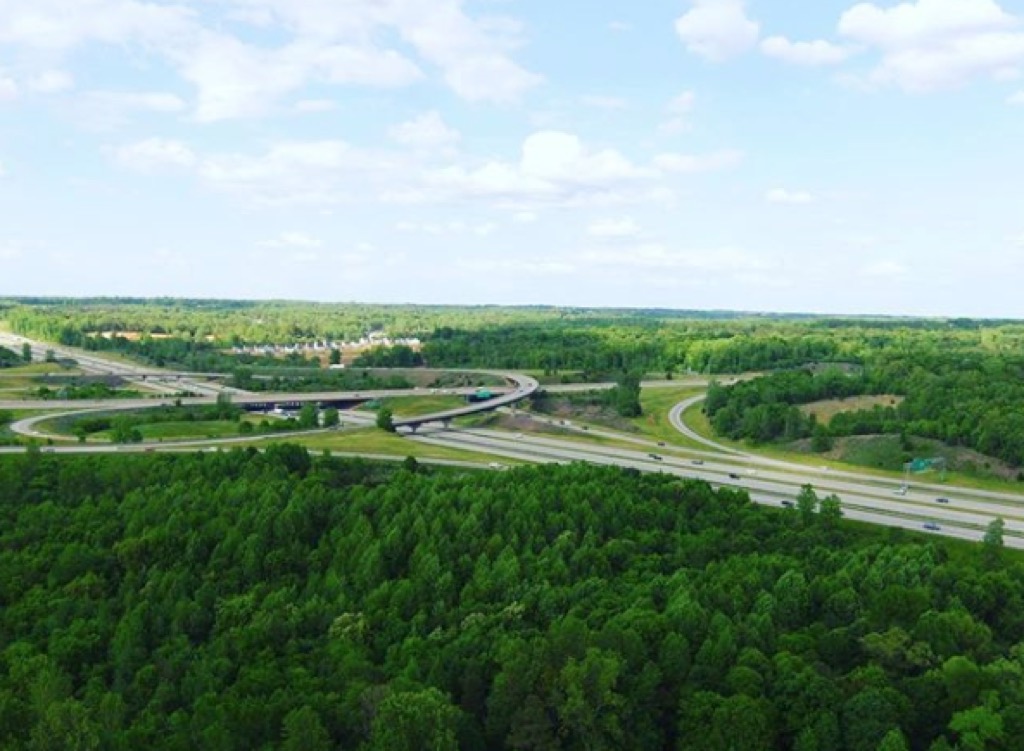
City: Charlotte
Specific Location: Between Exit 65 and 65B (Crossing South Blvd.)
Average Queue Length: 0.5 miles
Annual Total Delay: 96,819 hours
Mean Annual Average Daily Traffic (Urban): 62,020
Photo via Instagram
34
North Dakota: I-29
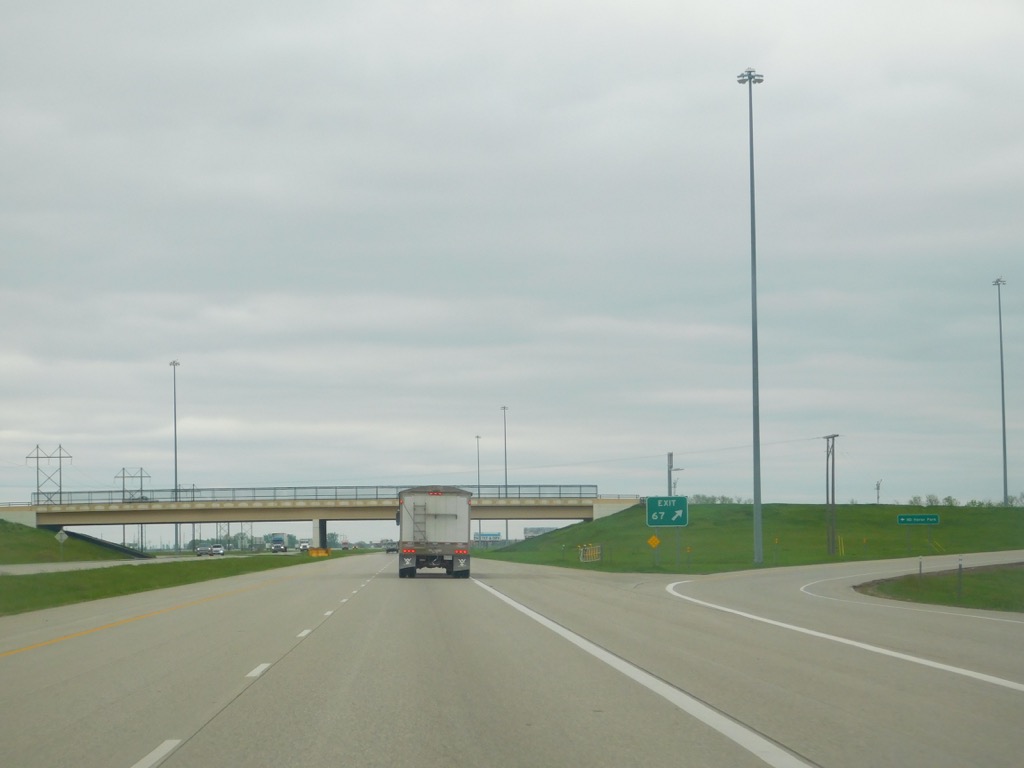
Mean Annual Average Daily Traffic (Urban): 28,133
Mean Annual Average Daily Traffic (Rural): 8,640
35
Ohio: I-75
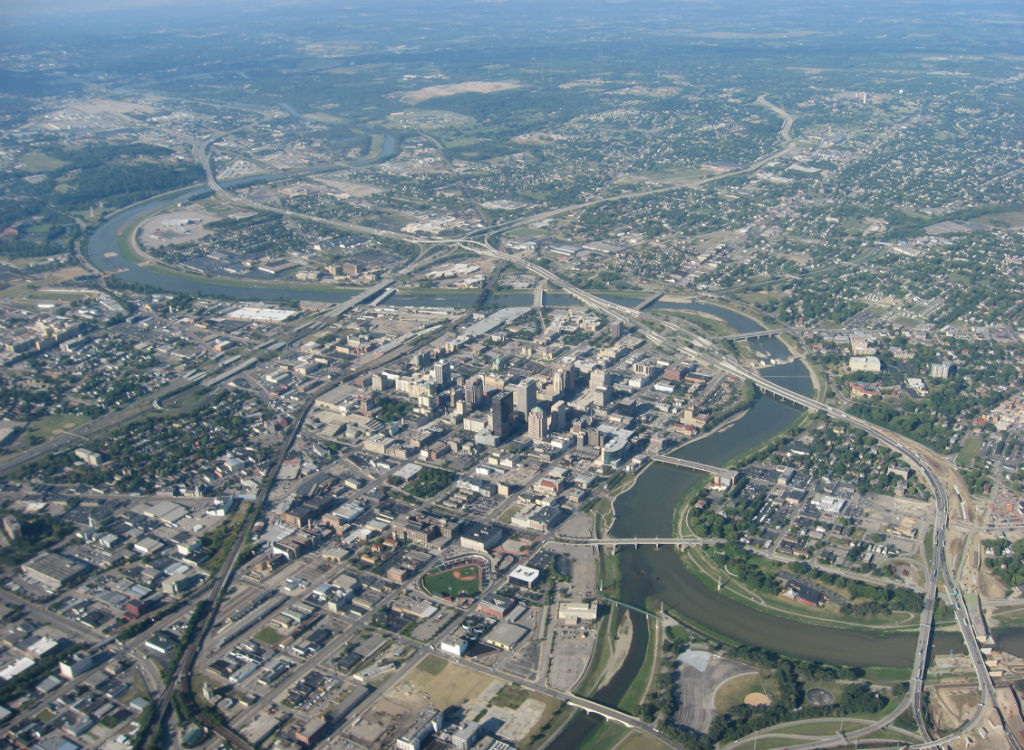
City: Cincinnati
Specific Location: Between Bank St. and Ohio/Kentucky Border
Average Queue Length: 2.6 miles
Annual Total Delay: 433,160 hours
Mean Annual Average Daily Traffic (Urban): 84,052
Mean Annual Average Daily Traffic (Rural): 39,122
And for more state-related trivia, here’s The Weirdest Summer Tradition in Every State.
36
Oklahoma: I-235
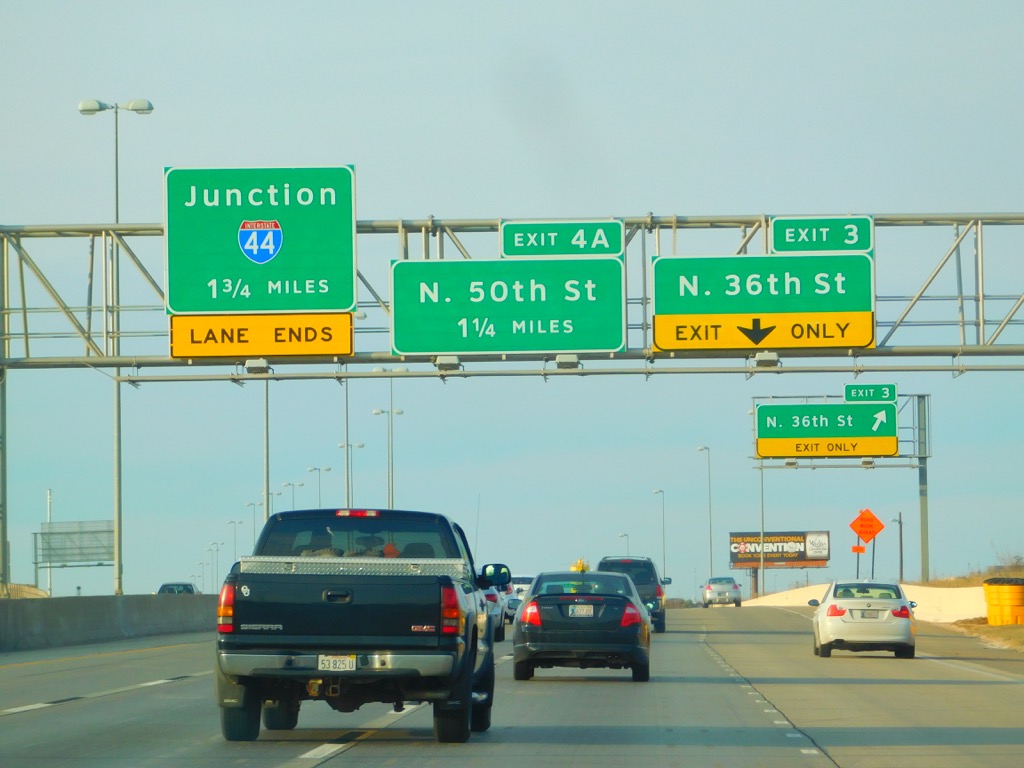
City: Oklahoma City
Specific Location: At I4-4 between NW 59th St. and NW 50th St.
Average Queue Length: 0.7 miles
Annual Total Delay: 99,840 hours
Mean Annual Average Daily Traffic (Urban): 84,890
37
Oregon: I-205
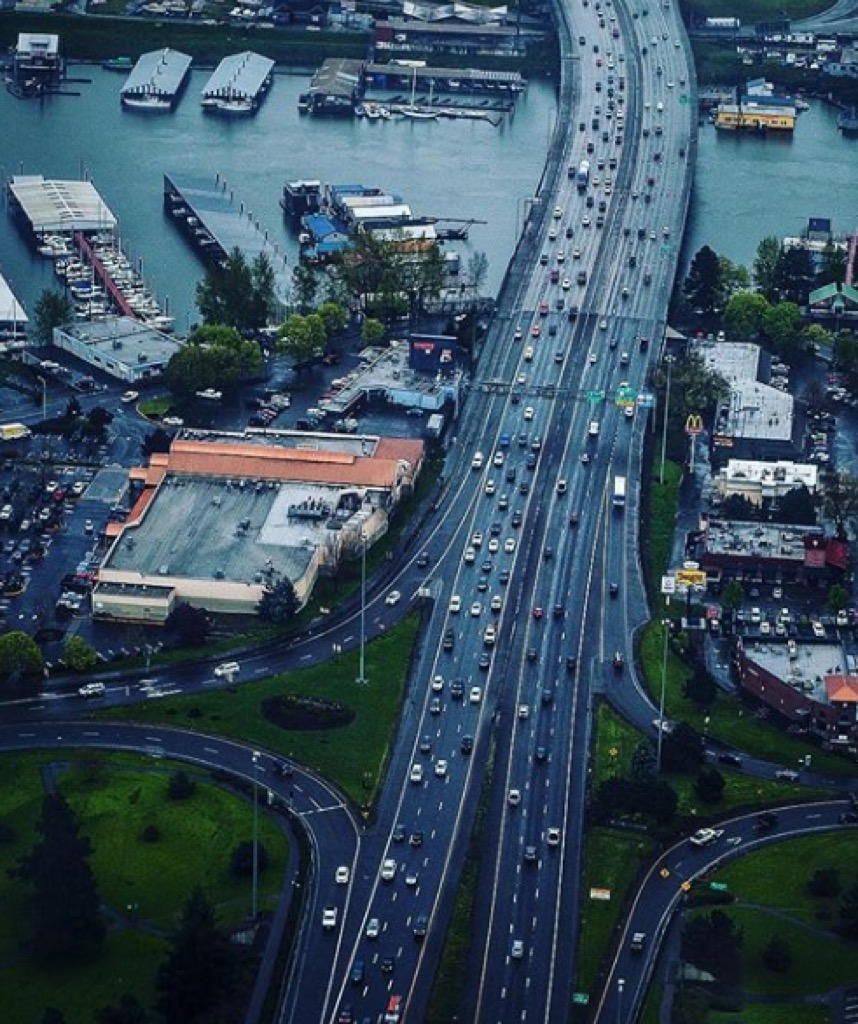
City: Portland
Mean Annual Average Daily Traffic (Urban): 126,836
Mean Annual Average Daily Traffic (Rural): 80,067
Photo via Instagram
38
Pennsylvania: I-76
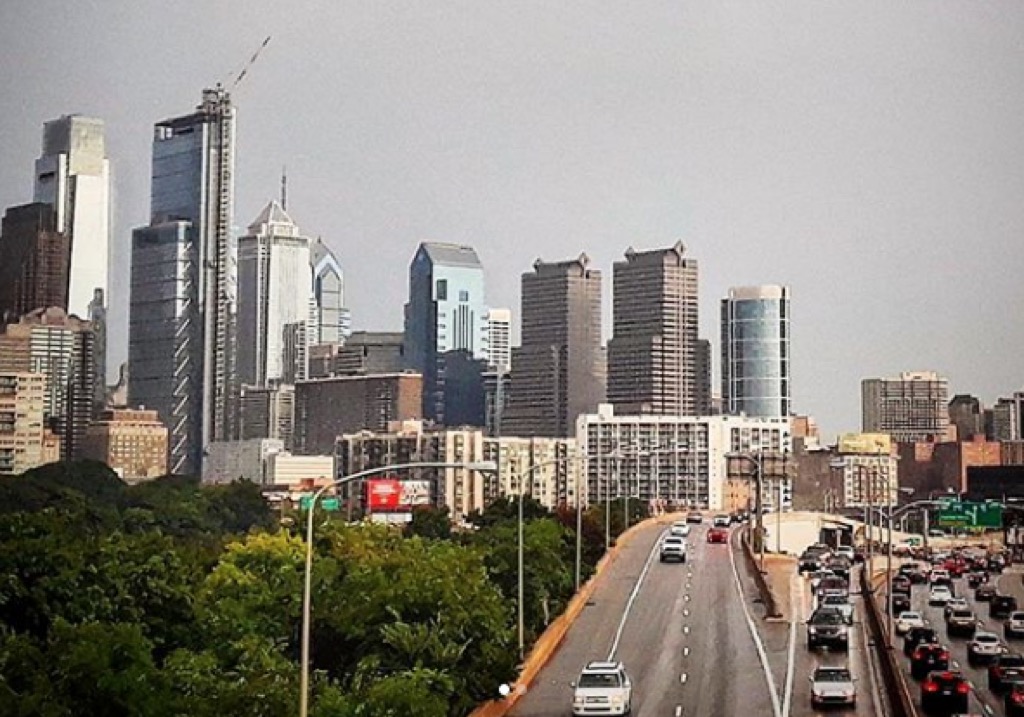
City: Philadelphia
Specific Location: At US-1, between City Ave. and Roosevelt Blvd.
Average Queue Length: 0.8 miles
Annual Total Delay: 700,000 hours
Mean Annual Average Daily Traffic (Urban): 49,005
Mean Annual Average Daily Traffic (Rural): 26,106
Photo via Instagram
39
Rhode Island: I-95
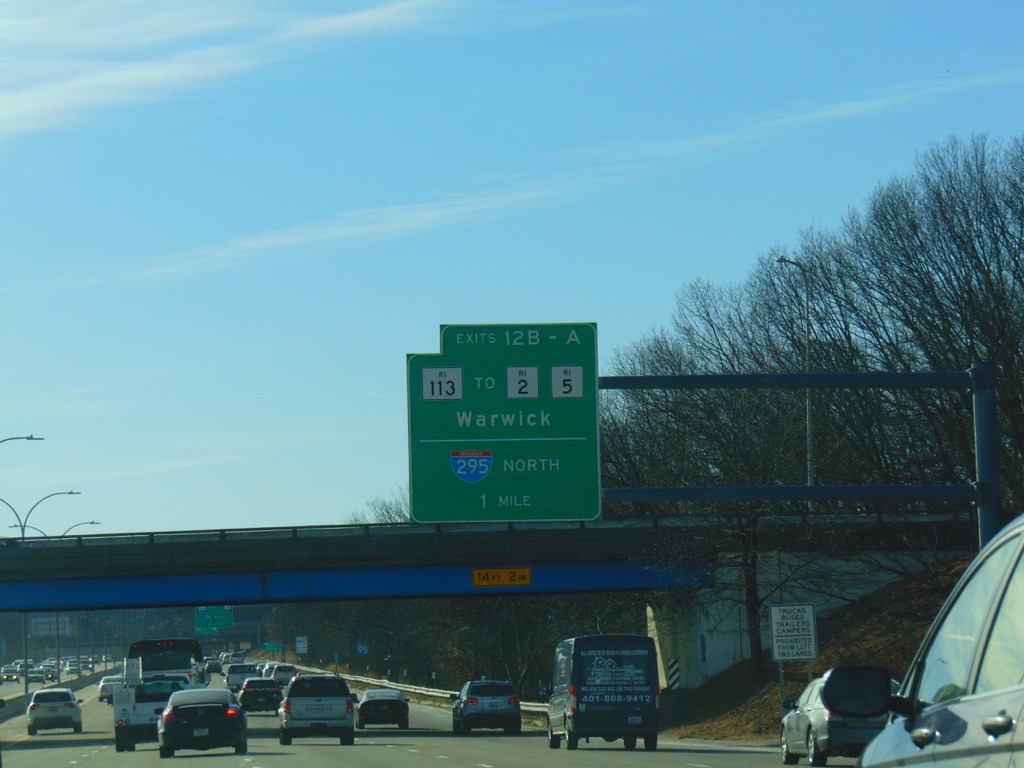
City: Providence
Specific Location: Between Point St. and O’Connell St.
Average Queue Length: 0.9 miles
Annual Total Delay: 202,280 hours
Mean Annual Average Daily Traffic (Urban): 140,711
Mean Annual Average Daily Traffic (Rural): 51,405
40
South Carolina: I-26
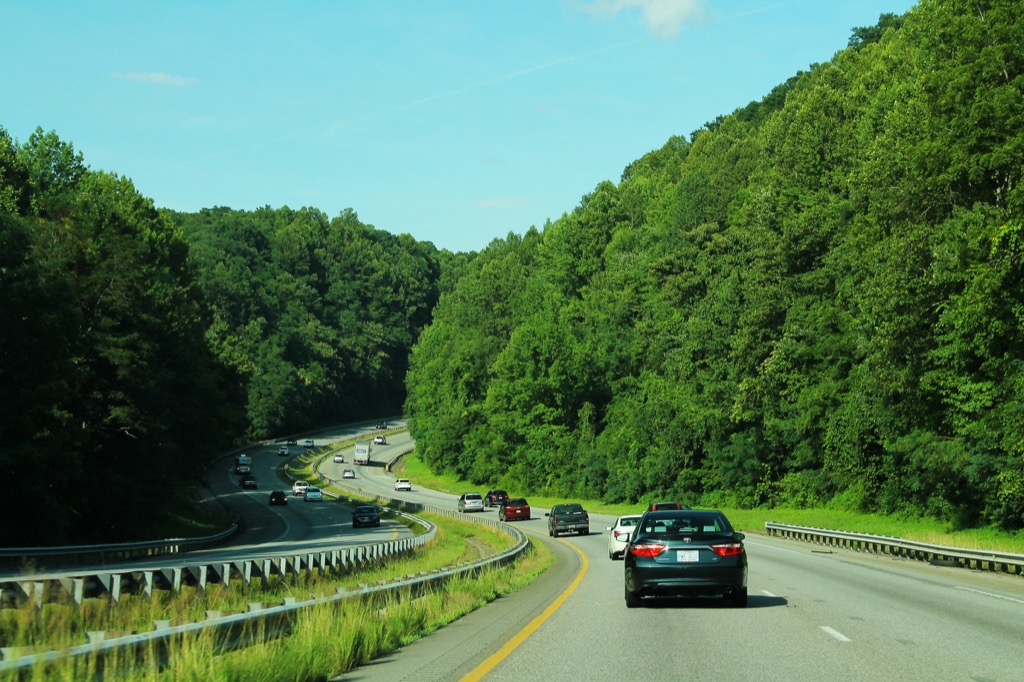
Mean Annual Average Daily Traffic (Urban): 74,682
Mean Annual Average Daily Traffic (Rural): 37,819
And to keep yourself from succumbing to road rage, bone up on The Single Best Way to Reduce Stress.
41
South Dakota: I-229
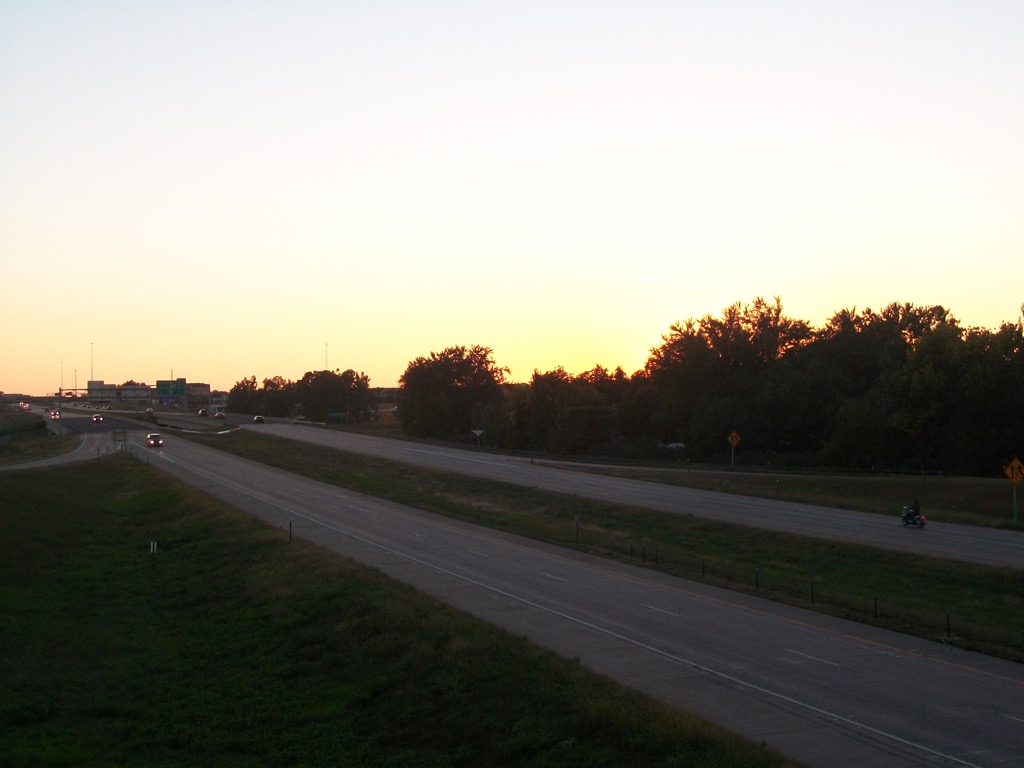
City: Sioux Falls
Mean Annual Average Daily Traffic (Urban): 34,242
42
Tennessee: I-24
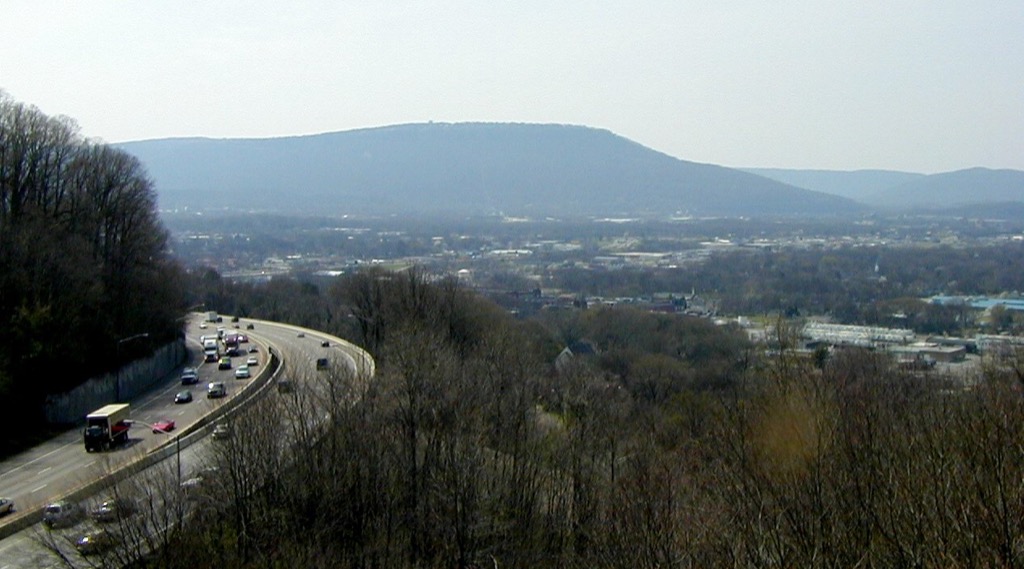
City: Nashville
Specific Location: Between I-65 and Crutcher St.
Average Queue Length: 2.1 miles
Annual Total Delay: 566,540 hours
Mean Annual Average Daily Traffic (Urban): 87,594
Mean Annual Average Daily Traffic (Rural): 40,463
43
Texas: I-35
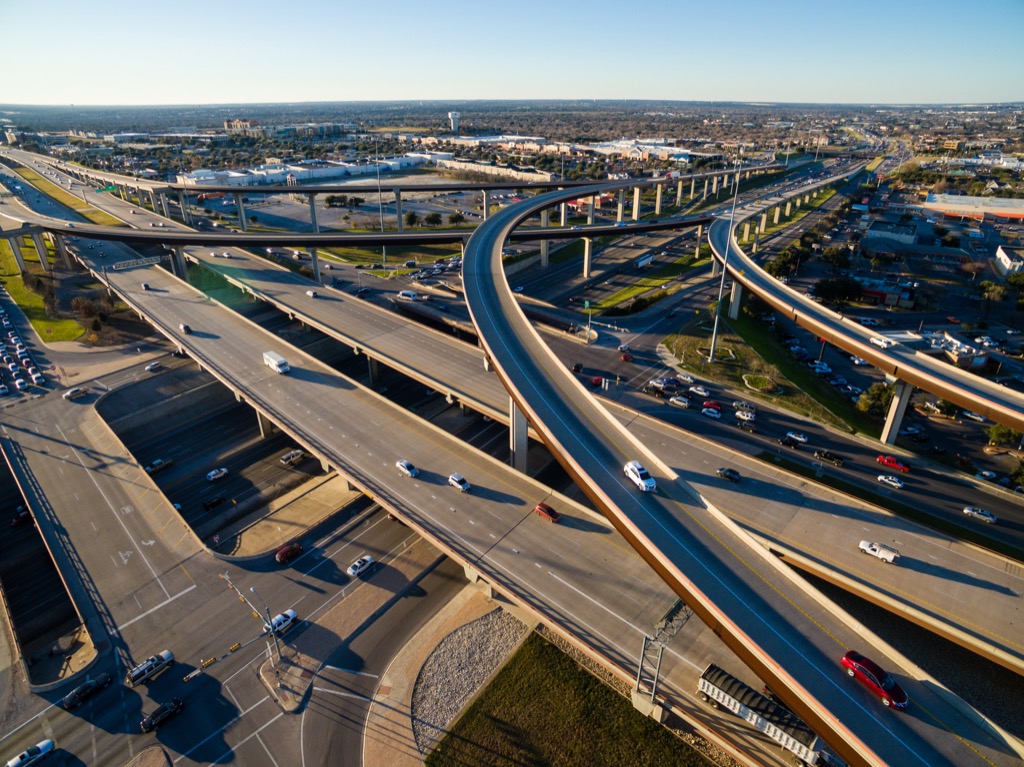
City: Austin
Specific Location: Between E Riverside Dr. and E Dean Keeton St.
Average Queue Length: 3 miles
Annual Total Delay: 3,000,000 hours
Mean Annual Average Daily Traffic (Urban): 103,411
Mean Annual Average Daily Traffic (Rural): 38,592
44
Utah: I-15
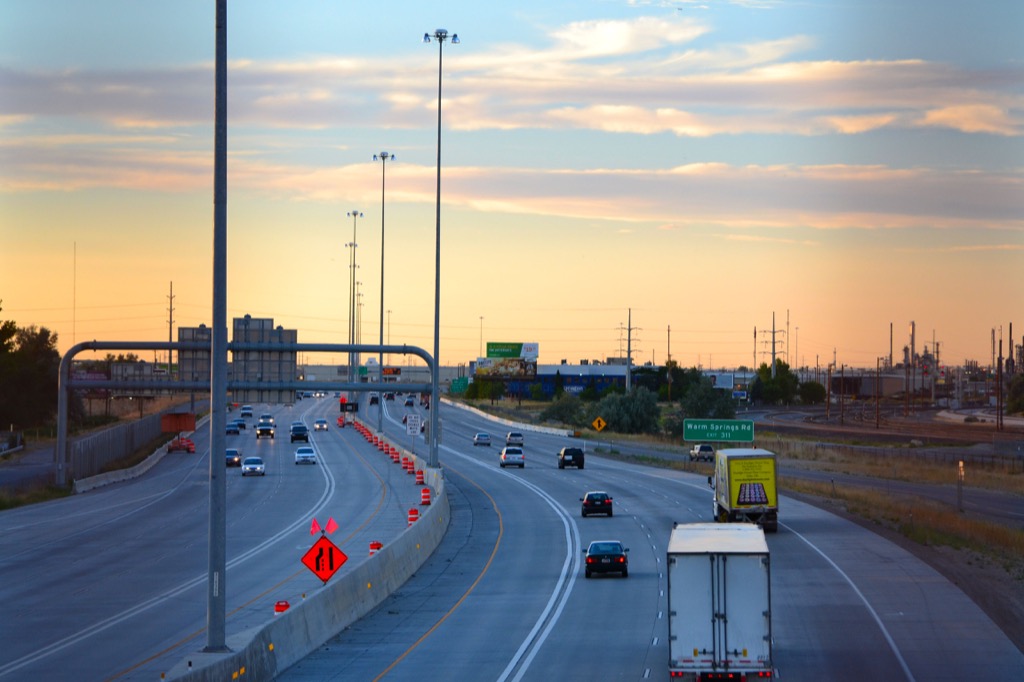
City: Salt Lake City
Specific Location: Between I-215 and S. Green St.
Average Queue Length: 0.9 miles
Annual Total Delay: 101,400 hours
Mean Annual Average Daily Traffic (Urban): 95,333
Mean Annual Average Daily Traffic (Rural): 17,859
45
Vermont: I-189
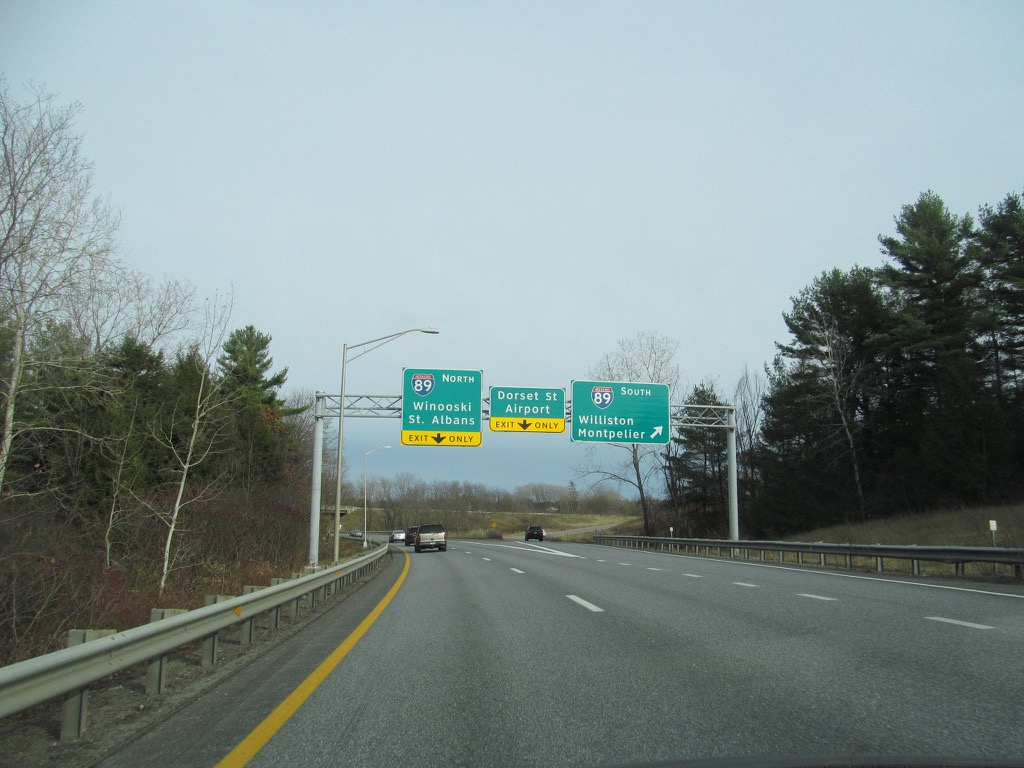
City: South Burlington
Mean Annual Average Daily Traffic (Urban): 40,000
46
Virginia: I-395
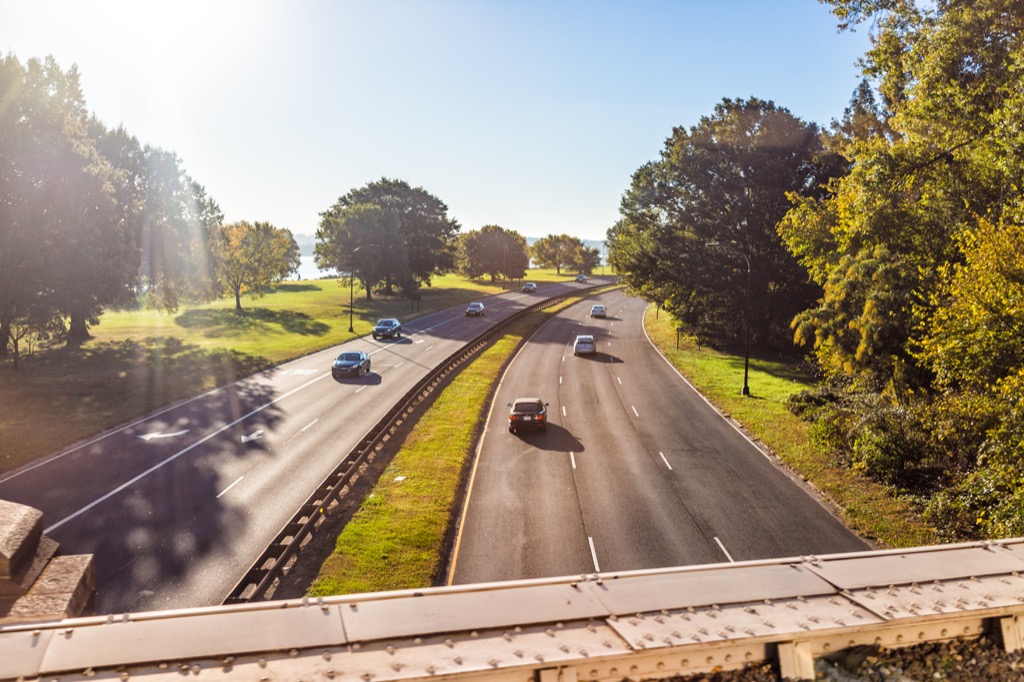
City: Arlington
Specific Location: Between Washington Blvd. and George Washington Memorial Pkwy
Average Queue Length: 1.1 miles
Annual Total Delay: 1,100,000 hours
Mean Annual Average Daily Traffic (Urban): 183,342
47
Washington: I-5
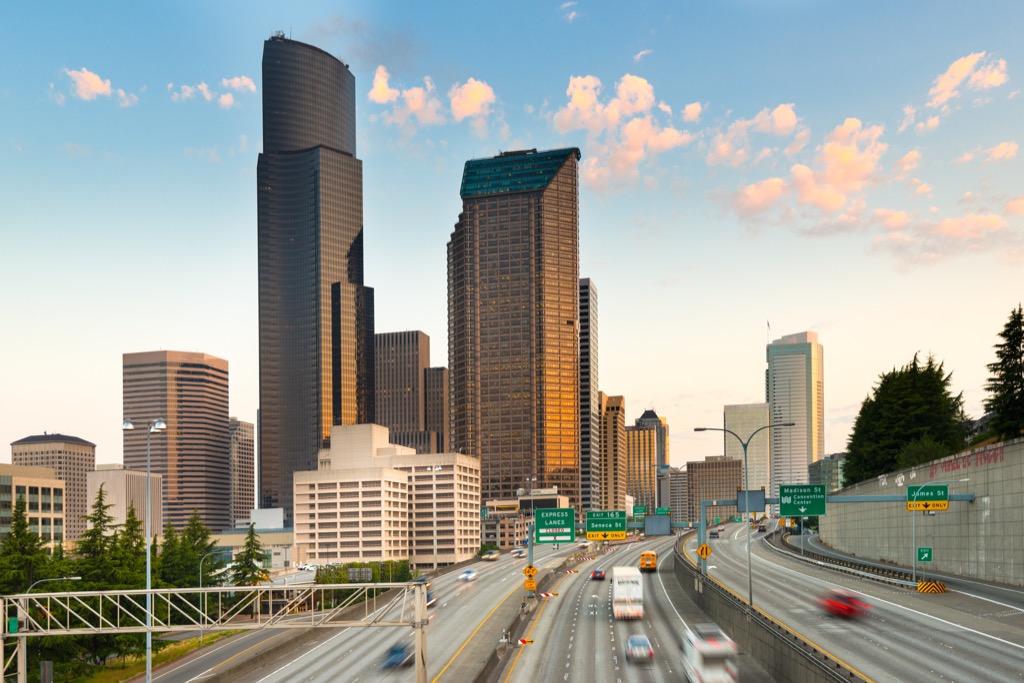
City: Seattle
Specific Location: Between Madison St. and Exit 168A
Average Queue Length: 1.6 miles
Annual Total Delay: 1,600,000 hours
Mean Annual Average Daily Traffic (Urban): 123,304
Mean Annual Average Daily Traffic (Rural): 54,679
48
West Virginia: I-81
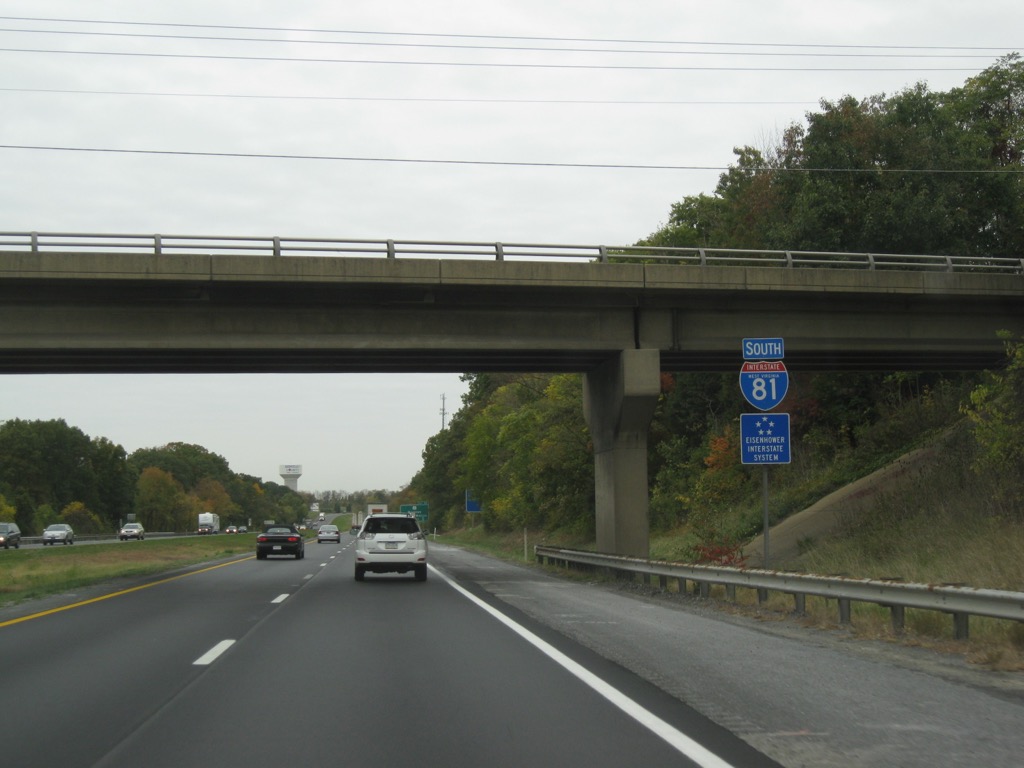
Mean Annual Average Daily Traffic (Urban): 57,030
Mean Annual Average Daily Traffic (Rural): 43,000
49
Wisconsin: I-43
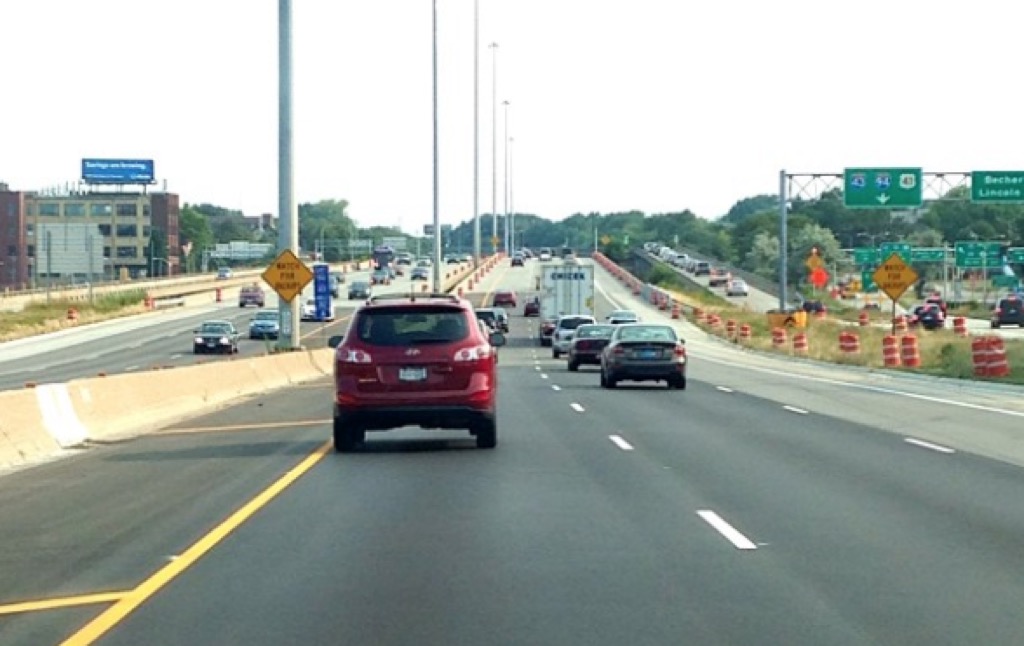
City: Milwaukee
Specific Location: Between W. Canal St. and WI-145
Average Queue Length: 1.1 miles
Annual Total Delay: 267,280 hours
Mean Annual Average Daily Traffic (Urban): 57,761
Mean Annual Average Daily Traffic (Rural): 22,437
Photo via Instagram
50
Wyoming: I-180
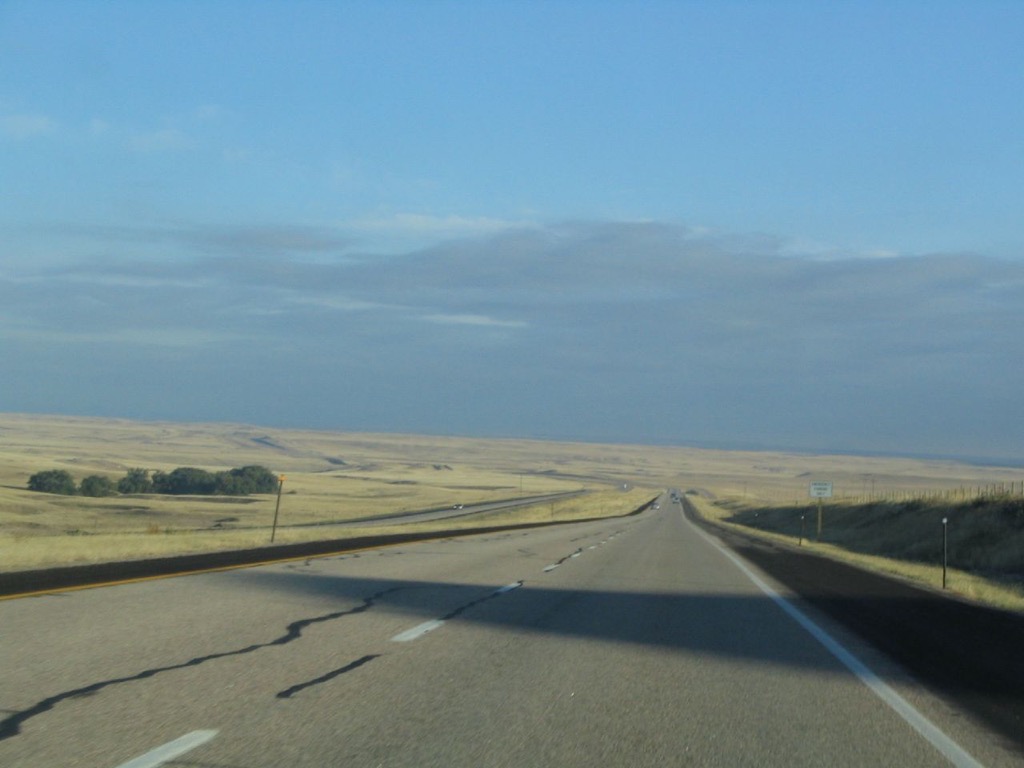
City: Cheyenne
Mean Annual Average Daily Traffic (Urban): 21,181
And for ideas on roads you should definitely cruise, check out 40 Roads Everyone Should Drive By Age 40.
To discover more amazing secrets about living your best life, click here to sign up for our FREE daily newsletter!