The 50 Best Cities in the U.S. for Flipping a House

House flipping is not for wimps. You need to be comfortable taking risks with a significant chunk of cash, know the right people (whether contractors or real estate agents), and—most important—have a keen eye for spotting where there is opportunity for a flip. There are many factors that help make an area ideal for house flipping, from home prices and property taxes, to the local population growth, to the specific types of homes that are getting bought up. While expert house-flippers can isolate their search for properties down to the individual street, bigger-picture data can also help to paint a picture of which specific cities are most desirable for someone looking to invest in house-flipping.
With this in mind, we’ve distilled the available data on the biggest metropolitan areas to determine the best cities to buy a house, renovate it, and put it back on the market. If you’re just looking to settle down yourself, however, you’ll probably be more interested in our list of The 100 Happiest Cities in America.
To determine these rankings, we took into account the following main data points.
Change in Home Prices, Year-Over-Year (15%) – determined by real estate service Trulia
Percent of Flips in 2016 (15%) – per Trulia
Three-Year Population Growth Rate (10%) – from 2013 to 2016, per U.S. Census
Overall Housing Grade (20%) – per neighborhood data analysts Niche
Market Potential Rank (out of 150) (20%) – per credit report service WalletHub
Renovation/Remodeling Rank (out of 150) (20%)– per WalletHub
50
Cincinnati, OH

49
Indianapolis, IN

Home Prices Change: 3.60%
Percent of Flips: 3.50%
Three-Year Growth Rate: 1.38%
Niche Overall Grade: A-
Market Potential Rank (out of 150): 139
Renovation/Remodeling Rank (out of 150): 31
House-Flipping Score: 44.80
48
Bakersfield, CA

Home Prices Change: 2.50%
Percent of Flips: 6.70%
Three-Year Growth Rate: 3.56%
Niche Overall Grade: B
Market Potential Rank (out of 150):: 84
Renovation/Remodeling Rank (out of 150): 130
House-Flipping Score: 44.80
You’ll most likely need to save up quite a bit before you’re ready to flip your first house—here are 14 money-saving habits you should definitely adopt.
47
Providence, RI

Home Prices Change: 4.00%
Percent of Flips: 5.80%
Three-Year Growth Rate: 0.46%
Niche Overall Grade: A
Market Potential Rank (out of 150): 44
Renovation/Remodeling Rank (out of 150): 98
House-Flipping Score: 44.96
46
Virginia Beach, VA

Home Prices Change: 1.80%
Percent of Flips: 7.00%
Three-Year Growth Rate: 0.89%
Niche Overall Grade: A
Market Potential Rank (out of 150): 18
Renovation/Remodeling Rank (out of 150): 70
House-Flipping Score: 45.70
For more beach magic, check out 9 of the World’s Greatest Beach Vacations.
45
Boston, MA

Home Prices Change: 5.20%
Percent of Flips: 5.00%
Three-Year Growth Rate: 3.39%
Niche Overall Grade: B+
Market Potential Rank (out of 150): 89
Renovation/Remodeling Rank (out of 150): 148
House-Flipping Score: 46.26
If you’re looking to get fit, look no further than Boston: It tops the list of The 50 Fittest Cities in America.
44
Tulsa, OK

Home Prices Change: 2.10%
Percent of Flips: 6.20%
Three-Year Growth Rate: 1.16%
Niche Overall Grade: B+
Market Potential Rank (out of 150): 26
Renovation/Remodeling Rank (out of 150): 14
House-Flipping Score: 46.96
43
Memphis, TN

Home Prices Change: 3.40%
Percent of Flips: 8.20%
Three-Year Growth Rate: -0.75%
Niche Overall Grade: B
Market Potential Rank (out of 150): 2
Renovation/Remodeling Rank (out of 150): 40
House-Flipping Score: 47.04
42
Minneapolis, MN

Home Prices Change: 4.50%
Percent of Flips: 5.10%
Three-Year Growth Rate: 3.38%
Niche Overall Grade: A
Market Potential Rank (out of 150): 72
Renovation/Remodeling Rank (out of 150): 119
House-Flipping Score: 48.97
41
Madison, WI

Home Prices Change: 4.50%
Percent of Flips: 4.20%
Three-Year Growth Rate: 3.83%
Niche Overall Grade: A+
Market Potential Rank (out of 150): 92
Renovation/Remodeling Rank (out of 150): 115
House-Flipping Score: 49.32
40
Winston–Salem, NC

Home Prices Change: 2.90%
Percent of Flips: 6.10%
Three-Year Growth Rate: 2.52%
Niche Overall Grade: A-
Market Potential Rank (out of 150): 22
Renovation/Remodeling Rank (out of 150): 55
House-Flipping Score: 49.36
39
Riverside, CA

Home Prices Change: 5.20%
Percent of Flips: 6.40%
Three-Year Growth Rate: 2.73%
Niche Overall Grade: B+
Market Potential Rank (out of 150): 99
Renovation/Remodeling Rank (out of 150): 108
House-Flipping Score: 50.39
38
Los Angeles, CA

Home Prices Change: 6.000%
Percent of Flips: 7.300%
Three-Year Growth Rate: 2.21%
Niche Overall Grade: B+
Market Potential Rank (out of 150): 131
Renovation/Remodeling Rank (out of 150): 140
House-Flipping Score: 50.59
37
New Orleans, LA

Home Prices Change: 5.30%
Percent of Flips: 3.50%
Three-Year Growth Rate: 3.33%
Niche Overall Grade: B+
Market Potential Rank (out of 150): 7
Renovation/Remodeling Rank (out of 150): 38
House-Flipping Score: 50.72
36
San Jose, CA

Home Prices Change: 7.80%
Percent of Flips: 5.20%
Three-Year Growth Rate: 2.37%
Niche Overall Grade: A-
Market Potential Rank (out of 150): 144
Renovation/Remodeling Rank (out of 150): 146
House-Flipping Score: 50.92
35
Fresno, CA

Home Prices Change: 4.500%
Percent of Flips: 8.200%
Three-Year Growth Rate: 2.57%
Niche Overall Grade: B
Market Potential Rank (out of 150): 46
Renovation/Remodeling Rank (out of 150): 100
House-Flipping Score: 51.84
34
Oklahoma City, OK

Home Prices Change: 3.40%
Percent of Flips: 3.60%
Three-Year Growth Rate: 4.48%
Niche Overall Grade: A-
Market Potential Rank (out of 150): 30
Renovation/Remodeling Rank (out of 150): 15
House-Flipping Score: 51.93
33
San Diego, CA

Home Prices Change: 5.80%
Percent of Flips: 5.80%
Three-Year Growth Rate: 3.56%
Niche Overall Grade: A
Market Potential Rank (out of 150): 113
Renovation/Remodeling Rank (out of 150): 132
House-Flipping Score: 52.45
Greensboro, NC

Home Prices Change: 4.10%
Percent of Flips: 5.30%
Three-Year Growth Rate: 2.63%
Niche Overall Grade: A
Market Potential Rank (out of 150): 48
Renovation/Remodeling Rank (out of 150): 11
House-Flipping Score: 53.29
31
Richmond, VA

Home Prices Change: 3.80%
Percent of Flips: 7.40%
Three-Year Growth Rate: 4.43%
Niche Overall Grade: B+
Market Potential Rank (out of 150): 19
Renovation/Remodeling Rank (out of 150): 102
House-Flipping Score: 53.45
30
Oakland, CA

Home Prices Change: 8.40%
Percent of Flips: 5.30%
Three-Year Growth Rate: 3.14%
Niche Overall Grade: A-
Market Potential Rank (out of 150): 141
Renovation/Remodeling Rank (out of 150): 143
House-Flipping Score: 54.06
29
San Francisco, CA

Home Prices Change: 8.50%
Percent of Flips: 3.90%
Three-Year Growth Rate: 3.77%
Niche Overall Grade: A+
Market Potential Rank (out of 150): 142
Renovation/Remodeling Rank (out of 150): 150
House-Flipping Score: 54.24
28
Knoxville, TN

Home Prices Change: 3.30%
Percent of Flips: 7.60%
Three-Year Growth Rate: 1.94%
Niche Overall Grade: B+
Market Potential Rank (out of 150): 21
Renovation/Remodeling Rank (out of 150): 4
House-Flipping Score: 54.41
27
Washington D.C.

Home Prices Change: 3.40%
Percent of Flips: 6.70%
Three-Year Growth Rate: 4.93%
Niche Overall Grade: A
Market Potential Rank (out of 150): 81
Renovation/Remodeling Rank (out of 150): 99
House-Flipping Score: 54.41
26
Tucson, AZ

Home Prices Change: 4.60%
Percent of Flips: 7.40%
Three-Year Growth Rate: 0.87%
Niche Overall Grade: A-
Market Potential Rank (out of 150): 68
Renovation/Remodeling Rank (out of 150): 17
House-Flipping Score: 54.56
25
Salt Lake City, UT

Home Prices Change: 6.80%
Percent of Flips: 5.50%
Three-Year Growth Rate: 1.21%
Niche Overall Grade: A+
Market Potential Rank (out of 150): 126
Renovation/Remodeling Rank (out of 150): 64
House-Flipping Score: 54.66
24
Kansas City, MO

Home Prices Change: 5.30%
Percent of Flips: 4.90%
Three-Year Growth Rate: 3.06%
Niche Overall Grade: A
Market Potential Rank (out of 150): 120
Renovation/Remodeling Rank (out of 150): 39
House-Flipping Score: 54.84
23
Dallas, TX

Home Prices Change: 9.10%
Percent of Flips: 2.80%
Three-Year Growth Rate: 4.76%
Niche Overall Grade: A-
Market Potential Rank (out of 150): 112
Renovation/Remodeling Rank (out of 150): 112
House-Flipping Score: 55.78
22
Grand Rapids, MI

Home Prices Change: 7.30%
Percent of Flips: 4.40%
Three-Year Growth Rate: 1.82%
Niche Overall Grade: A
Market Potential Rank (out of 150): 25
Renovation/Remodeling Rank (out of 150): 29
House-Flipping Score: 56.09
21
Columbus, OH

Home Prices Change: 5.30%
Percent of Flips: 5.30%
Three-Year Growth Rate: 4.27%
Niche Overall Grade: A-
Market Potential Rank (out of 150): 52
Renovation/Remodeling Rank (out of 150): 52
House-Flipping Score: 56.23
20
San Antonio, TX

Home Prices Change: 5.70%
Percent of Flips: 4.70%
Three-Year Growth Rate: 5.73%
Niche Overall Grade: A-
Market Potential Rank (out of 150): 145
Renovation/Remodeling Rank (out of 150): 24
House-Flipping Score: 60.56
19
Fort Worth, TX

Home Prices Change: 8.10%
Percent of Flips: 2.10%
Three-Year Growth Rate: 7.30%
Niche Overall Grade: B+
Market Potential Rank (out of 150): 136
Renovation/Remodeling Rank (out of 150): 43
House-Flipping Score: 61.05
18
Atlanta, GA

Home Prices Change: 6.50%
Percent of Flips: 7.90%
Three-Year Growth Rate: 5.50%
Niche Overall Grade: A
Market Potential Rank (out of 150): 32
Renovation/Remodeling Rank (out of 150): 141
House-Flipping Score: 61.38
17
Colorado Springs, CO

Home Prices Change: 5.90%
Percent of Flips: 5.40%
Three-Year Growth Rate: 5.47%
Niche Overall Grade: A
Market Potential Rank (out of 150): 51
Renovation/Remodeling Rank (out of 150): 46
House-Flipping Score: 61.44
16
Raleigh, NC

Home Prices Change: 5.70%
Percent of Flips: 4.60%
Three-Year Growth Rate: 6.35%
Niche Overall Grade: A+
Market Potential Rank (out of 150): 104
Renovation/Remodeling Rank (out of 150): 45
House-Flipping Score: 62.23
15
Charlotte, NC

Home Prices Change: 6.40%
Percent of Flips: 5.80%
Three-Year Growth Rate: 6.20%
Niche Overall Grade: A
Market Potential Rank (out of 150): 64
Renovation/Remodeling Rank (out of 150): 75
House-Flipping Score: 62.75
14
Jacksonville, FL

Home Prices Change: 7.80%
Percent of Flips: 7.40%
Three-Year Growth Rate: 4.39%
Niche Overall Grade: B+
Market Potential Rank (out of 150): 14
Renovation/Remodeling Rank (out of 150): 69
House-Flipping Score: 63.57
13
Austin, TX

Home Prices Change: 7.90%
Percent of Flips: 3.40%
Three-Year Growth Rate: 7.06%
Niche Overall Grade: A+
Market Potential Rank (out of 150): 146
Renovation/Remodeling Rank (out of 150): 65
House-Flipping Score: 64.30
12
Fort Lauderdale, FL

Home Prices Change: 7.60%
Percent of Flips: 8.00%
Three-Year Growth Rate: 3.59%
Niche Overall Grade: A-
Market Potential Rank (out of 150): 49
Renovation/Remodeling Rank (out of 150): 58
House-Flipping Score: 64.49
11
Tacoma, WA

Home Prices Change: 9.30%
Percent of Flips: 7.60%
Three-Year Growth Rate: 4.21%
Niche Overall Grade: B+
Market Potential Rank (out of 150): 23
Renovation/Remodeling Rank (out of 150): 81
House-Flipping Score: 65.81
10
Portland, OR

Home Prices Change: 11.00%
Percent of Flips: 5.70%
Three-Year Growth Rate: 5.05%
Niche Overall Grade: A
Market Potential Rank (out of 150): 82
Renovation/Remodeling Rank (out of 150): 126
House-Flipping Score: 66.04
9
Miami, FL

Home Prices Change: 8.80%
Percent of Flips: 6.90%
Three-Year Growth Rate: 7.69%
Niche Overall Grade: B
Market Potential Rank (out of 150): 91
Renovation/Remodeling Rank (out of 150): 87
House-Flipping Score: 68.92
8
Phoenix, AZ

Home Prices Change: 6.70%
Percent of Flips: 7.30%
Three-Year Growth Rate: 5.86%
Niche Overall Grade: A
Market Potential Rank (out of 150): 61
Renovation/Remodeling Rank (out of 150): 22
House-Flipping Score: 69.22
7
Nashville, TN

Home Prices Change: 8.20%
Percent of Flips: 8.10%
Three-Year Growth Rate: 4.02%
Niche Overall Grade: A-
Market Potential Rank (out of 150): 56
Renovation/Remodeling Rank (out of 150): 12
House-Flipping Score: 69.81
6
Seattle, WA

Home Prices Change: 10.90%
Percent of Flips: 5.20%
Three-Year Growth Rate: 7.85%
Niche Overall Grade: A+
Market Potential Rank (out of 150): 41
Renovation/Remodeling Rank (out of 150): 128
House-Flipping Score: 71.34
5
Las Vegas, NV

Home Prices Change: 6.90%
Percent of Flips: 10.50%
Three-Year Growth Rate: 5.00%
Niche Overall Grade: B+
Market Potential Rank (out of 150): 90
Renovation/Remodeling Rank (out of 150): 25
House-Flipping Score: 72.08
In case you’d like to do more than just invest in houses while you’re in the area, here’s the easiest way to double your money in Vegas.
4
Cape Coral, FL
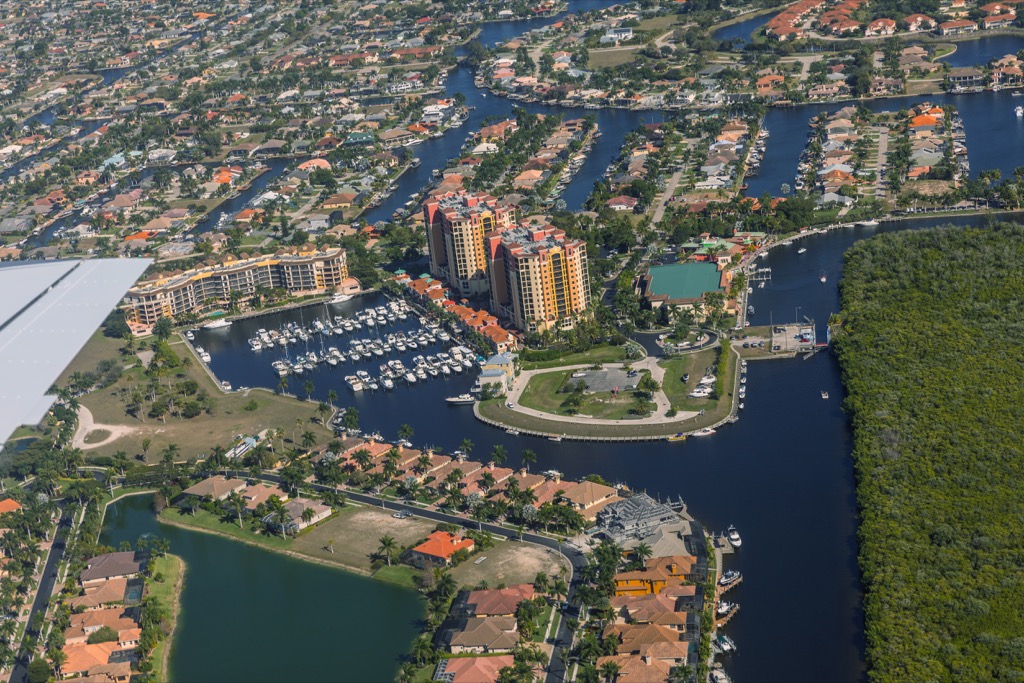
Home Prices Change: 9.40%
Percent of Flips: 6.00%
Three-Year Growth Rate: 8.90%
Niche Overall Grade: B+
Market Potential Rank (out of 150): 98
Renovation/Remodeling Rank (out of 150): 71
House-Flipping Score: 72.81
3
Denver, CO

Home Prices Change: 10.40%
Percent of Flips: 5.80%
Three-Year Growth Rate: 7.05%
Niche Overall Grade: A
Market Potential Rank (out of 150): 111
Renovation/Remodeling Rank (out of 150): 50
House-Flipping Score: 74.09
2
Orlando, FL

Home Prices Change: 8.00%
Percent of Flips: 7.20%
Three-Year Growth Rate: 8.44%
Niche Overall Grade: A
Market Potential Rank (out of 150): 29
Renovation/Remodeling Rank (out of 150): 23
House-Flipping Score: 76.73
1
Tampa, FL

Home Prices Change: 8.80%
Percent of Flips: 8.40%
Three-Year Growth Rate: 6.86%
Niche Overall Grade: A
Market Potential Rank (out of 150): 8
Renovation/Remodeling Rank (out of 150): 19
House-Flipping Score: 77.85
Tempted to settle down with your dough in a new mansion? You’re in the right place: Florida is home to 5 of The 50 Best Cities in the U.S. for Buying a Mansion.
For more amazing advice for living smarter, looking better, and feeling younger, follow us on Facebook now!