The 10 Worst Cities to Drive In, New Research Shows—And NYC Is Not #1

fiThe ease with which you can get around in your vehicle can greatly affect daily life in a city. Of course, no place is immune to the stress of getting stuck in rush hour gridlock and the infrastructure woes that can make commuting by car a nightmare—even if they’re not among the largest metropolises on the map. But if you’ve ever wondered just how bad you have it every time you start your engine, new research now shows which cities are the worst to drive in.
The latest findings come thanks to a study conducted by personal finance website WalletHub, which collected data from the 100 most populated cities across the U.S., excluding their surrounding metro areas. The team organized information into four primary focus areas: ownership and maintenance; traffic and infrastructure; safety; and access to vehicles and maintenance. They then established a score out of a perfect 100 for 30 different metrics—including the average cost of repairs and the amount of time spent in traffic—and weighted each place’s average to determine the rankings.
Even if you’re convinced that your grueling commute made the list, the final standings do hold some surprises. Read on for the worst cities to drive in, according to new research from WalletHub.
RELATED: The Safest City in Every State, New Data Shows.
10
Stockton, California
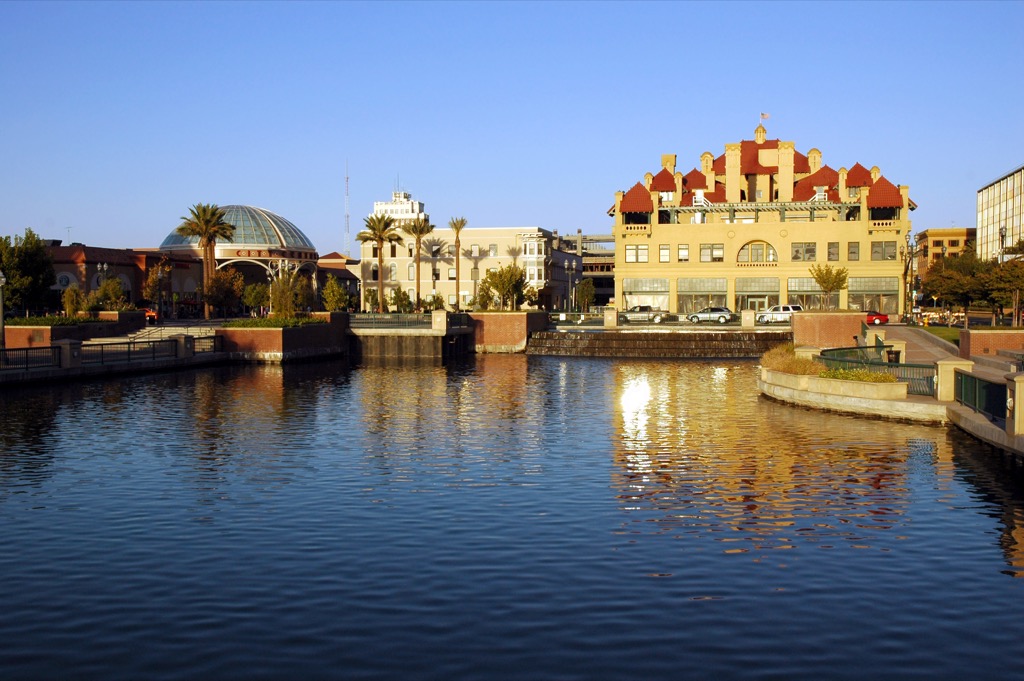
Total score: 46.52
Drivers in the Golden State are no strangers to a brutal commute, including in Stockton. The city ranks 50th overall for its traffic and infrastructure but suffers with an 84th place showing in vehicle access and maintenance and 90th for cost of ownership.
9
Seattle, Washington
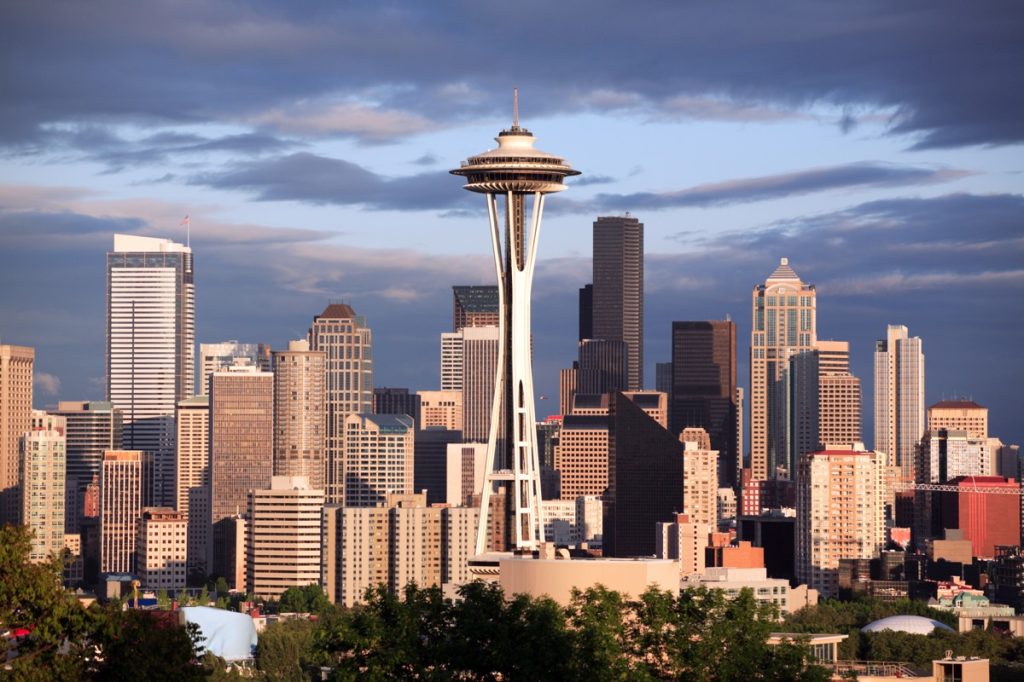
Total score: 44.52
Washington’s biggest city has a big problem when it comes to driving. Data shows that Seattle lives up to its rainy reputation, tying with Cleveland, Ohio as the city with the second most days with precipitation. It also fares poorly in ownership and maintenance costs in 82nd place and traffic and infrastructure in 85th place nationwide.
RELATED: 12 Best U.S. Road Trips to See Fall Foliage.
8
New York, New York

Total score: 42.23
The Big Apple may be the city that never sleeps, but it’s also one of the places where it’s hardest to get around by car. It tied with four other cities for annual hours spent in congestion per auto commuter, tied with three other cities for the highest parking rates, and took the top spot for fewest auto body shops per capita. But it’s not all bad news: Gotham can also claim the fifth-lowest car theft rate in the U.S.
7
Chicago, Illinois
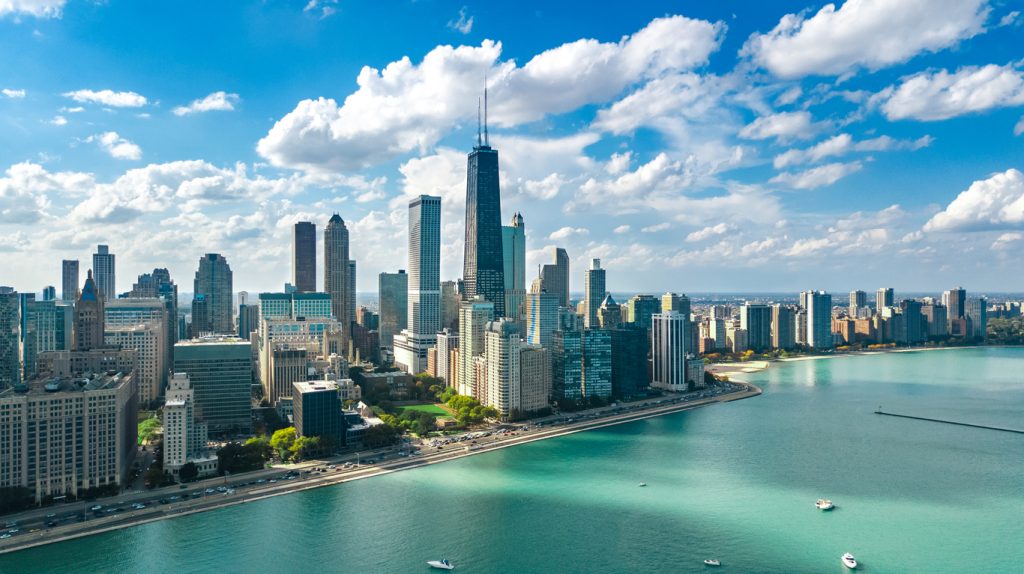
Total score: 41.44
The nation’s third-largest city also experiences its fair share of auto-related headaches. Chicago was found to be among the bottom five in annual hours spent in congestion per auto commuter but also ranked second highest for auto maintenance costs, second highest for parking rates, and second to last overall in the traffic and infrastructure category.
RELATED: The 10 Riskiest U.S. Cities for Natural Disasters, New Research Shows.
6
Philadelphia, Pennsylvania
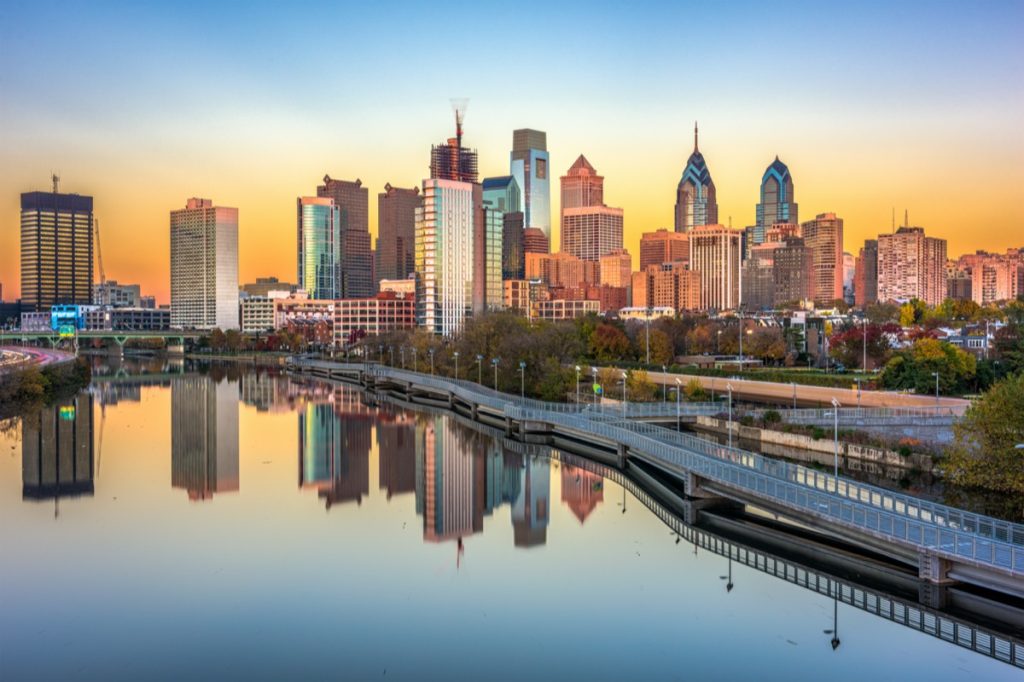
Total score: 41.29
Drivers in Philly aren’t working with the most manageable set of conditions. The City of Brotherly Love is another locale tied for last place when it comes to the highest parking rates and among the five cities tied for the most annual hours spent in congestion per auto commuter.
5
Los Angeles, California
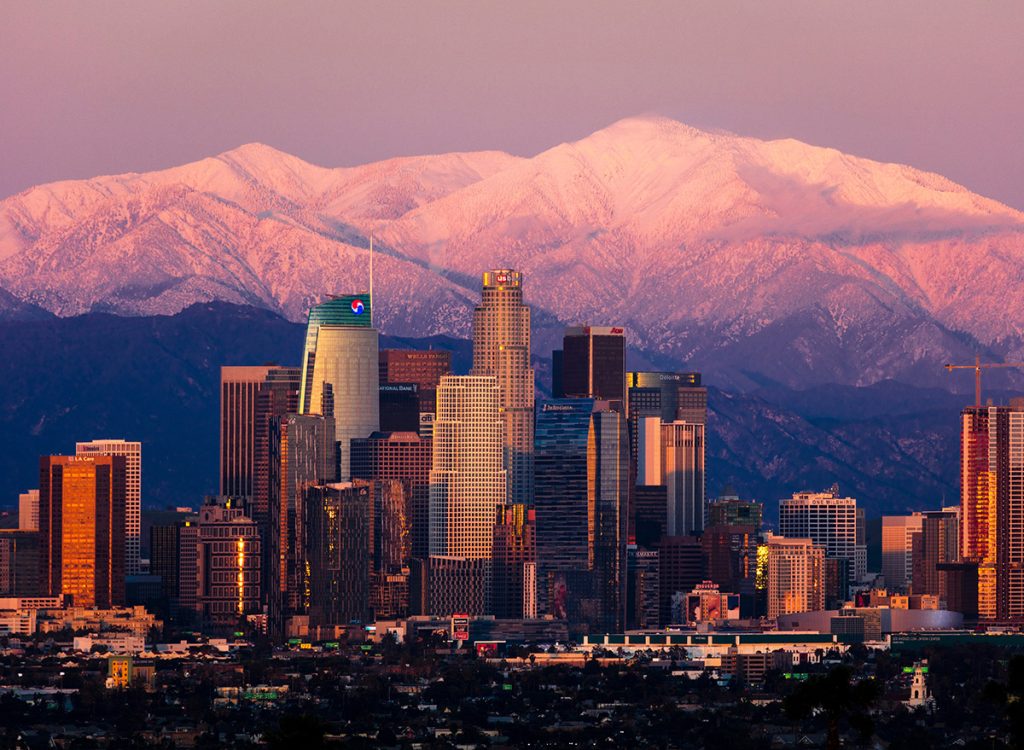
Total score: 40.68
Data from the WalletHub study tends to uphold Los Angeles’ reputation for having frustrating conditions on the road. The city ranked second to last in the number of auto body shops per capita, tied with three others for the highest likelihood of an accident versus the national average, and tied for the highest average gas prices anywhere in the U.S.
RELATED: If This Happens While You’re Driving, “Call 911” ASAP, Police Say in New Warning.
4
Washington, D.C.
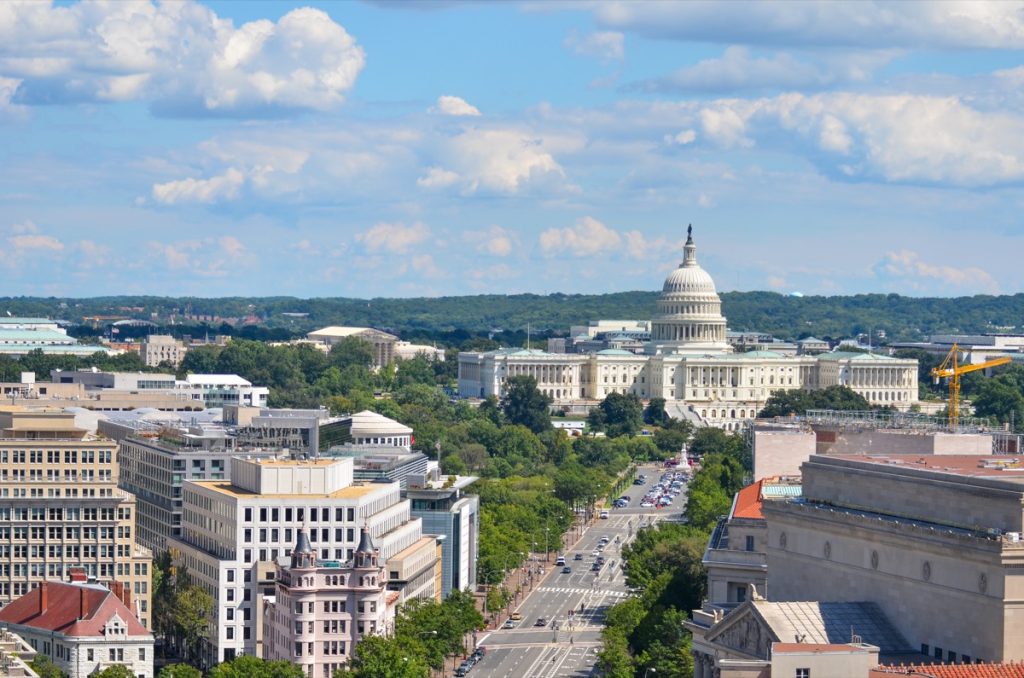
Total score: 40.47
Research shows that getting into and around the nation’s capital by car can be a bit of a nightmare. It’s one of the cities tied for the highest likelihood of an accident versus the national average, ranks 93rd in the U.S. for safety, and is 97th overall in the “traffic and infrastructure” category.
3
Detroit, Michigan
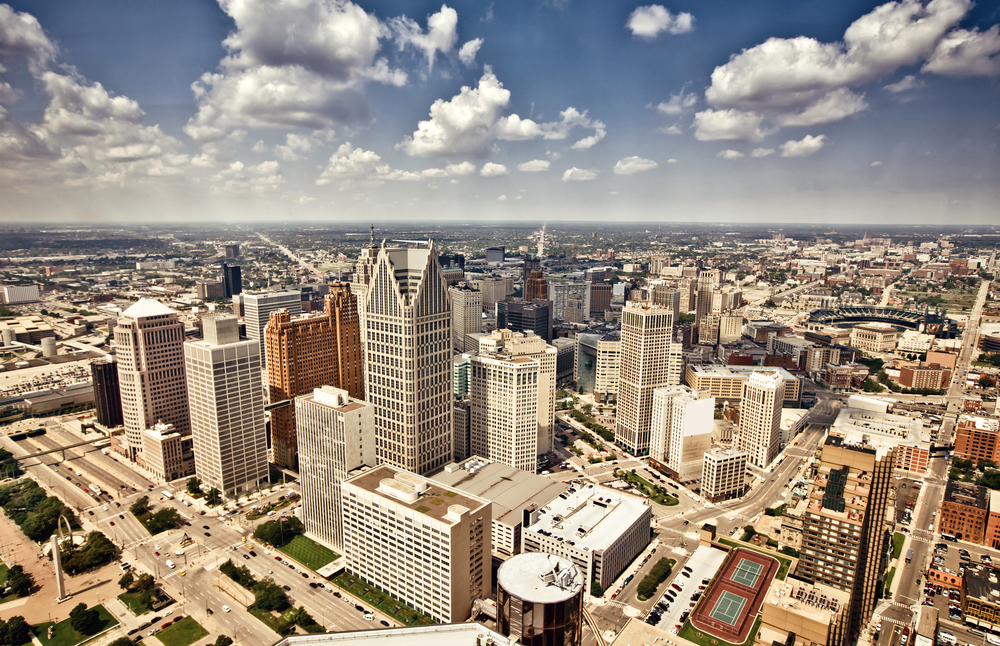
Total score: 38.87
Ironically, data shows that Motor City isn’t a great place to drive. While it’s middling when it comes to vehicle and maintenance access at 51st overall, the city ranks 89th for traffic and infrastructure and second to last in the safety category.
RELATED: The Most Dangerous State to Work In Has 155% Higher Deaths Than Average, New Data Shows.
2
San Francisco, California
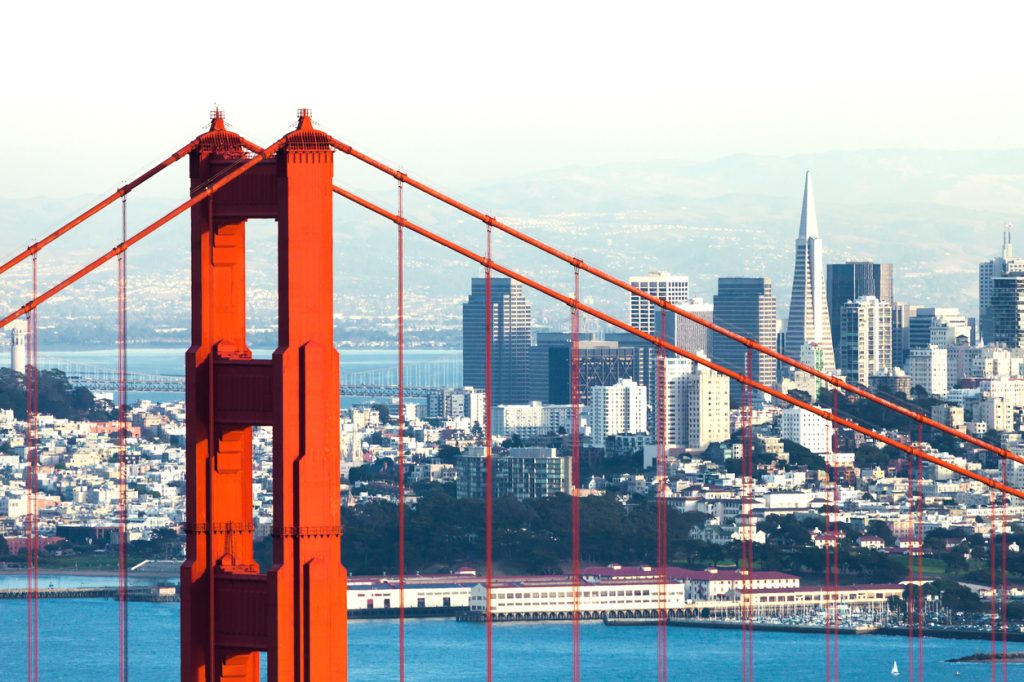
Total score: 38.15
Even as California’s third entry on the list, San Francisco stands out as being the most expensive place in the state for auto maintenance costs, ranking 97th nationally. It’s also 93rd in the traffic and infrastructure category and 99th in cost of ownership and maintenance.
1
Oakland, California
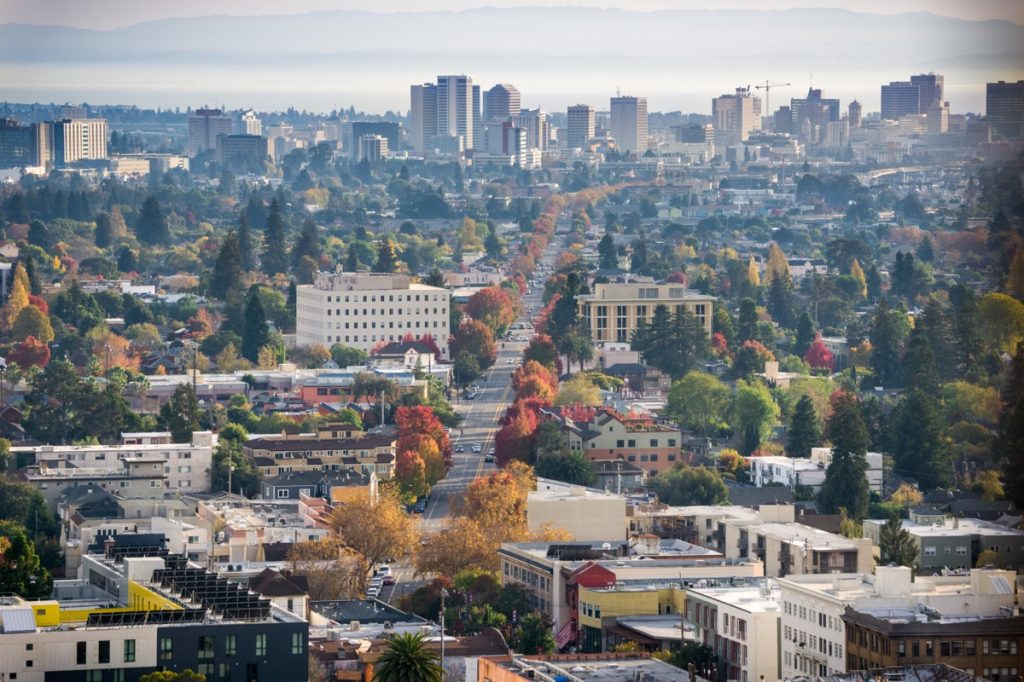
Total score: 38.14
Oakland just barely beat out its Bay Area brethren with its ranking, making it the worst city to drive in anywhere in the U.S. Besides ranking 96th for the highest likelihood of having an accident versus the national average, it also suffers the worst car theft rate and is ranked dead last when it comes to the cost of ownership and maintenance category.
For more city guides sent directly to your inbox, sign up for our daily newsletter.