The 50 Cities with the Worst Commutes in America
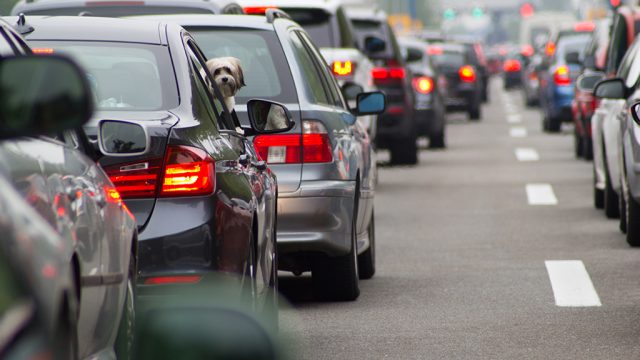
It’s a fundamental truth that everyone who has a commute is guaranteed to complain about it—regardless of how bad it truly is. Well, to help put your own commute in perspective, we dug into the data to figure out which cities have the longest (and truly worst) commutes overall. Some of the results are as you might expect: artery-clogged California dominates this list, as does the greater New York City area, which is home to more than 8 million people. But there are also a few surprises (Los Angeles doesn’t even crack the top 25!). So take a look and see where you rank. And if you’re living in one of these top cities, make sure you know the 7 Ways to Make Your Commute the Best Part of Your Day.
Our Methodology: All of these results were pulled from U.S. Census Bureau data for the 200 largest cities in the United States. Final “commute score” was calculated by combining the mean travel time to work, the percentage of the population who spend 60 minutes or more in their commute, the growth rate of a city, and considerations of the percentage who worked at home or biked/walked to work.
50
Oceanside, CA
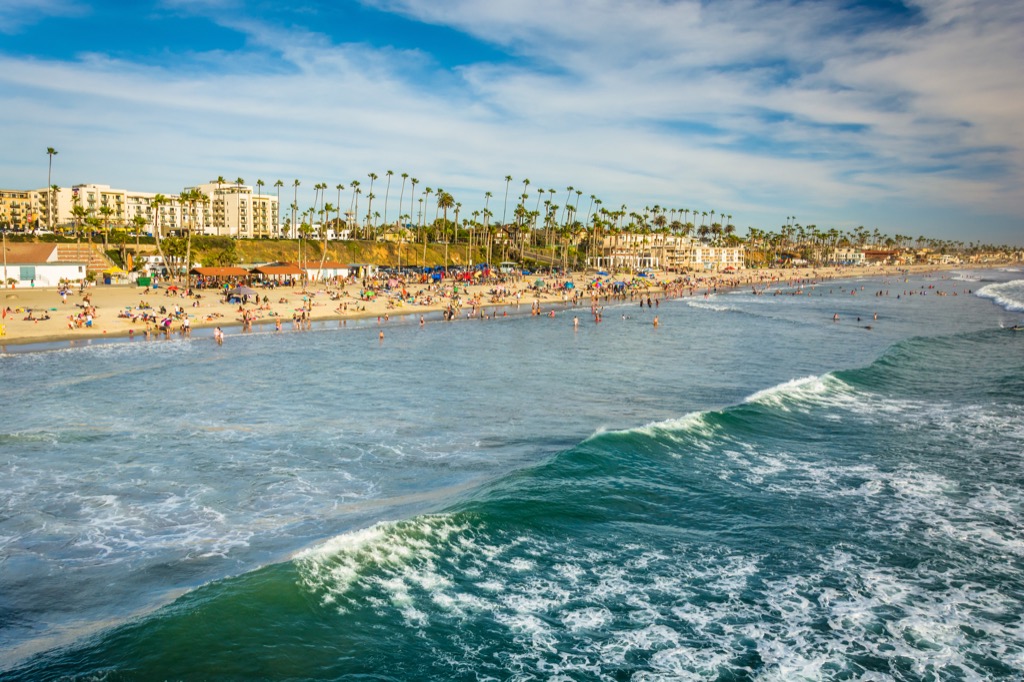
Population: 175,464
3-Year Growth Rate: 1.42%
Mean travel time to work (minutes): 27.90
60 minutes or more commute (%): 10.30%
Drove alone (%): 78.60%
Carpooled (%): 10.20%
Worked at home (%): 5.10%
Bicycle and Walk (%): 1.60%
Commute Score: 39.62
Don’t let the commute drain all your energy before you even get to the office—try one of these 20 best energizing beauty products for an extra morning boost that won’t wear off.
49
Tacoma, WA
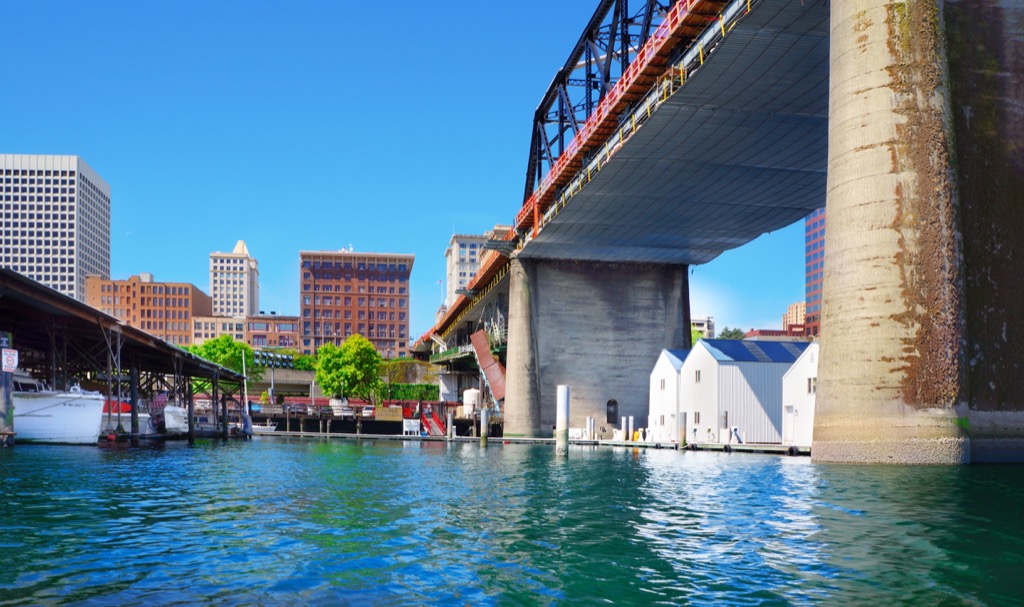
Population: 211,277
3-Year Growth Rate: 4.21%
Mean travel time to work (minutes): 26.30
60 minutes or more commute (%): 9.40%
Drove alone (%): 75.80%
Carpooled (%): 10.20%
Worked at home (%): 3.70%
Bicycle and Walk (%): 4.20%
Commute Score: 39.91
48
Anaheim, CA
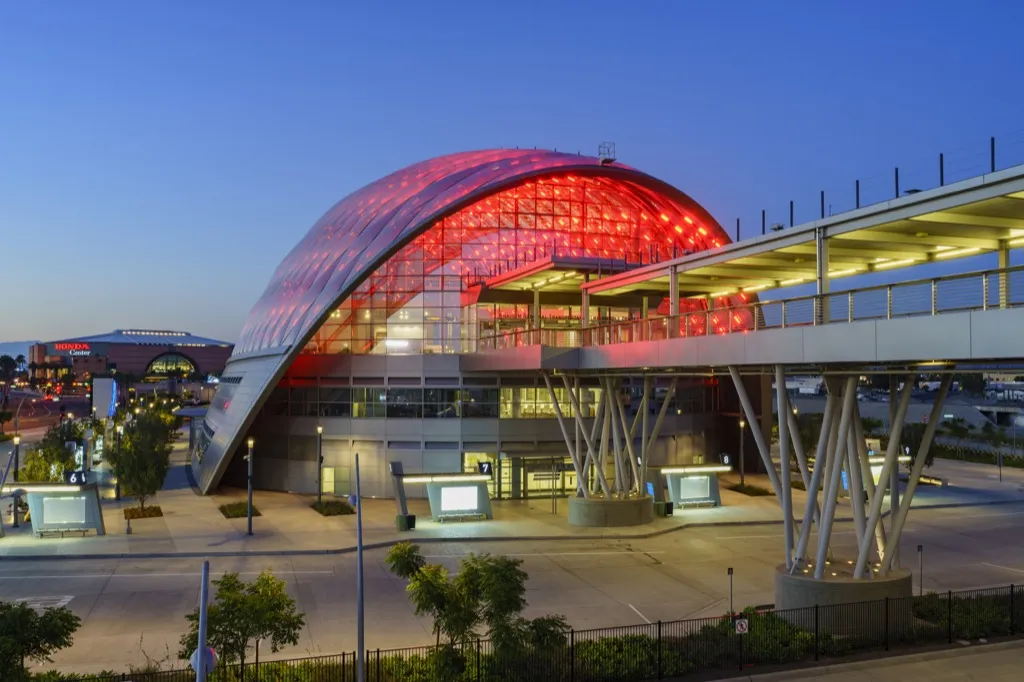
Population: 351,043
3-Year Growth Rate: 1.78%
Mean travel time to work (minutes): 27.90
60 minutes or more commute (%): 10.30%
Drove alone (%): 76.50%
Carpooled (%): 12.70%
Worked at home (%): 3.20%
Bicycle and Walk (%): 2.70%
Commute Score: 39.98
If the daily commutes always work you into a frenzy, keep in mind The Best Way to Chill out When You Want to Totally Lose It.
47
Modesto, CA
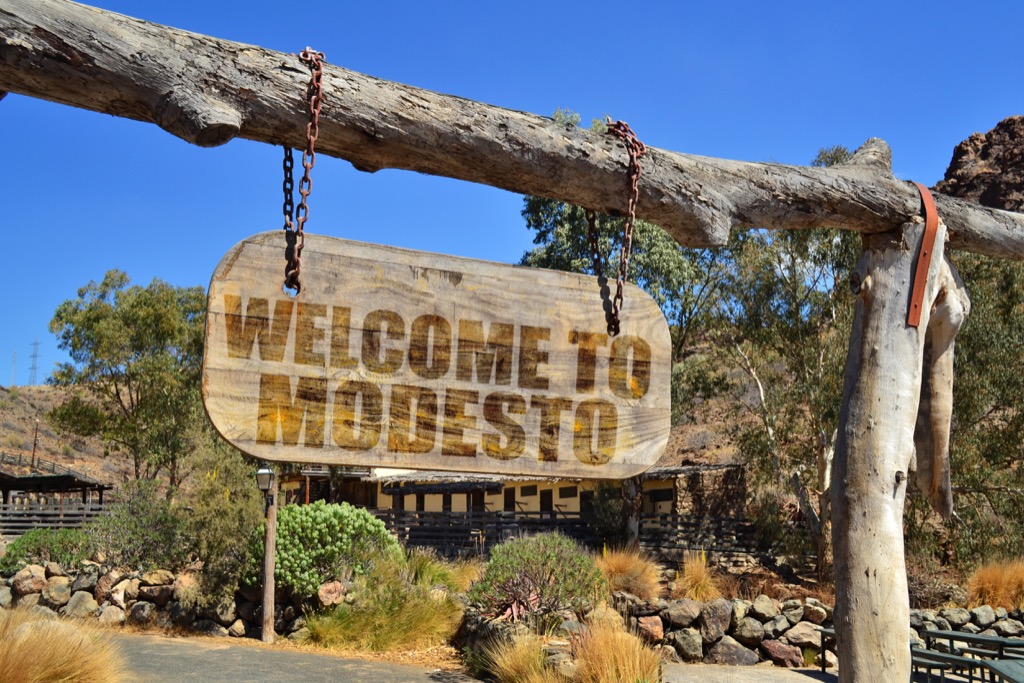
Population: 212,175
3-Year Growth Rate: 2.71%
Mean travel time to work (minutes): 26.10
60 minutes or more commute (%): 11.40%
Drove alone (%): 81.20%
Carpooled (%): 10.50%
Worked at home (%): 3.60%
Bicycle and Walk (%): 2.00%
Commute Score: 40.21
For more advice on how to de-stress, here are the 10 best non-exercise stress busters.
46
Seattle, WA
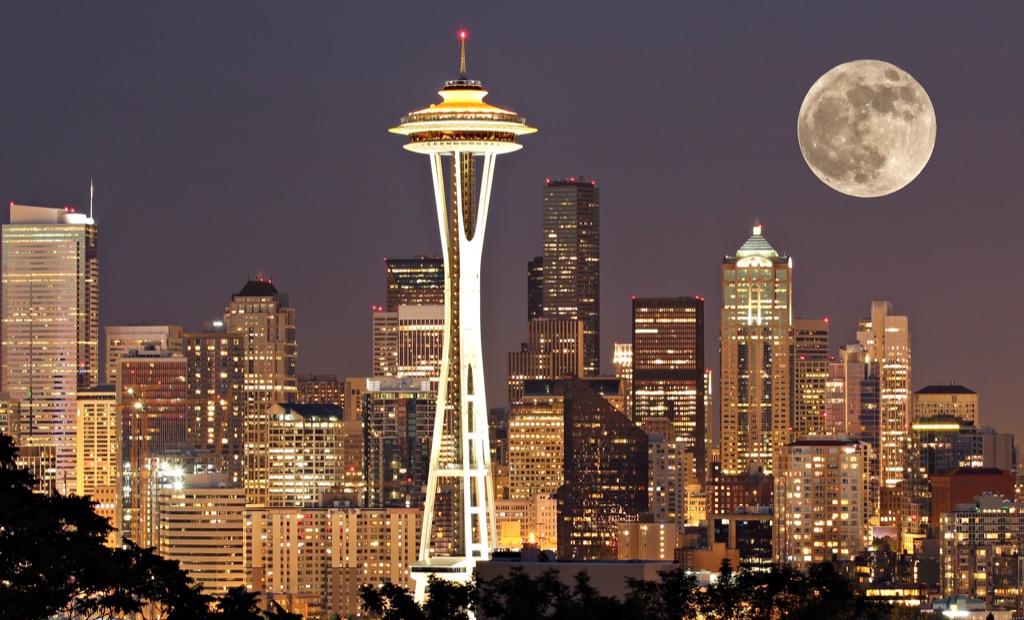
Population: 704,352
3-Year Growth Rate: 7.85%
Mean travel time to work (minutes): 26.50
60 minutes or more commute (%): 6.00%
Drove alone (%): 50.10%
Carpooled (%): 8.20%
Worked at home (%): 6.70%
Bicycle and Walk (%): 13.40%
Commute Score: 40.35
45
Fort Worth, TX
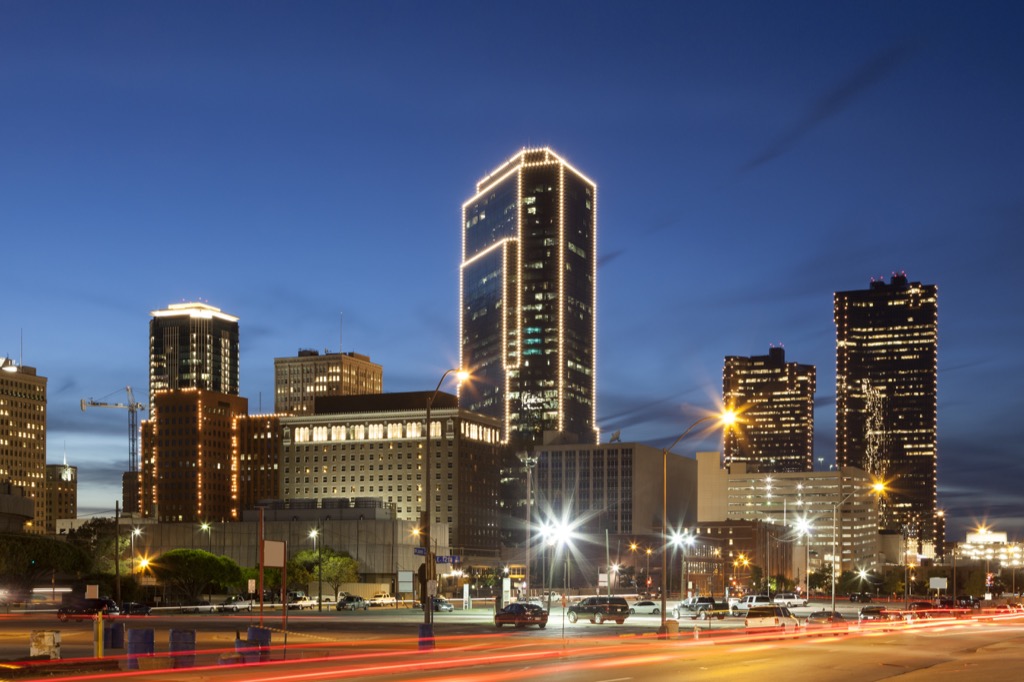
Population: 854,113
3-Year Growth Rate: 7.30%
Mean travel time to work (minutes): 26.30
60 minutes or more commute (%): 7.70%
Drove alone (%): 81.90%
Carpooled (%): 11.10%
Worked at home (%): 3.20%
Bicycle and Walk (%): 1.50%
Commute Score: 41.30
If you’re worried commuting is taking years off your life, here’s how you can stay young and lean with these 20 anti-aging super foods.
44
Gilbert, AZ
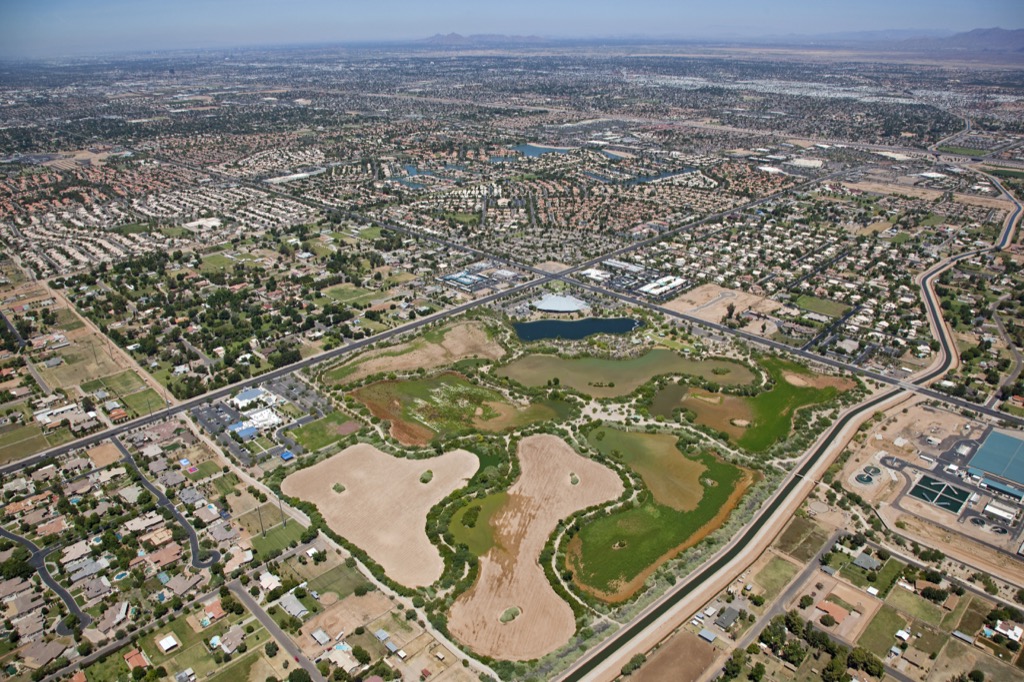
Population: 237,133
3-Year Growth Rate: 7.05%
Mean travel time to work (minutes): 27.40
60 minutes or more commute (%): 7.00%
Drove alone (%): 7880.00%
Carpooled (%): 1020.00%
Worked at home (%): 720.00%
Bicycle and Walk (%): 1.50%
Commute Score: 41.45
43
Aurora, IL
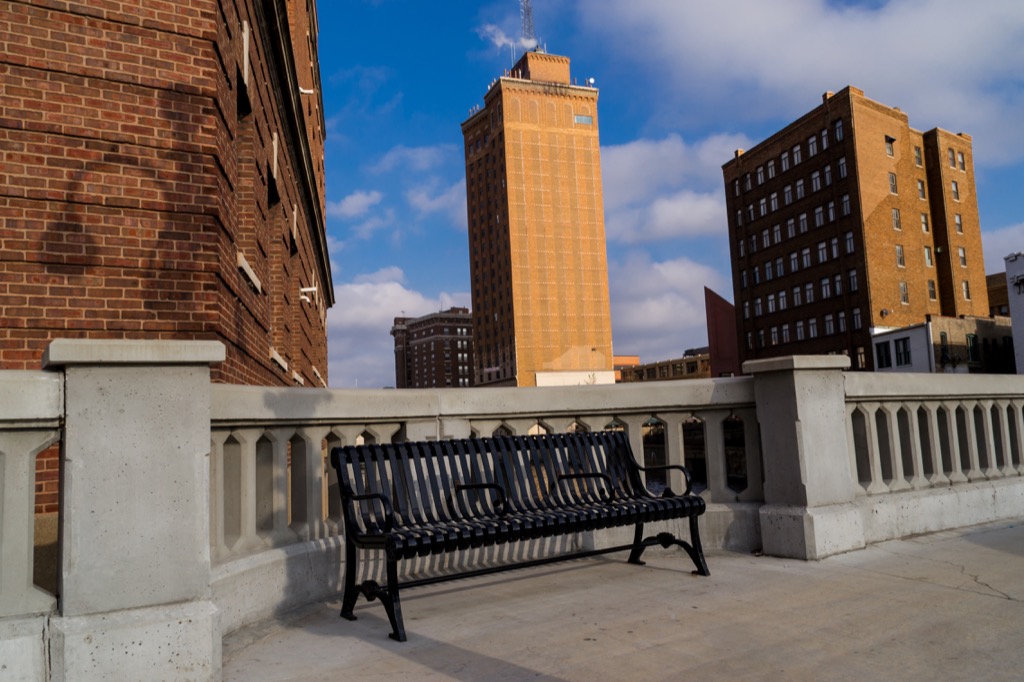
Population: 201,110
3-Year Growth Rate: 0.52%
Mean travel time to work (minutes): 29.00
60 minutes or more commute (%): 12.10%
Drove alone (%): 77.70%
Carpooled (%): 1170.00%
Worked at home (%): 4.10%
Bicycle and Walk (%): 1.50%
Commute Score: 41.62
42
Long Beach, CA
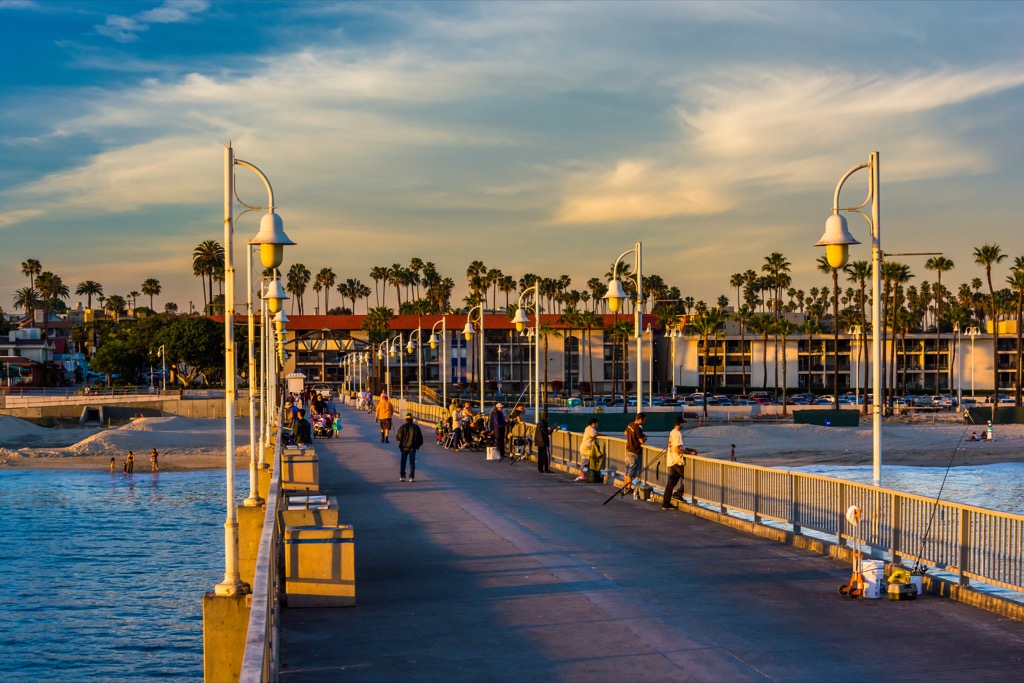
Population: 470,130
3-Year Growth Rate: 0.21%
Mean travel time to work (minutes): 29.50
60 minutes or more commute (%): 12.20%
Drove alone (%): 74.10%
Carpooled (%): 9.20%
Worked at home (%): 4.70%
Bicycle and Walk (%): 3.30%
Commute Score: 41.91
41
Baltimore, MD
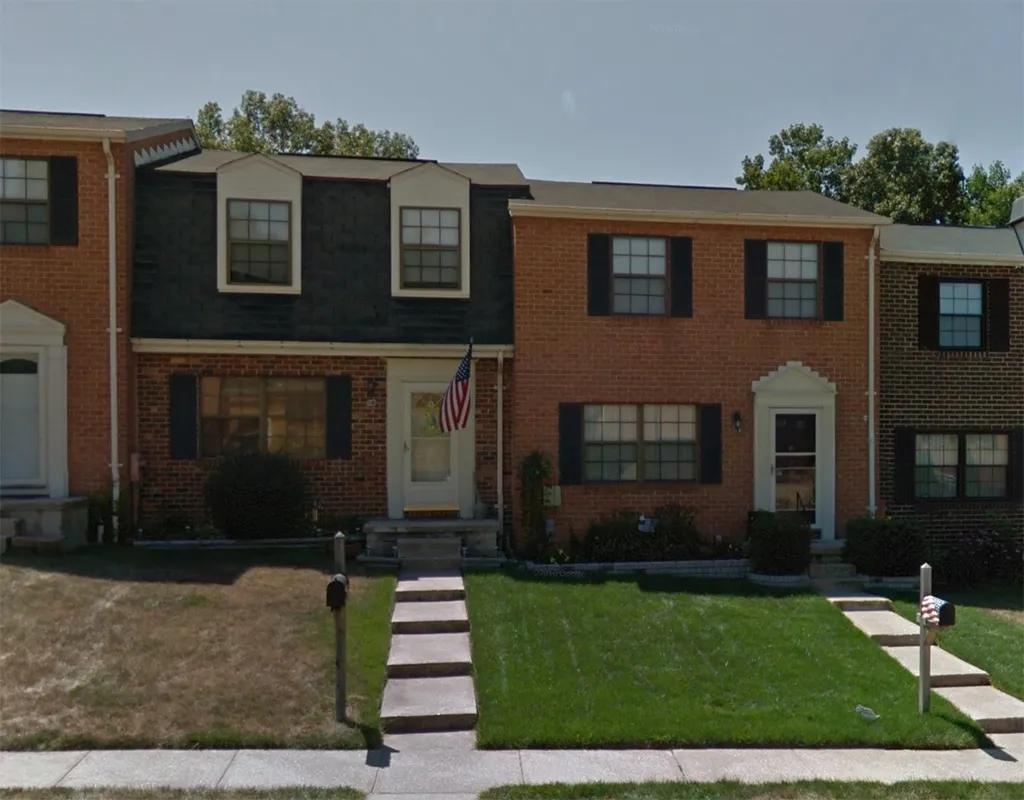
Population: 614,664
3-Year Growth Rate: -1.32%
Mean travel time to work (minutes): 30.50
60 minutes or more commute (%): 12.80%
Drove alone (%): 60.20%
Carpooled (%): 9.20%
Worked at home (%): 3.10%
Bicycle and Walk (%): 7.50%
Commute Score: 41.98
40
Miami, FL
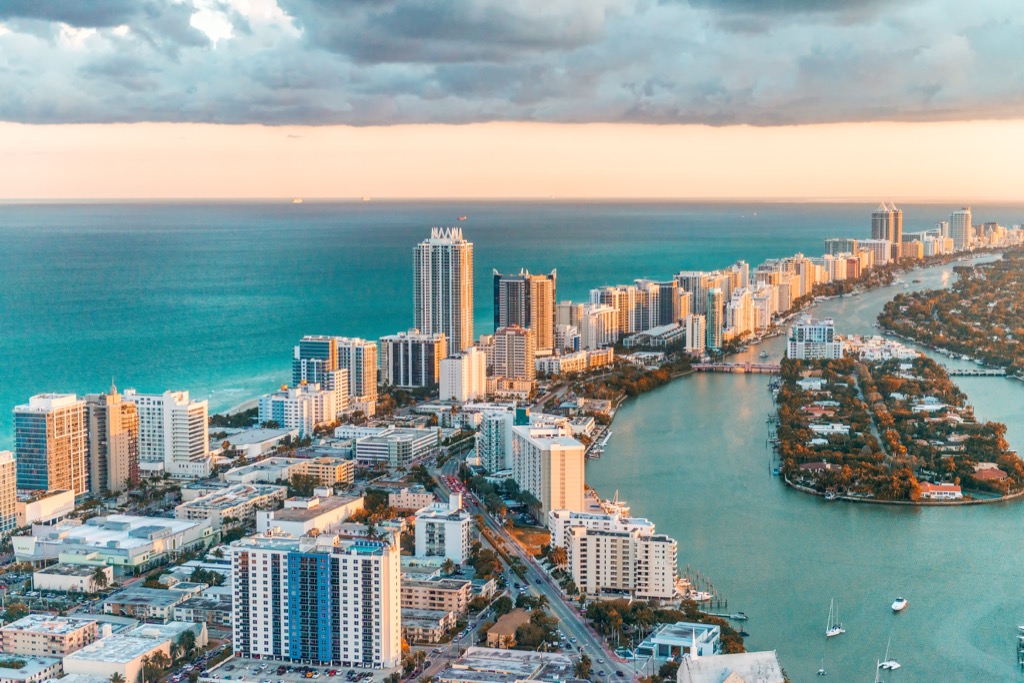
Population: 453,579
3-Year Growth Rate: 7.69%
Mean travel time to work (minutes): 27.00
60 minutes or more commute (%): 7.40%
Drove alone (%): 69.40%
Carpooled (%): 9.10%
Worked at home (%): 3.40%
Bicycle and Walk (%): 5.50%
Commute Score: 42.09
39
Hollywood, FL
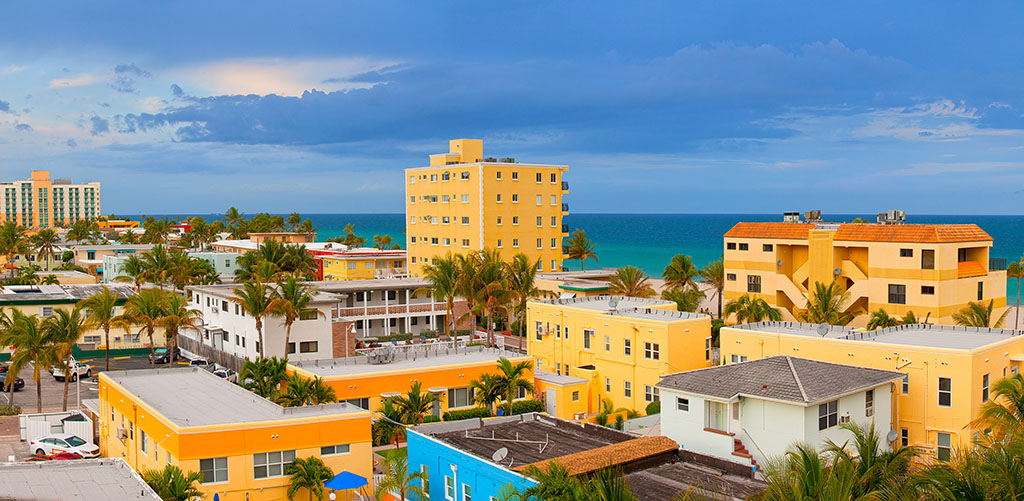
Population: 151,998
3-Year Growth Rate: 3.69%
Mean travel time to work (minutes): 28.50
60 minutes or more commute (%): 10.10%
Drove alone (%): 77.20%
Carpooled (%): 10.50%
Worked at home (%): 4.40%
Bicycle and Walk (%): 3.00%
Commute Score: 42.29
38
Fullerton, CA
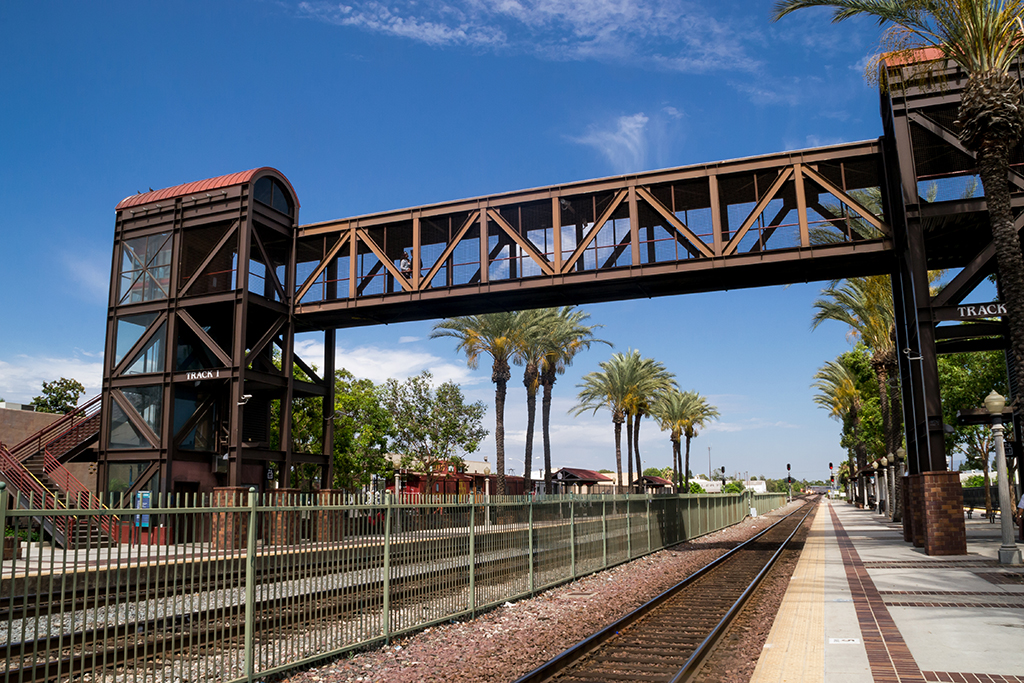
Population: 140,721
3-Year Growth Rate: 1.29%
Mean travel time to work (minutes): 28.90
60 minutes or more commute (%): 12.40%
Drove alone (%): 77.60%
Carpooled (%): 11.10%
Worked at home (%): 3.70%
Bicycle and Walk (%): 4.10%
Commute Score: 42.59
37
Aurora, CO
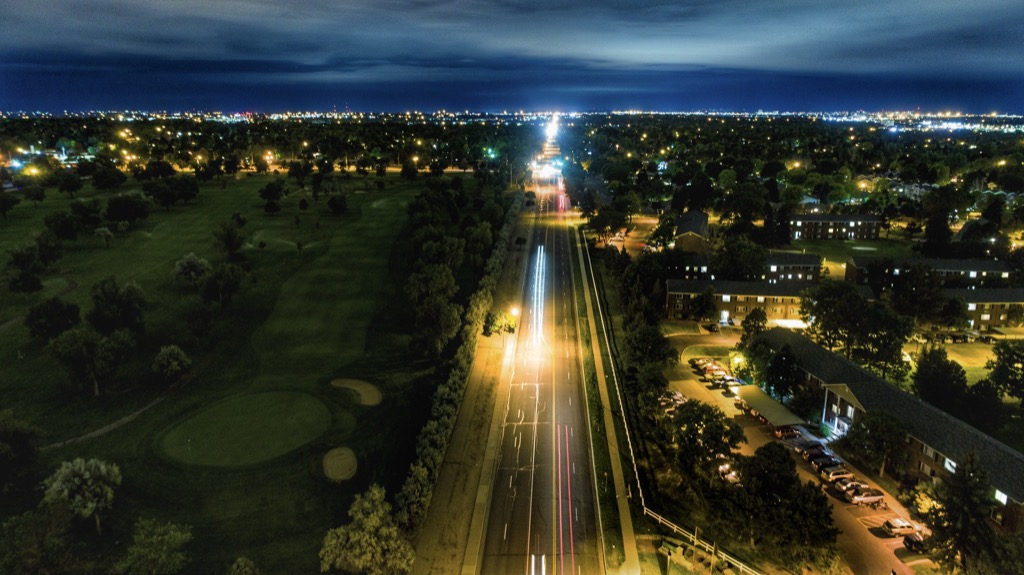
Population: 361,710
3-Year Growth Rate: 4.79%
Mean travel time to work (minutes): 29.10
60 minutes or more commute (%): 8.70%
Drove alone (%): 76.60%
Carpooled (%): 11.10%
Worked at home (%): 3.70%
Bicycle and Walk (%): 1.80%
Commute Score: 42.59
36
Stockton, CA
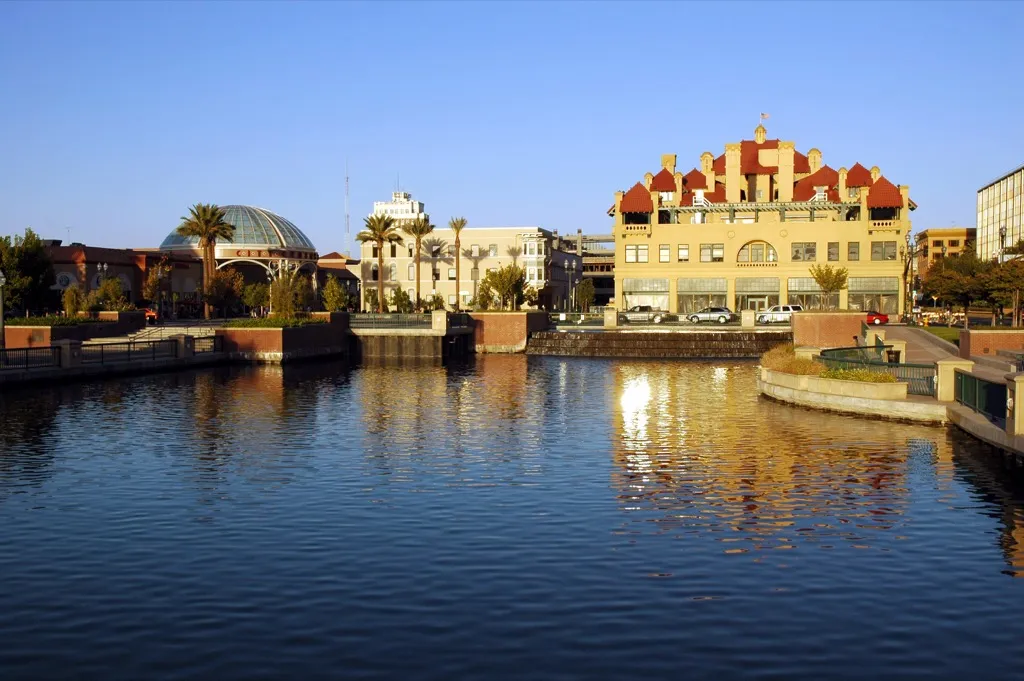
Population: 307,072
3-Year Growth Rate: 3.20%
Mean travel time to work (minutes): 27.20
60 minutes or more commute (%): 12.20%
Drove alone (%): 76.70%
Carpooled (%): 15.90%
Worked at home (%): 2.90%
Bicycle and Walk (%): 1.90%
Commute Score: 42.60
35
Washington D.C.

Population: 681,170
3-Year Growth Rate: 4.93%
Mean travel time to work (minutes): 29.70
60 minutes or more commute (%): 8.70%
Drove alone (%): 33.70%
Carpooled (%): 5.70%
Worked at home (%): 5.00%
Bicycle and Walk (%): 16.90%
Commute Score: 43.33
34
Cape Coral, FL
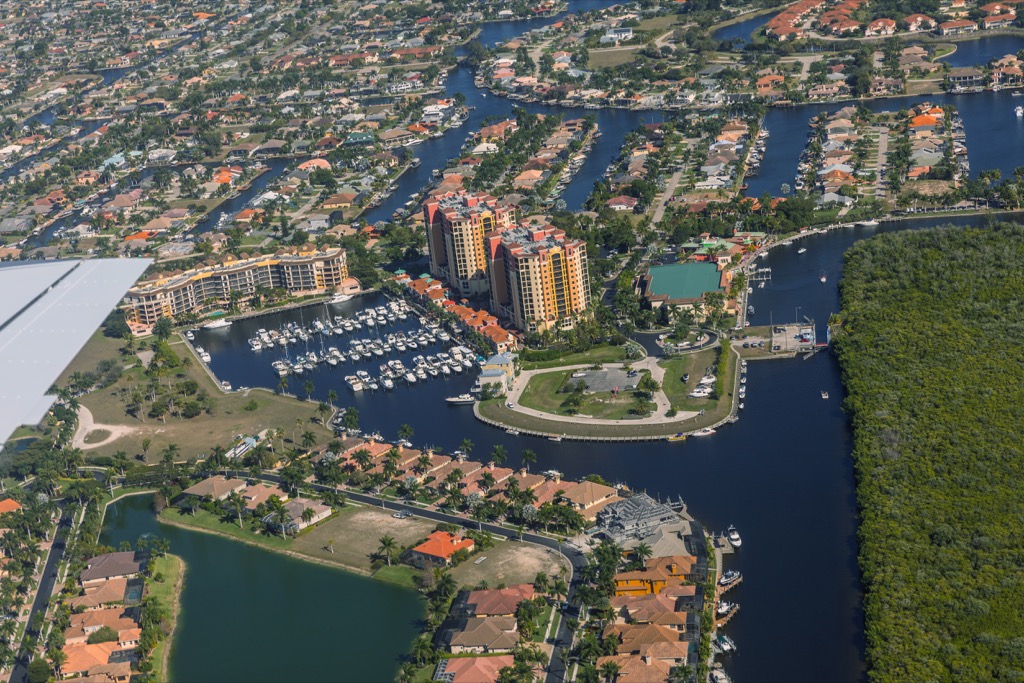
Population: 179,804
3-Year Growth Rate: 8.90%
Mean travel time to work (minutes): 27.90
60 minutes or more commute (%): 6.70%
Drove alone (%): 83.60%
Carpooled (%): 9.00%
Worked at home (%): 4.80%
Bicycle and Walk (%): 0.90%
Commute Score: 43.50
33
Pembroke Pines, FL
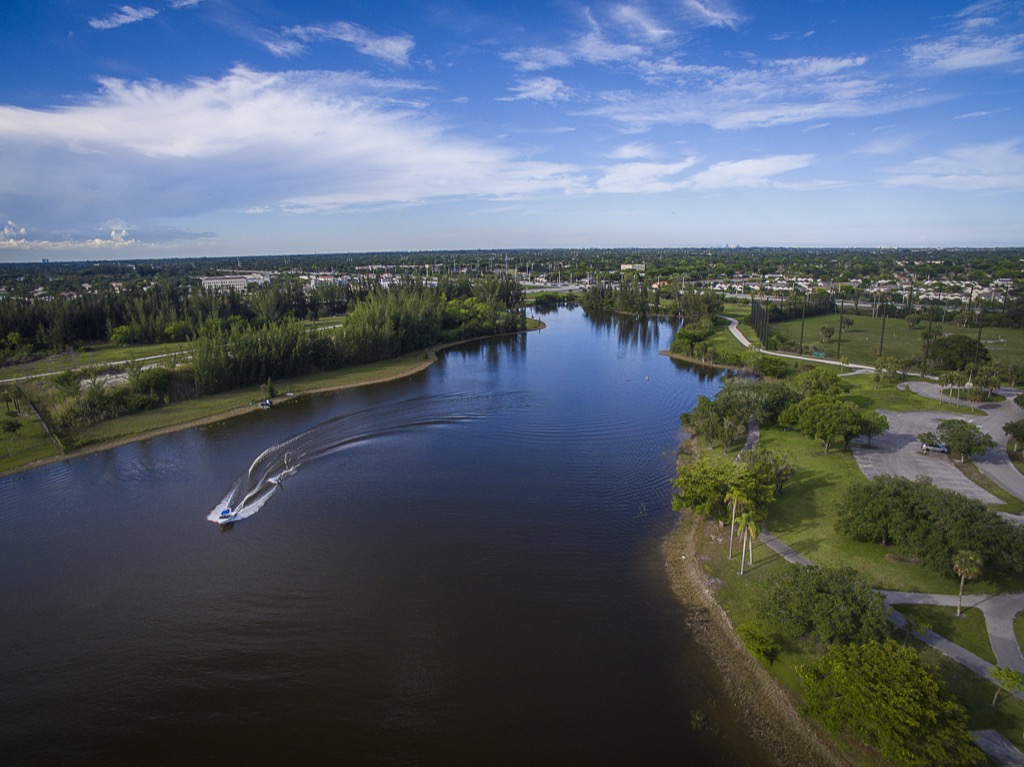
Population: 168,587
3-Year Growth Rate: 3.41%
Mean travel time to work (minutes): 30.60
60 minutes or more commute (%): 9.50%
Drove alone (%): 84.60%
Carpooled (%): 8.10%
Worked at home (%): 4.40%
Bicycle and Walk (%): 0.60%
Commute Score: 43.51
32
Alexandria, VA
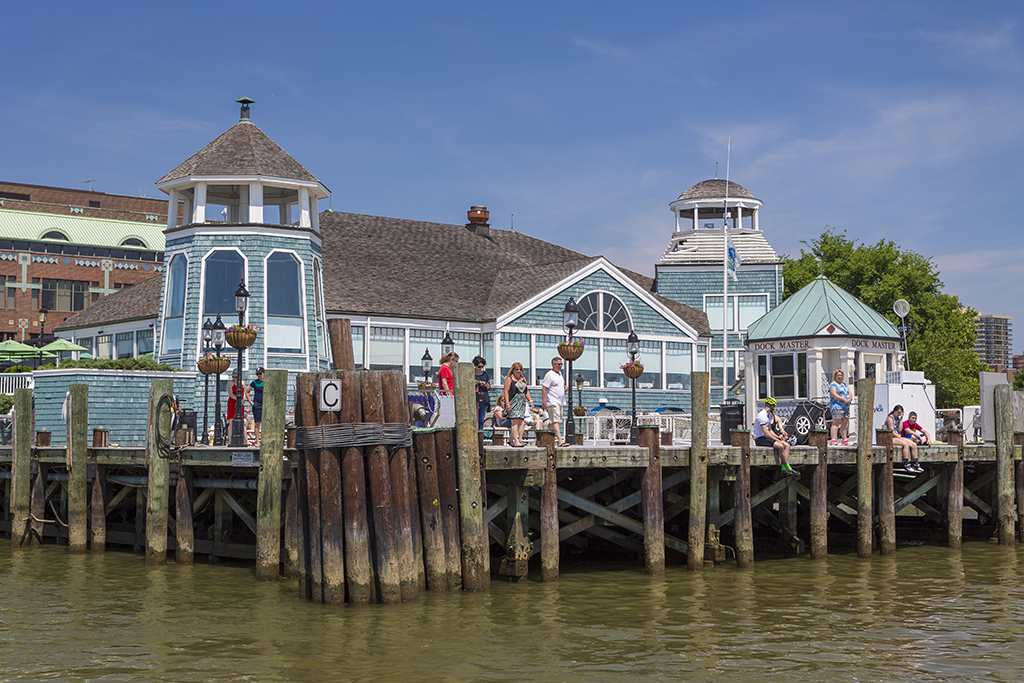
Population: 155,810
3-Year Growth Rate: 4.00%
Mean travel time to work (minutes): 30.80
60 minutes or more commute (%): 9.40%
Drove alone (%): 58.70%
Carpooled (%): 8.50%
Worked at home (%): 5.00%
Bicycle and Walk (%): 4.80%
Commute Score: 44.20
31
Los Angeles, CA
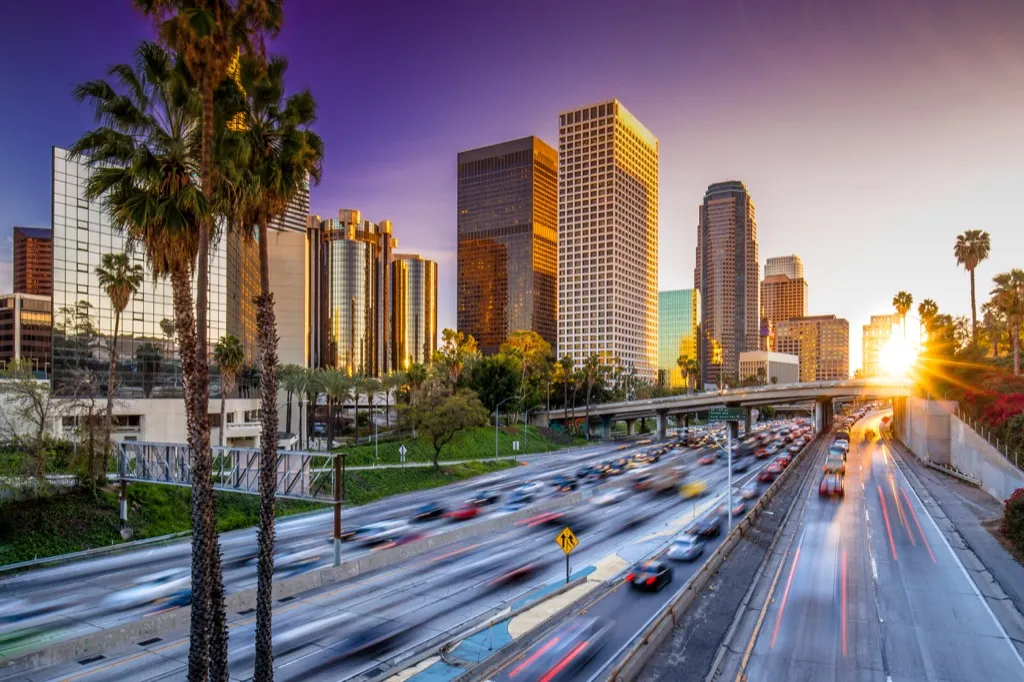
Population: 3,976,322
3-Year Growth Rate: 2.21%
Mean travel time to work (minutes): 30.10
60 minutes or more commute (%): 12.10%
Drove alone (%): 67.90%
Carpooled (%): 9.30%
Worked at home (%): 5.70%
Bicycle and Walk (%): 4.80%
Commute Score: 44.41
30
Thornton, CO
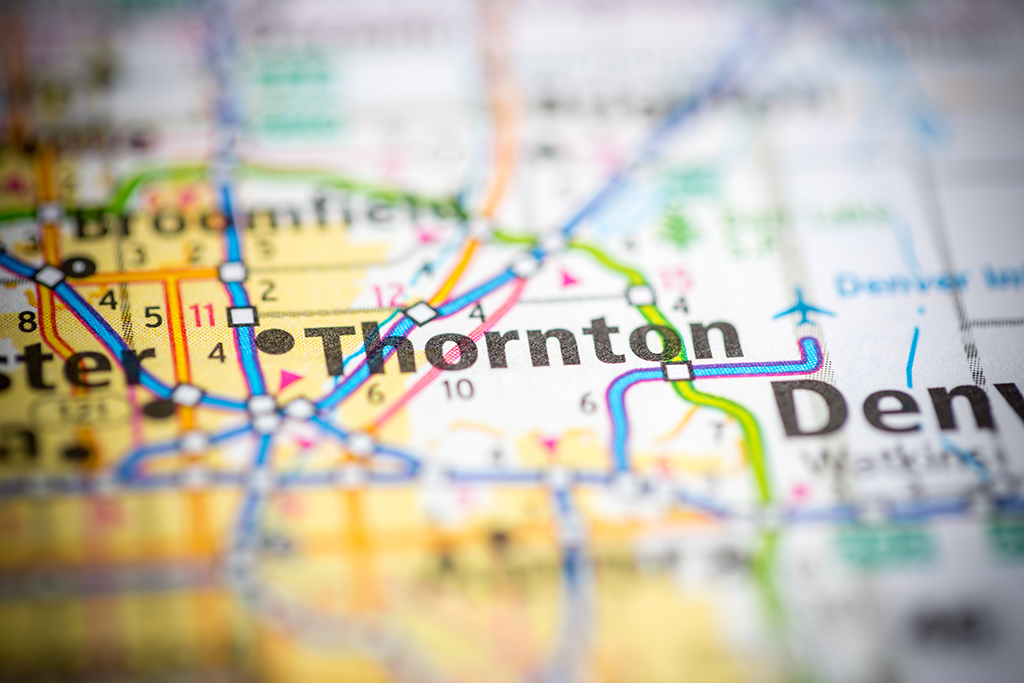
Population: 136,703
3-Year Growth Rate: 7.04%
Mean travel time to work (minutes): 29.70
60 minutes or more commute (%): 7.70%
Drove alone (%): 81.30%
Carpooled (%): 10.50%
Worked at home (%): 4.30%
Bicycle and Walk (%): 0.90%
Commute Score: 44.44
29
Joliet, IL
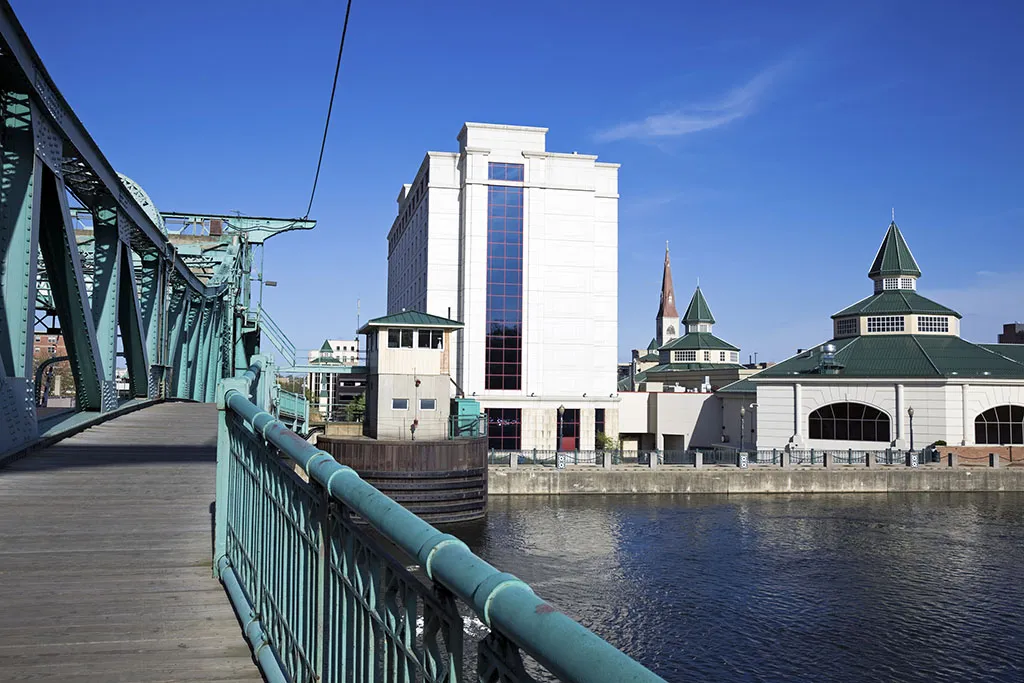
Population: 148,262
3-Year Growth Rate: 0.19%
Mean travel time to work (minutes): 30.30
60 minutes or more commute (%): 14.10%
Drove alone (%): 83.60%
Carpooled (%): 8.50%
Worked at home (%): 2.60%
Bicycle and Walk (%): 1.20%
Commute Score: 44.59
28
Elk Grove, CA

Population: 169,743
3-Year Growth Rate: 5.71%
Mean travel time to work (minutes): 31.10
60 minutes or more commute (%): 8.10%
Drove alone (%): 76.10%
Carpooled (%): 14.00%
Worked at home (%): 5.70%
Bicycle and Walk (%): 1.10%
Commute Score: 44.91
27
Irvine, CA
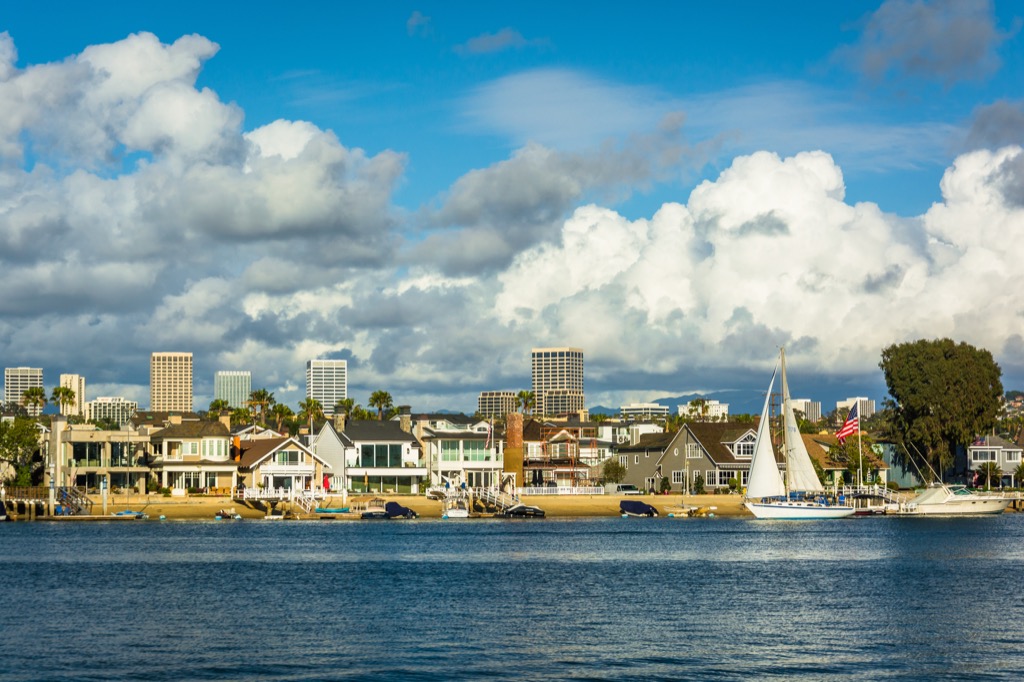
Population: 266,122
3-Year Growth Rate: 12.59%
Mean travel time to work (minutes): 24.50
60 minutes or more commute (%): 8.10%
Drove alone (%): 78.70%
Carpooled (%): 6.80%
Worked at home (%): 7.30%
Bicycle and Walk (%): 5.00%
Commute Score: 45.19
26
Boston, MA

Population: 673,184
3-Year Growth Rate: 3.39%
Mean travel time to work (minutes): 30.10
60 minutes or more commute (%): 11.70%
Drove alone (%): 38.60%
Carpooled (%): 6.10%
Worked at home (%): 3.60%
Bicycle and Walk (%): 16.90%
Commute Score: 45.19
25
Pomona, CA
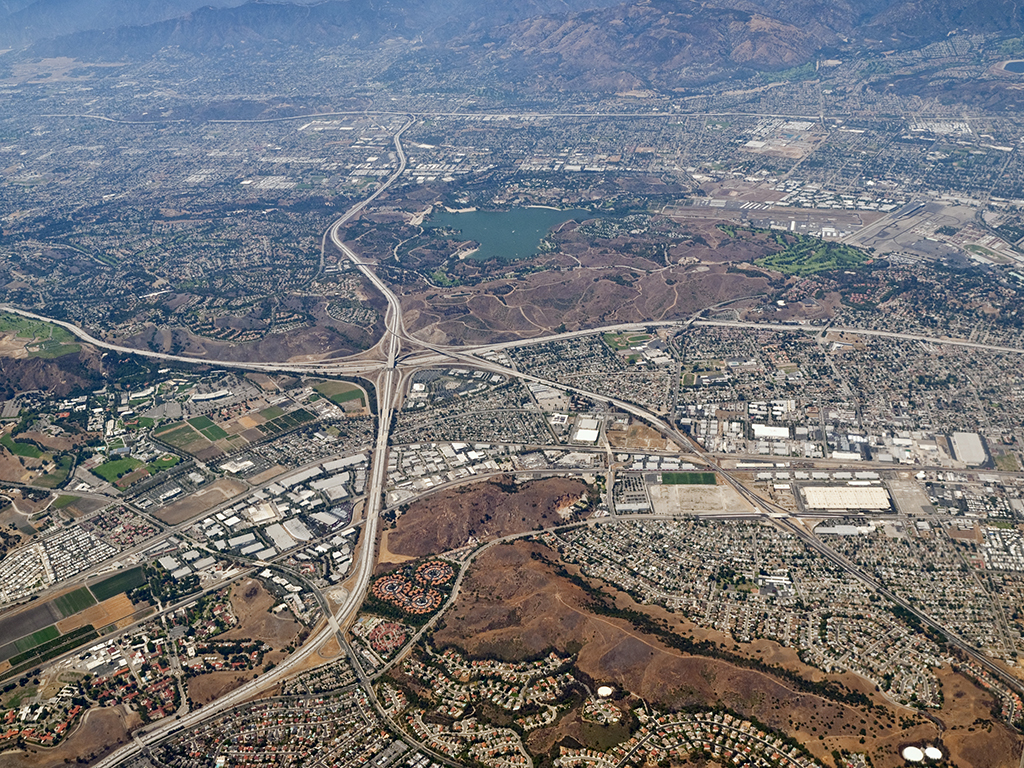
Population: 152,494
3-Year Growth Rate: 0.84%
Mean travel time to work (minutes): 30.10
60 minutes or more commute (%): 14.90%
Drove alone (%): 73.90%
Carpooled (%): 14.10%
Worked at home (%): 3.80%
Bicycle and Walk (%): 3.60%
Commute Score: 45.84
24
Riverside, CA
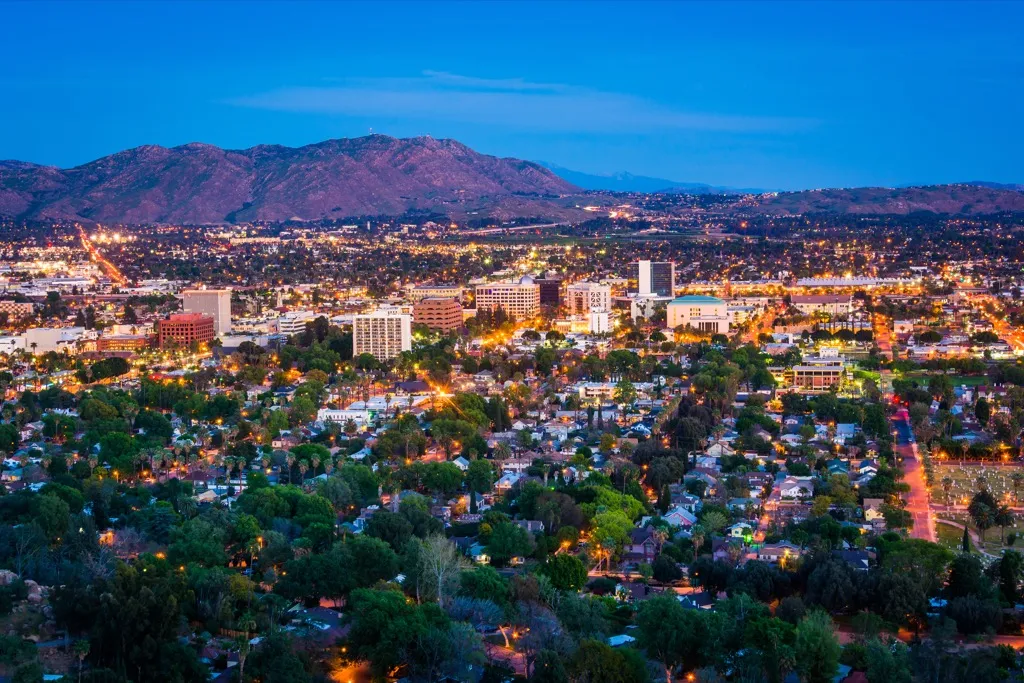
Population: 324,722
3-Year Growth Rate: 2.73%
Mean travel time to work (minutes): 29.40
60 minutes or more commute (%): 13.80%
Drove alone (%): 74.70%
Carpooled (%): 13.80%
Worked at home (%): 4.50%
Bicycle and Walk (%): 3.60%
Commute Score: 45.93
23
Oakland, CA
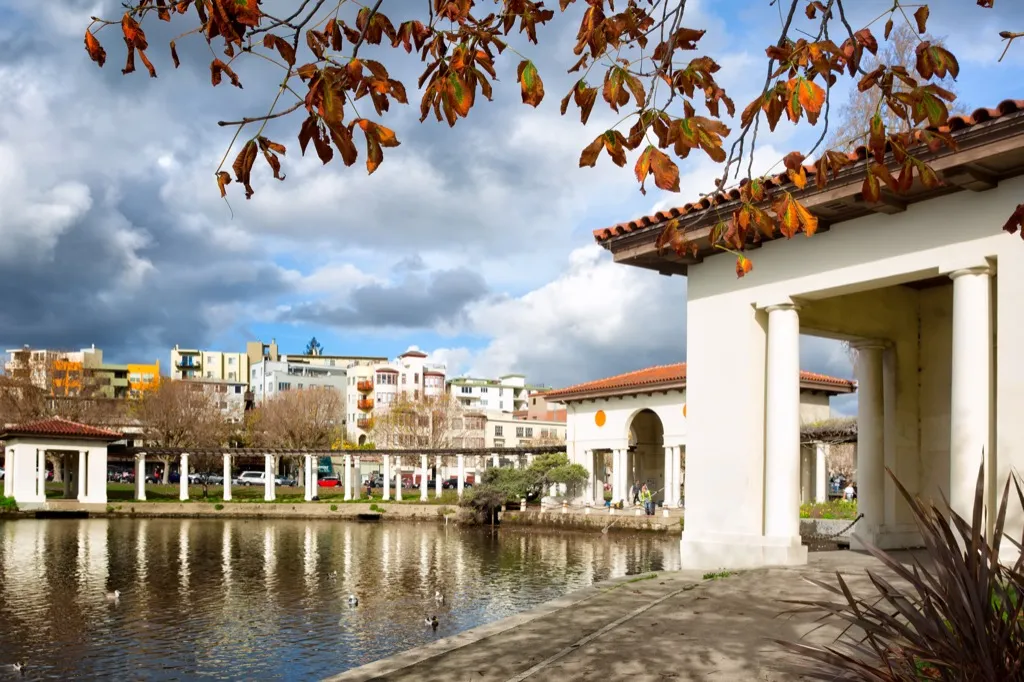
Population: 420,005
3-Year Growth Rate: 3.14%
Mean travel time to work (minutes): 30.30
60 minutes or more commute (%): 12.70%
Drove alone (%): 53.00%
Carpooled (%): 11.10%
Worked at home (%): 6.20%
Bicycle and Walk (%): 7.40%
Commute Score: 46.14
22
Miramar, FL

Population: 138,449
3-Year Growth Rate: 6.30%
Mean travel time to work (minutes): 30.70
60 minutes or more commute (%): 10.00%
Drove alone (%): 84.90%
Carpooled (%): 8.10%
Worked at home (%): 3.20%
Bicycle and Walk (%): 0.60%
Commute Score: 47.00
21
Philadelphia, PA

Population: 1,567,872
3-Year Growth Rate: 0.77%
Mean travel time to work (minutes): 32.50
60 minutes or more commute (%): 13.80%
Drove alone (%): 50.40%
Carpooled (%): 8.60%
Worked at home (%): 3.10%
Bicycle and Walk (%): 10.60%
Commute Score: 47.07
20
Ontario, CA
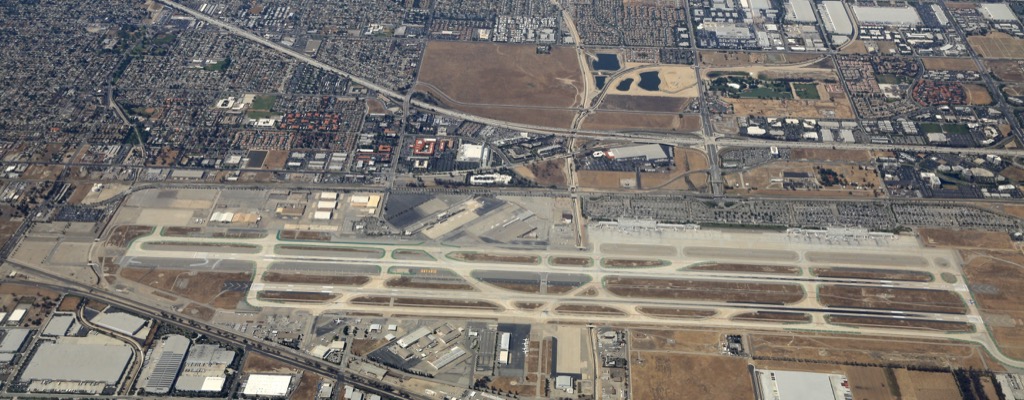
Population: 173,212
3-Year Growth Rate: 3.42%
Mean travel time to work (minutes): 30.20
60 minutes or more commute (%): 14.30%
Drove alone (%): 77.20%
Carpooled (%): 14.70%
Worked at home (%): 2.70%
Bicycle and Walk (%): 2.30%
Commute Score: 47.92
19
Port St. Lucie, FL
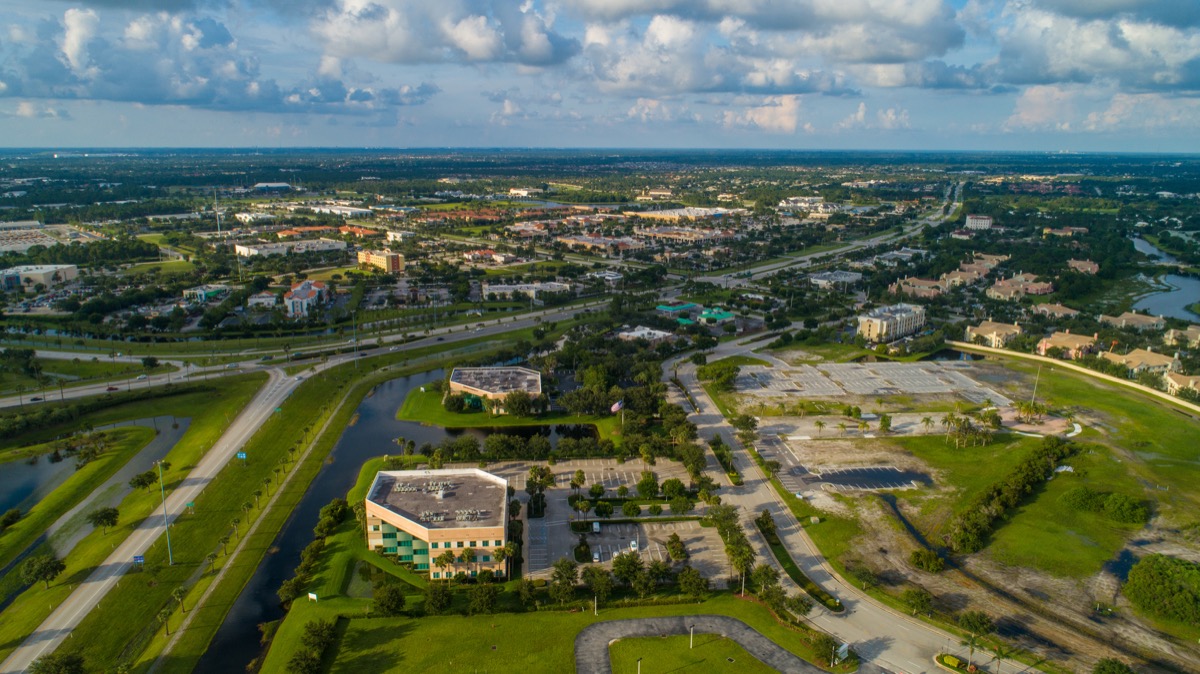
Population: 185,132
3-Year Growth Rate: 8.47%
Mean travel time to work (minutes): 29.50
60 minutes or more commute (%): 10.30%
Drove alone (%): 80.10%
Carpooled (%): 11.40%
Worked at home (%): 6.00%
Bicycle and Walk (%): 0.90%
Commute Score: 48.27
18
San Francisco, CA

Population: 870,887
3-Year Growth Rate: 3.77%
Mean travel time to work (minutes): 31.70
60 minutes or more commute (%): 13.20%
Drove alone (%): 35.90%
Carpooled (%): 7.30%
Worked at home (%): 6.90%
Bicycle and Walk (%): 14.40%
Commute Score: 48.67
17
Fremont, CA
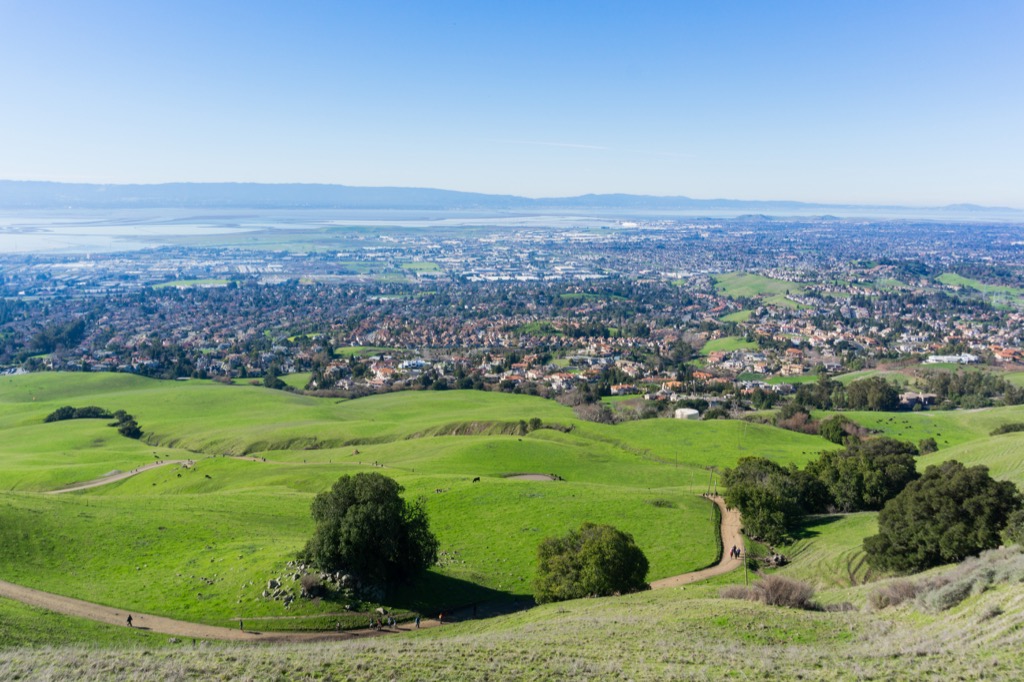
Population: 233,136
3-Year Growth Rate: 3.60%
Mean travel time to work (minutes): 32.00
60 minutes or more commute (%): 13.50%
Drove alone (%): 73.30%
Carpooled (%): 10.30%
Worked at home (%): 4.60%
Bicycle and Walk (%): 1.90%
Commute Score: 49.10
16
Hayward, CA
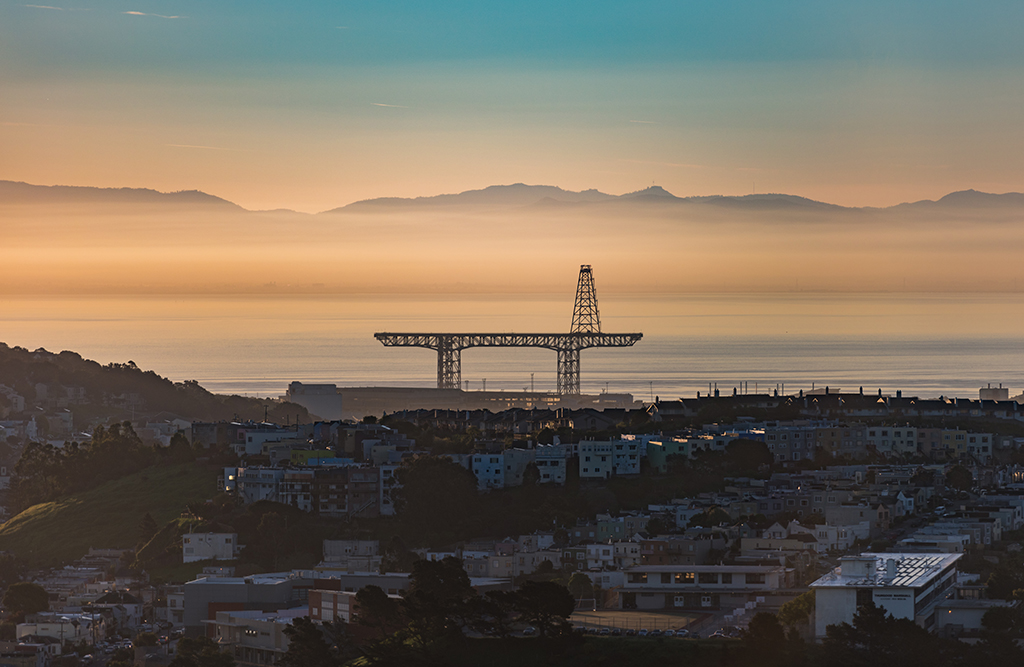
Population: 158,937
3-Year Growth Rate: 4.67%
Mean travel time to work (minutes): 30.90
60 minutes or more commute (%): 13.80%
Drove alone (%): 72.10%
Carpooled (%): 11.90%
Worked at home (%): 2.90%
Bicycle and Walk (%): 2.50%
Commute Score: 49.37
15
Chicago, IL
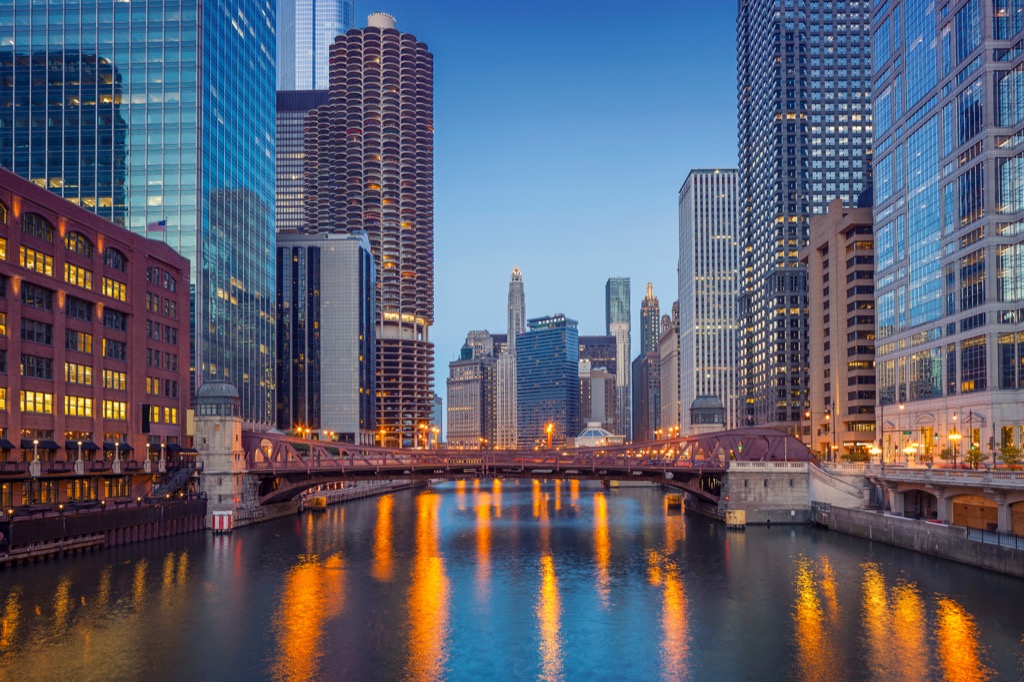
Population: 2,704,958
3-Year Growth Rate: -0.51%
Mean travel time to work (minutes): 34.10
60 minutes or more commute (%): 16.00%
Drove alone (%): 49.70%
Carpooled (%): 8.50%
Worked at home (%): 4.40%
Bicycle and Walk (%): 8.20%
Commute Score: 49.59
14
Rancho Cucamonga, CA
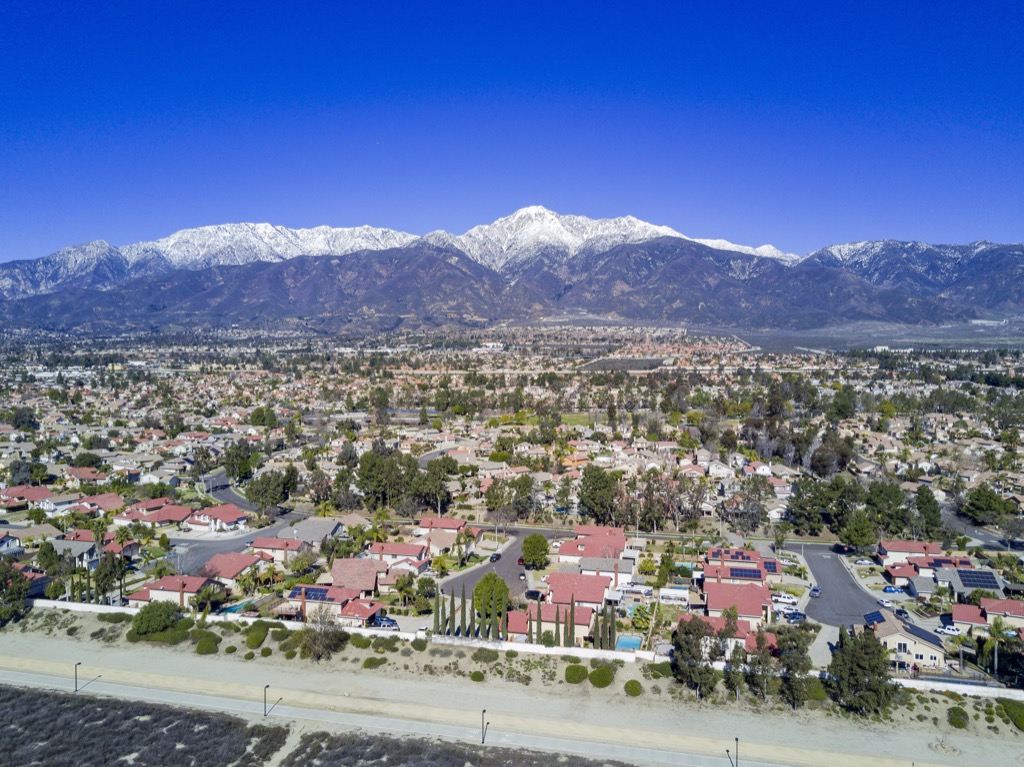
Population: 176,534
3-Year Growth Rate: 3.11%
Mean travel time to work (minutes): 31.50
60 minutes or more commute (%): 15.50%
Drove alone (%): 78.90%
Carpooled (%): 13.20%
Worked at home (%): 4.20%
Bicycle and Walk (%): 1.10%
Commute Score: 50.11
13
Lancaster, CA
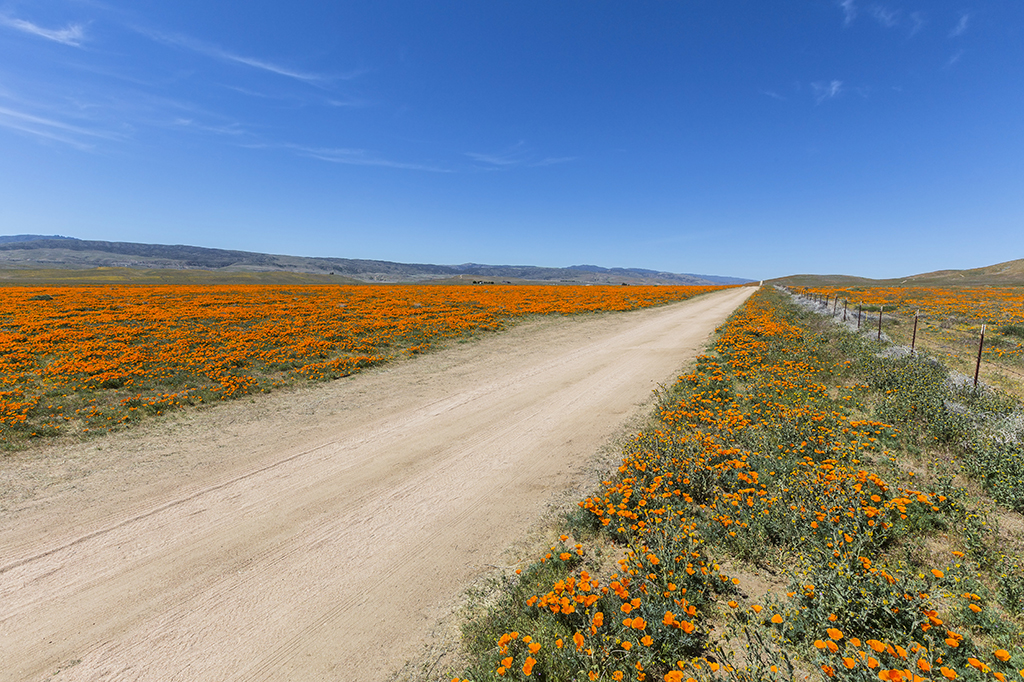
Population: 160,106
3-Year Growth Rate: 0.44%
Mean travel time to work (minutes): 31.10
60 minutes or more commute (%): 20.00%
Drove alone (%): 84.40%
Carpooled (%): 9.20%
Worked at home (%): 2.90%
Bicycle and Walk (%): 1.50%
Commute Score: 51.54
12
Santa Clarita, CA
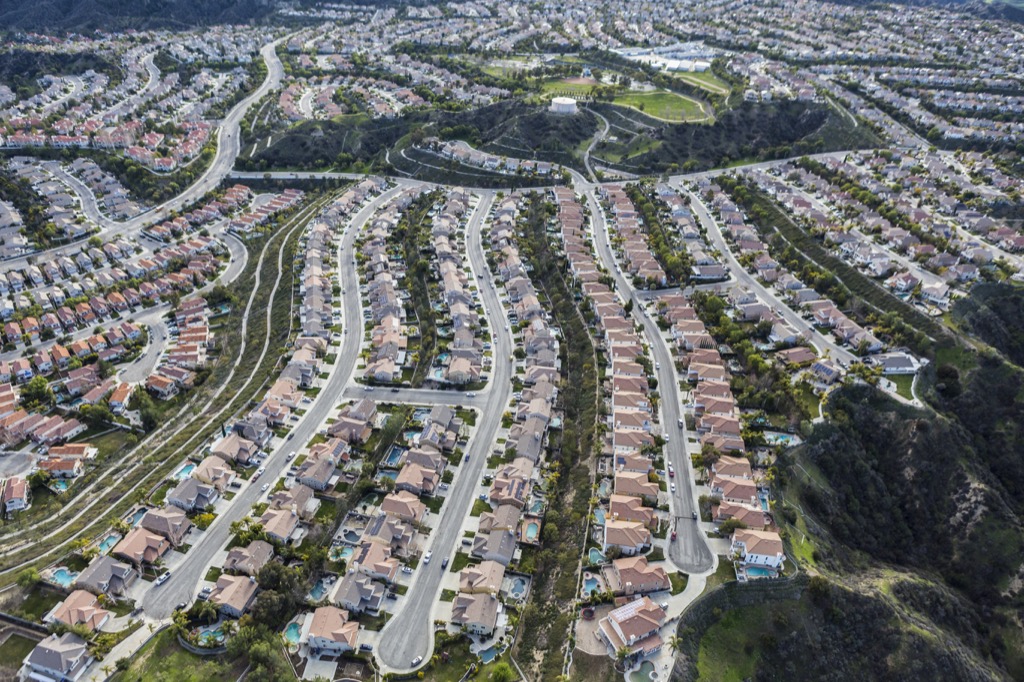
Population: 181,972
3-Year Growth Rate: 1.49%
Mean travel time to work (minutes): 32.60
60 minutes or more commute (%): 17.60%
Drove alone (%): 76.50%
Carpooled (%): 12.00%
Worked at home (%): 5.70%
Bicycle and Walk (%): 1.90%
Commute Score: 51.69
11
Moreno Valley, CA

Population: 205,499
3-Year Growth Rate: 2.45%
Mean travel time to work (minutes): 33.50
60 minutes or more commute (%): 16.90%
Drove alone (%): 77.90%
Carpooled (%): 14.20%
Worked at home (%): 3.10%
Bicycle and Walk (%): 1.10%
Commute Score: 52.85
10
Yonkers, NY
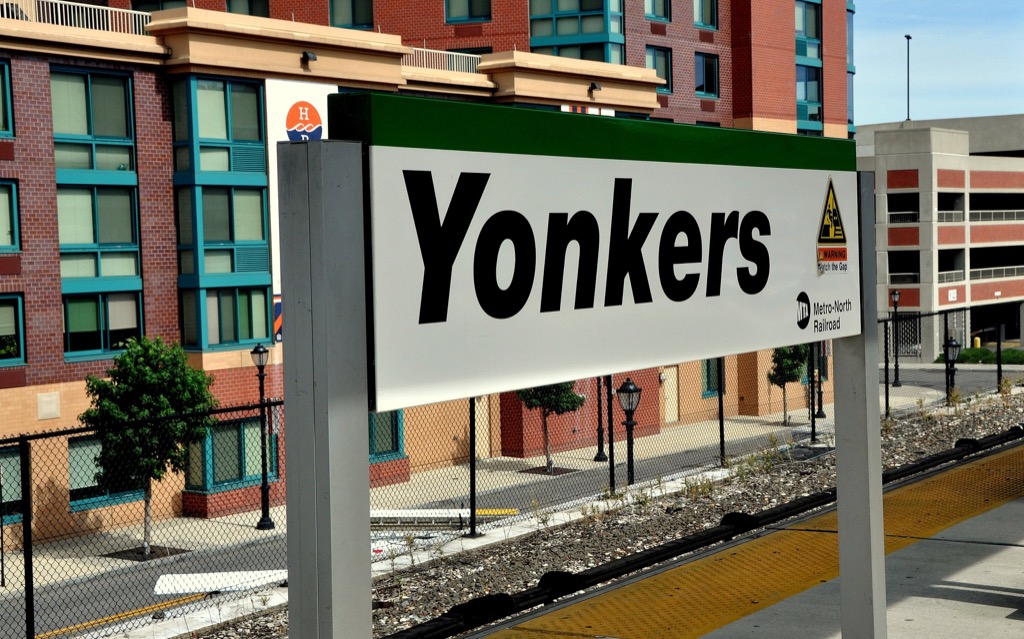
Population: 200,807
3-Year Growth Rate: 0.77%
Mean travel time to work (minutes): 33.20
60 minutes or more commute (%): 19.10%
Drove alone (%): 55.80%
Carpooled (%): 9.30%
Worked at home (%): 2.40%
Bicycle and Walk (%): 5.20%
Commute Score: 53.07
9
Fontana, CA
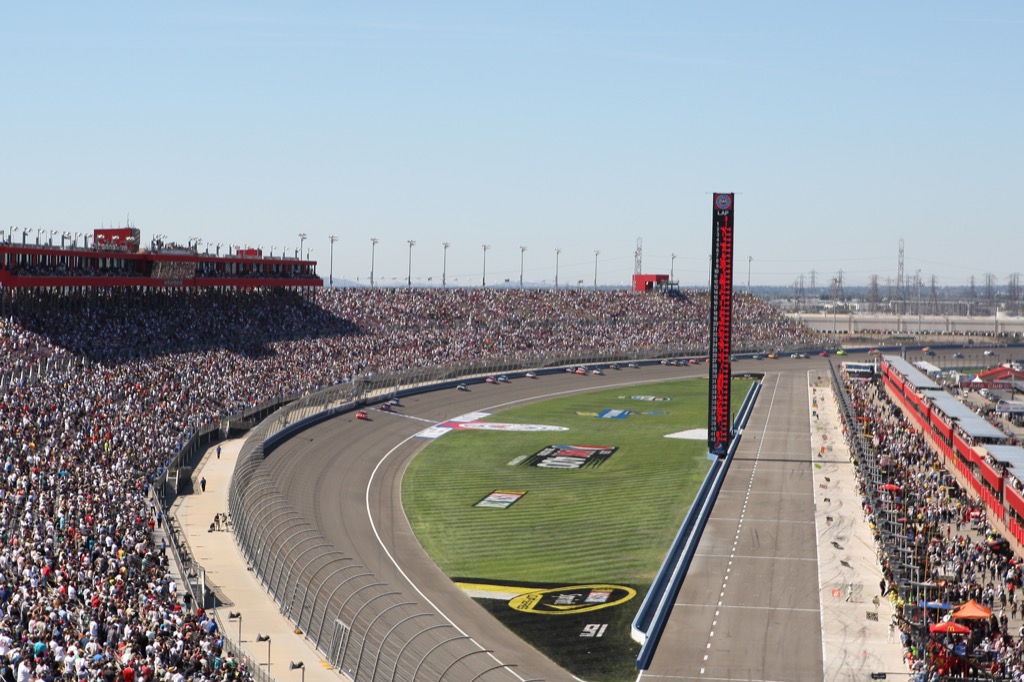
Population: 209,665
3-Year Growth Rate: 3.18%
Mean travel time to work (minutes): 32.70
60 minutes or more commute (%): 17.60%
Drove alone (%): 78.80%
Carpooled (%): 13.90%
Worked at home (%): 3.60%
Bicycle and Walk (%): 0.90%
Commute Score: 53.48
8
Naperville, IL
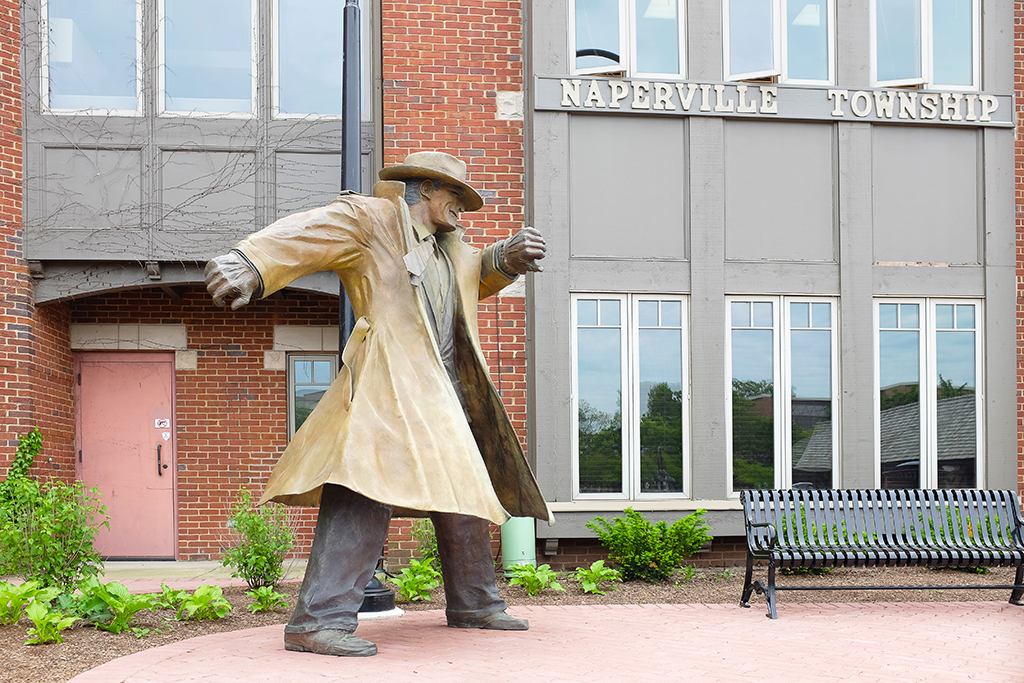
Population: 147,122
3-Year Growth Rate: 1.62%
Mean travel time to work (minutes): 33.60
60 minutes or more commute (%): 18.90%
Drove alone (%): 75.20%
Carpooled (%): 4.40%
Worked at home (%): 8.10%
Bicycle and Walk (%): 1.80%
Commute Score: 54.12
7
McKinney, TX
Population: 172,298
3-Year Growth Rate: 15.62%
Mean travel time to work (minutes): 29.10
60 minutes or more commute (%): 10.00%
Drove alone (%): 81.90%
Carpooled (%): 6.80%
Worked at home (%): 8.10%
Bicycle and Walk (%): 0.80%
Commute Score: 54.72
6
Newark, NJ
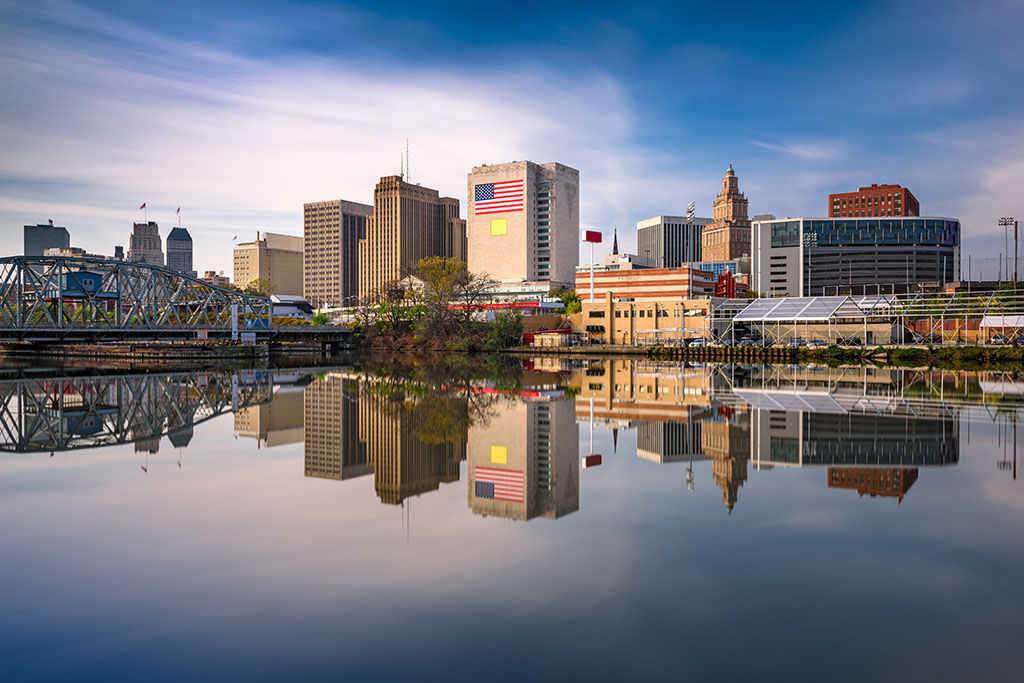
Population: 281,764
3-Year Growth Rate: 0.94%
Mean travel time to work (minutes): 34.40
60 minutes or more commute (%): 19.60%
Drove alone (%): 47.90%
Carpooled (%): 13.20%
Worked at home (%): 1.60%
Bicycle and Walk (%): 9.20%
Commute Score: 54.94
5
Jersey City, NJ

Population: 264,152
3-Year Growth Rate: 1.61%
Mean travel time to work (minutes): 36.20
60 minutes or more commute (%): 18.00%
Drove alone (%): 32.40%
Carpooled (%): 7.10%
Worked at home (%): 3.40%
Bicycle and Walk (%): 8.40%
Commute Score: 55.81
4
Frisco, TX
Population: 163,656
3-Year Growth Rate: 19.57%
Mean travel time to work (minutes): 29.40
60 minutes or more commute (%): 8.60%
Drove alone (%): 80.50%
Carpooled (%): 7.20%
Worked at home (%): 10.20%
Bicycle and Walk (%): 0.80%
Commute Score: 57.57
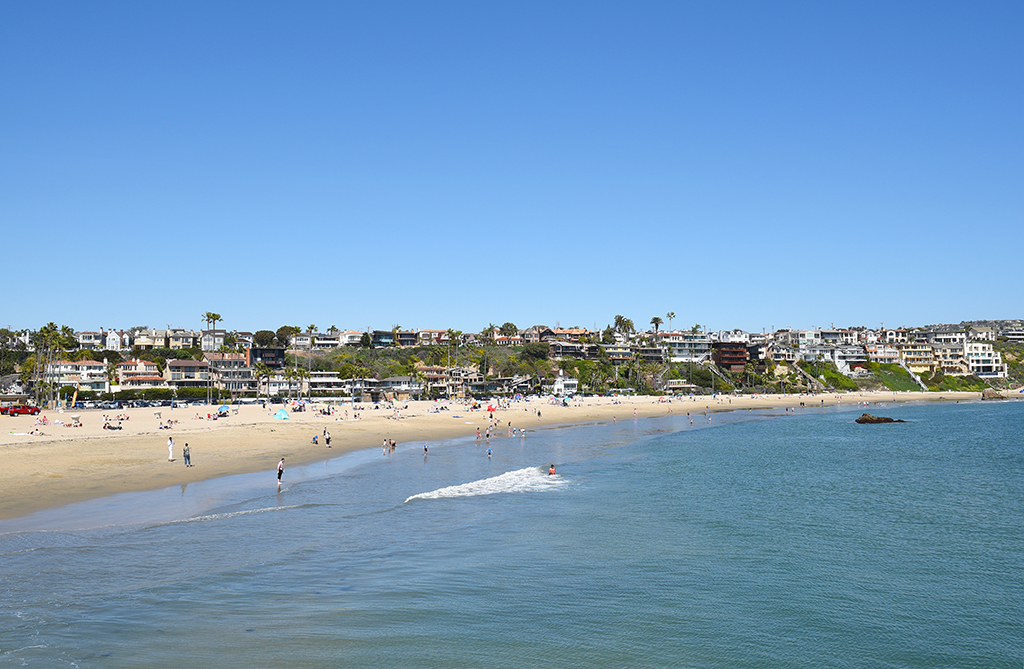
3
Corona, CA
Population: 166,785
3-Year Growth Rate: 4.81%
Mean travel time to work (minutes): 35.70
60 minutes or more commute (%): 21.70%
Drove alone (%): 76.70%
Carpooled (%): 13.40%
Worked at home (%): 6.00%
Bicycle and Walk (%): 1.30%
Commute Score: 62.21
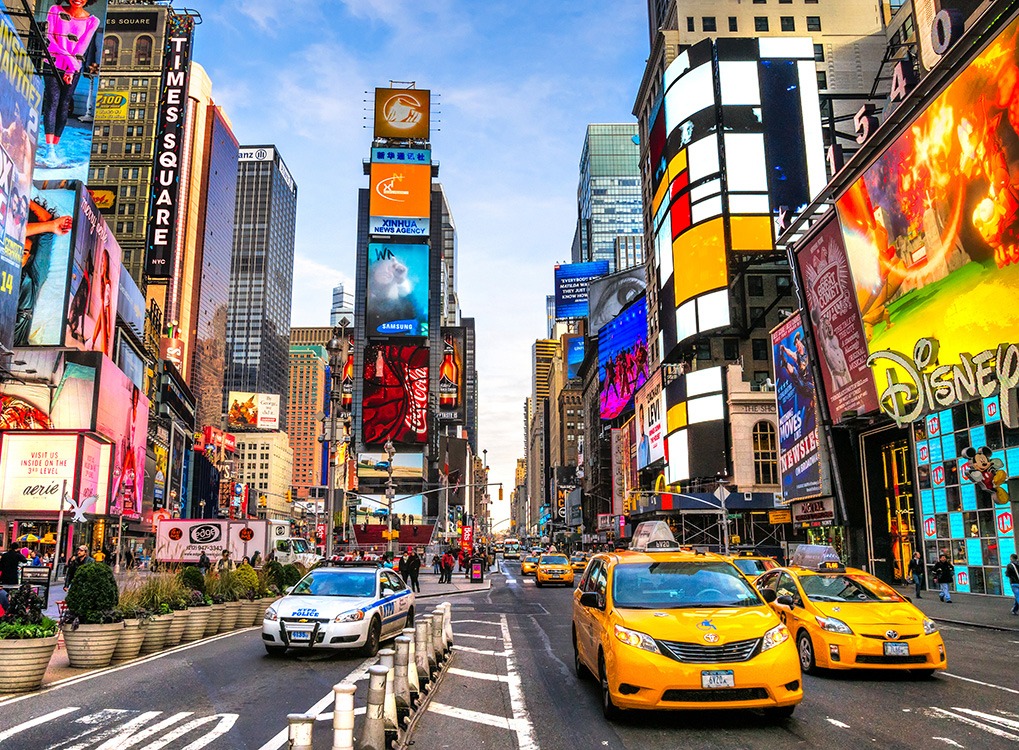
2
New York, NY
Population: 8,537,673
3-Year Growth Rate: 1.37%
Mean travel time to work (minutes): 39.90
60 minutes or more commute (%): 25.00%
Drove alone (%): 22.00%
Carpooled (%): 4.60%
Worked at home (%): 4.00%
Bicycle and Walk (%): 11.20%
Commute Score: 66.27
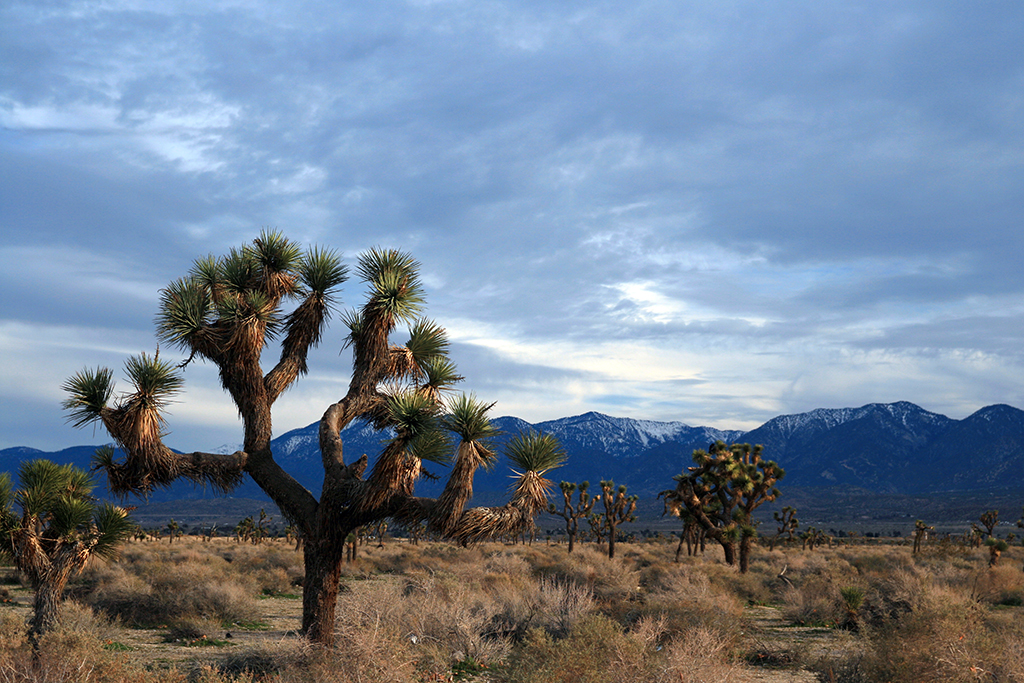
1
Palmdale, CA
Population: 157,356
3-Year Growth Rate: 0.30%
Mean travel time to work (minutes): 40.70
60 minutes or more commute (%): 31.80%
Drove alone (%): 74.50%
Carpooled (%): 17.10%
Worked at home (%): 4.30%
Bicycle and Walk (%): 1.10%
Commute Score: 72.80
If commuting is really getting you down and you’ve decided it’s time for a positive change, check out our list of The 100 Happiest Cities in America.
For more amazing advice for living smarter, looking better, and feeling younger, follow us on Facebook now!