This Is the Worst State to Live in Right Now

You don’t need us to tell you that 2020 is arguably one of the worst years we’ll ever live through. Between the coronavirus taking more than 221,000 lives nationwide, the wildfires ravaging much of the West, and the social upheaval happening in most parts of the country, this year has undoubtedly been difficult. But while 2020 has certainly been awful to most of us, things aren’t equally terrible in every corner of the U.S. When looking at economic, environmental, and physical well-being, it’s clear some states have it worse than others. With this in mind, we sought to figure out which state specifically is the worst to live in right now, based solely on scientific data. Read on to find out how we calculated the numbers, and for another state that got a bad name, check out The Most Hated State in America.
To determine the Worst State Index scores, we looked at data that captured the unpleasantness of a state, including its poverty rate, according to U.S. Census Bureau data, and its most recent unemployment rate, according to the Bureau of Labor Statistics. In addition to those economic indicators, we accounted for factors that affect residents’ health, including air pollution (measured by the amount of carbon dioxide emissions, according to the U.S. Energy Information Administration), and, of course, we can’t talk about medical issues in 2020 without factoring in the prevalence of COVID-19 in each state. Specifically, we looked at the seven-day average percent of positive tests performed, according to Johns Hopkins’ Coronavirus Research Center. To wrap it all up, we added in each state’s average life expectancy, based on data from the National Vital Statistics System. Then, we used our exclusive algorithm to calculate all 50 Worst State Index scores.
Taking these numbers into consideration, one state stood out as extraordinarily unpleasant. While there is plenty to love about this state, it’s also a top scorer in the wrong ways: It has a high poverty rate, a shorter average life expectancy, and its COVID numbers are trending in the wrong direction. But what really puts this state at the bottom of the barrel is its astonishing output of poison into the air. Producing 707 million metric tons of carbon dioxide, it’s a particularly toxic place to live in.
Most of the worst states to live in right now are in the South or Midwest, though a Western one did climb—or fall—into the ranks of the 10 baddest of the bad. To see where your state lands, read the full ranking from the best state to live in right now to the worst. And for the states struggling the most with the virus at the moment, find out How Bad the COVID Outbreak Is in Your State.
50
Vermont

Life expectancy: 80 years old
Poverty rate: 9 percent
COVID test positivity rate: 1.5 percent
Unemployment rate: 4.8 percent
Carbon dioxide emissions per year: 6 million metric tons
Worst State Index score: 50.85
And for more areas you may want to avoid, find out which is The Dirtiest State in the U.S.
49
New Hampshire
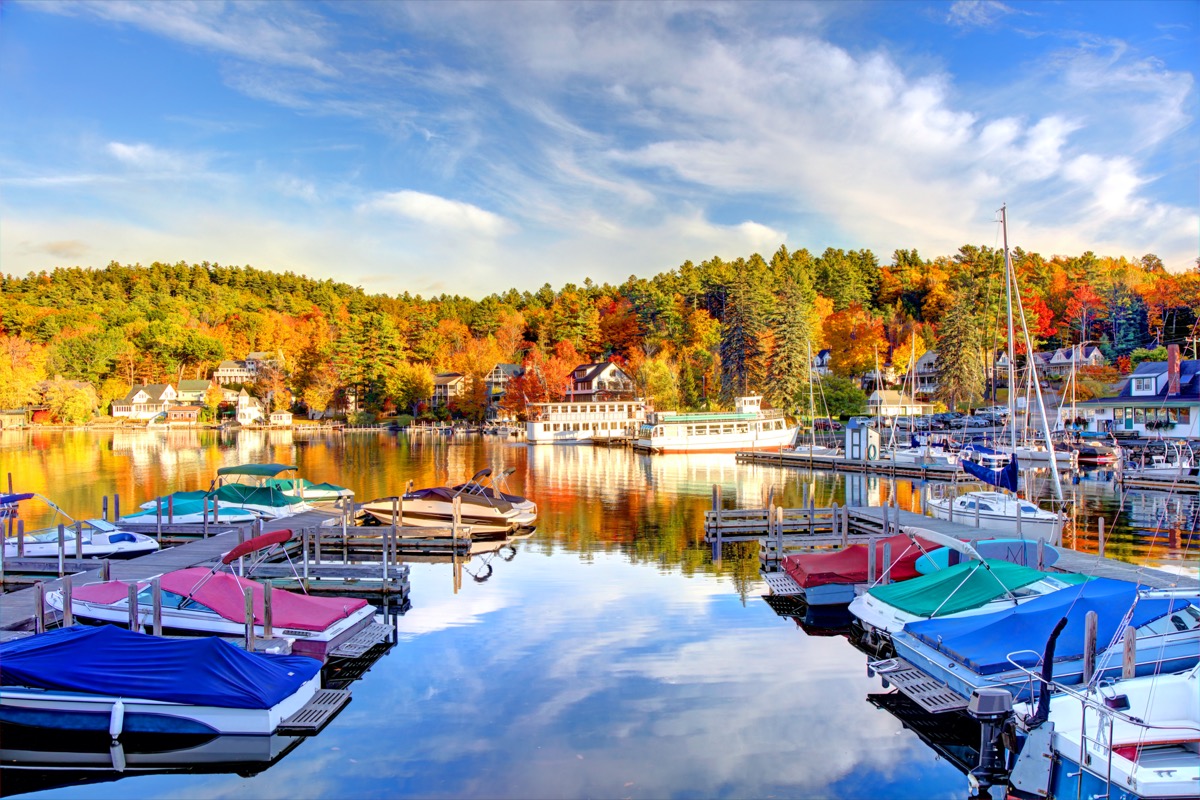
Life expectancy: 80.1 years old
Poverty rate: 5.6 percent
COVID test positivity rate: 1.5 percent
Unemployment rate: 6.5 percent
Carbon dioxide emissions per year: 13 million metric tons
Worst State Index score: 51.53
48
Connecticut

Life expectancy: 80.9 years old
Poverty rate: 9.7 percent
COVID test positivity rate: 1.4 percent
Unemployment rate: 8.1 percent
Carbon dioxide emissions per year: 33 million metric tons
Worst State Index score: 59.63
And for the state that’s least likely to give you a wave, here’s The Unfriendliest State in the U.S.
47
Maine

Life expectancy: 78.7 years old
Poverty rate: 11.5 percent
COVID test positivity rate: 0.5 percent
Unemployment rate: 6.9 percent
Carbon dioxide emissions per year: 15 million metric tons
Worst State Index score: 60.28
46
Maryland

Life expectancy: 79.6 years old
Poverty rate: 7.5 percent
COVID test positivity rate: 5.8 percent
Unemployment rate: 6.9 percent
Carbon dioxide emissions per year: 52 million metric tons
Worst State Index score: 64.40
45
Delaware

Life expectancy: 78.7 years old
Poverty rate: 7.6 percent
COVID test positivity rate: 5.7 percent
Unemployment rate: 8.9 percent
Carbon dioxide emissions per year: 12 million metric tons
Worst State Index score: 65.20
And for the state lacking a little fun, meet The Most Boring State in the U.S.
44
North Dakota

Life expectancy: 79.7 years old
Poverty rate: 10.1 percent
COVID test positivity rate: 7.6 percent
Unemployment rate: 5 percent
Carbon dioxide emissions per year: 56 million metric tons
Worst State Index score: 65.30
43
Hawaii

Life expectancy: 82 years old
Poverty rate: 9.4 percent
COVID test positivity rate: 2.8 percent
Unemployment rate: 12.5 percent
Carbon dioxide emissions per year: 18 million metric tons
Worst State Index score: 65.45
And for more on the first data point, Here’s How Long You’re Likely to Live in Every State.
42
Minnesota

Life expectancy: 81 years old
Poverty rate: 7.4 percent
COVID test positivity rate: 4.7 percent
Unemployment rate: 7.4 percent
Carbon dioxide emissions per year: 88 million metric tons
Worst State Index score: 65.90
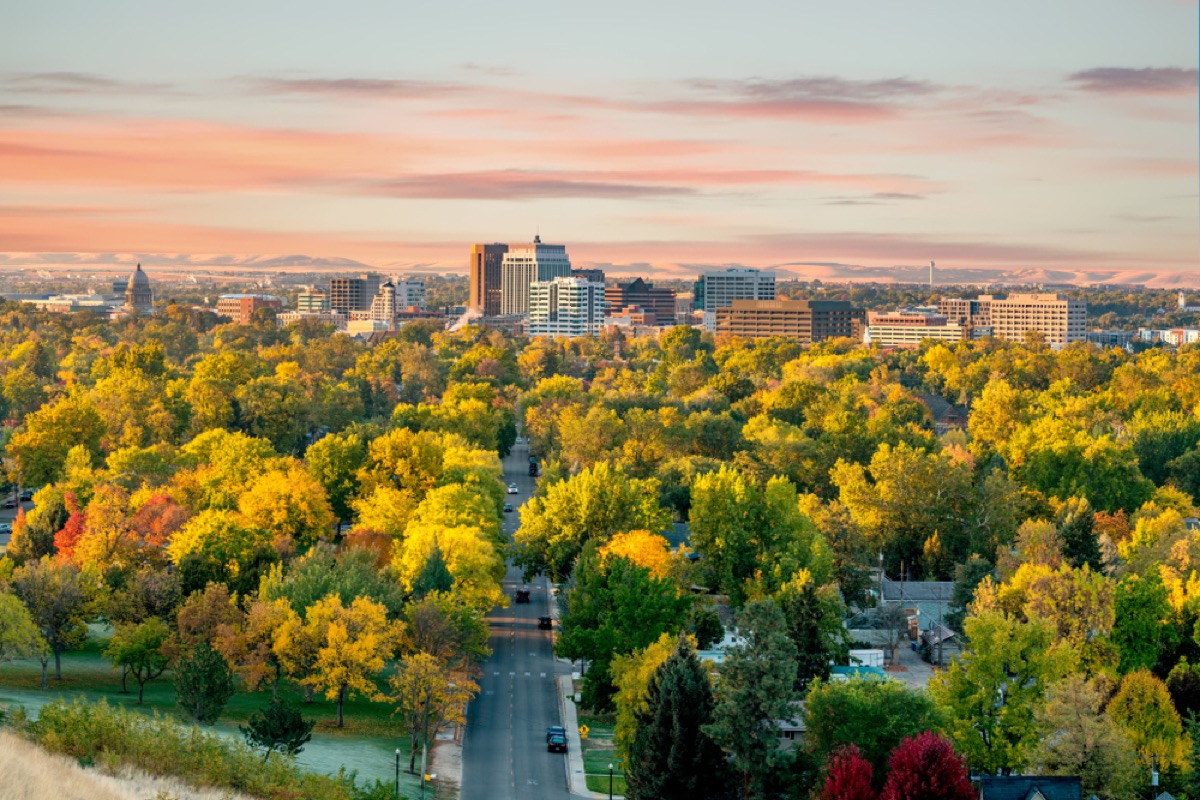
41
Colorado
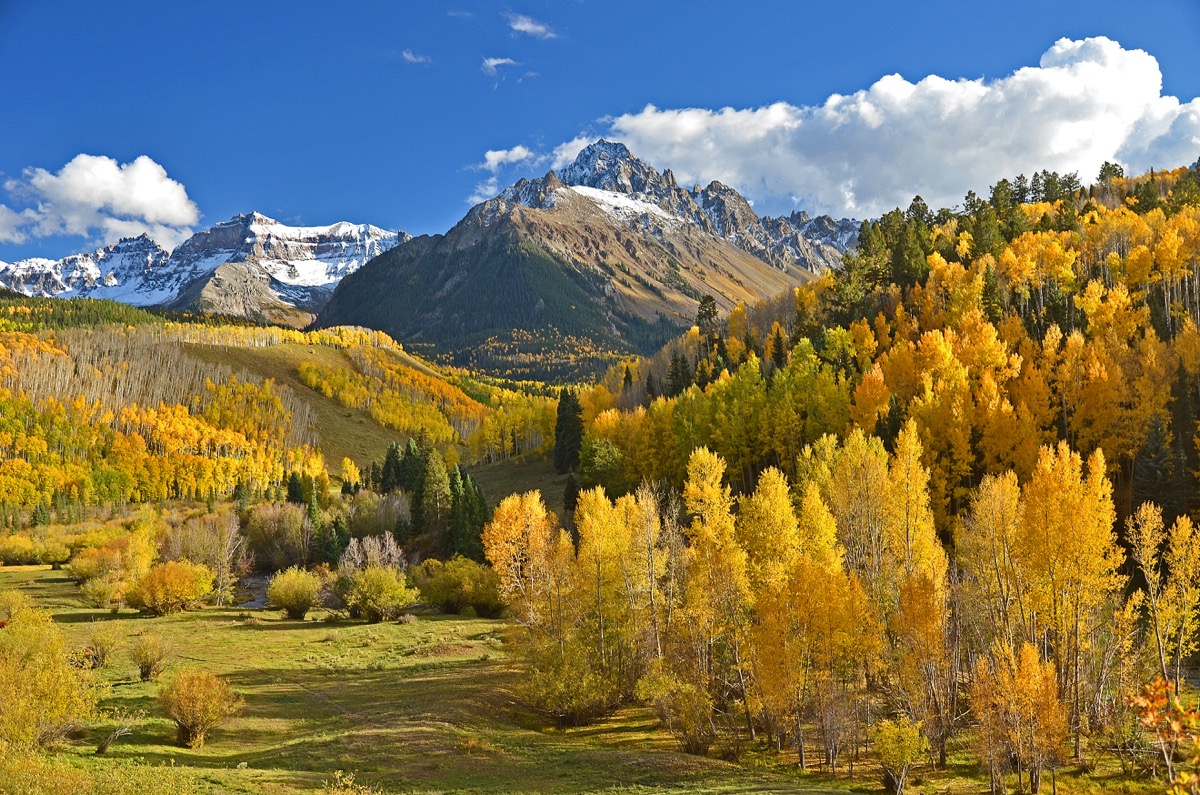
Life expectancy: 80.5 years old
Poverty rate: 9.1 percent
COVID test positivity rate: 3.9 percent
Unemployment rate: 6.7 percent
Carbon dioxide emissions per year: 87 million metric tons
Worst State Index score: 66.28
Want more state facts delivered right to your inbox? Sign up for our daily newsletter!
40
Nebraska
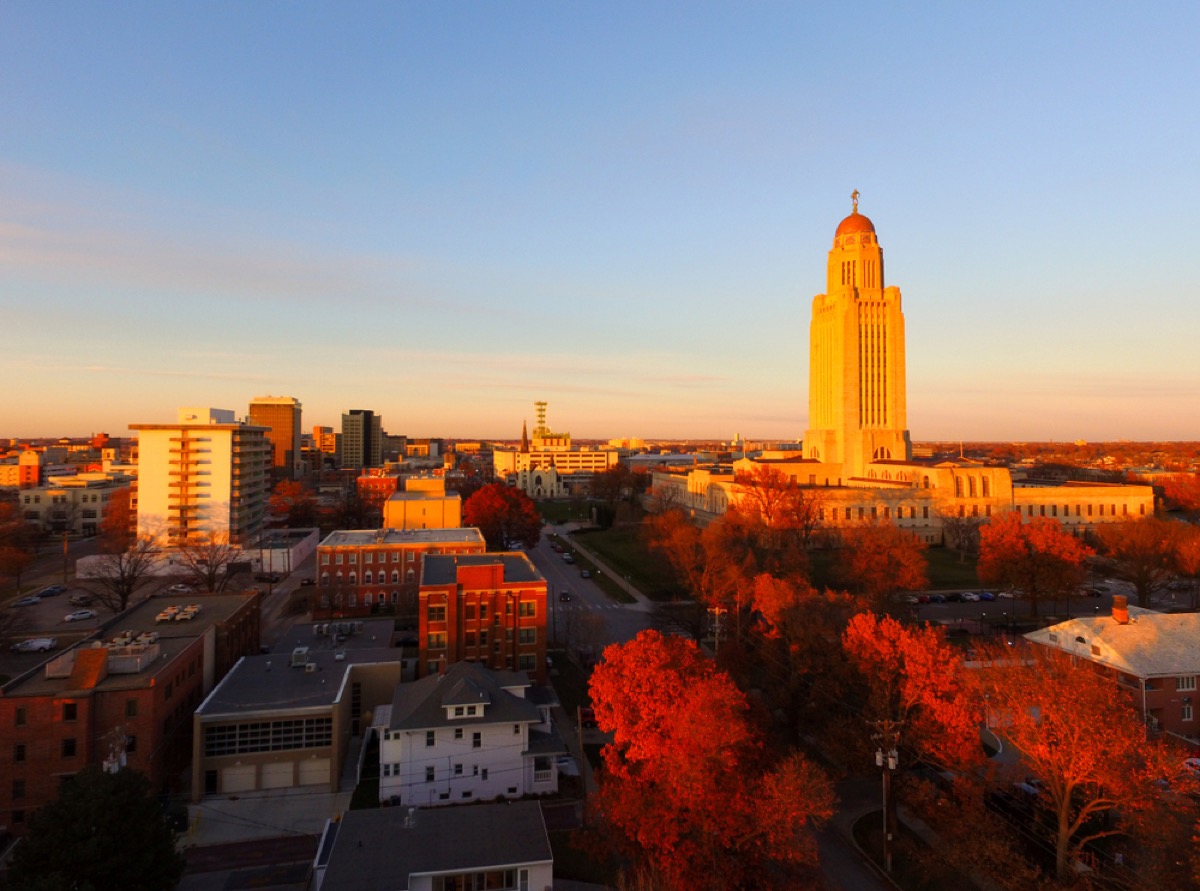
Life expectancy: 79.6 years old
Poverty rate: 10.3 percent
COVID test positivity rate: 12.1 percent
Unemployment rate: 4 percent
Carbon dioxide emissions per year: 48 million metric tons
Worst State Index score: 67.20
39
Utah

Life expectancy: 79.8 years old
Poverty rate: 7.6 percent
COVID test positivity rate: 14 percent
Unemployment rate: 4.1 percent
Carbon dioxide emissions per year: 58 million metric tons
Worst State Index score: 67.45
38
Washington

Life expectancy: 80.3 years old
Poverty rate: 8.8 percent
COVID test positivity rate: 2.8 percent
Unemployment rate: 8.5 percent
Carbon dioxide emissions per year: 78 million metric tons
Worst State Index score: 67.75
37
Oregon

Life expectancy: 79.6 years old
Poverty rate: 9.8 percent
COVID test positivity rate: 7.1 percent
Unemployment rate: 7.7 percent
Carbon dioxide emissions per year: 38 million metric tons
Worst State Index score: 67.85
36
Alaska

Life expectancy: 78.8 years old
Poverty rate: 11.8 percent
COVID test positivity rate: 4.8 percent
Unemployment rate: 7.4 percent
Carbon dioxide emissions per year: 34 million metric tons
Worst State Index score: 68.05
35
Rhode Island

Life expectancy: 79.9 years old
Poverty rate: 9.8 percent
COVID test positivity rate: 1.8 percent
Unemployment rate: 12.8 percent
Carbon dioxide emissions per year: 10 million metric tons
Worst State Index score: 68.65
34
Montana

Life expectancy: 78.6 years old
Poverty rate: 10.1 percent
COVID test positivity rate: 11.1 percent
Unemployment rate: 5.6 percent
Carbon dioxide emissions per year: 30 million metric tons
Worst State Index score: 68.95
33
Massachusetts

Life expectancy: 80.7 years old
Poverty rate: 9.2 percent
COVID test positivity rate: 1 percent
Unemployment rate: 11.3 percent
Carbon dioxide emissions per year: 63 million metric tons
Worst State Index score: 69.28
32
Virginia

Life expectancy: 79.4 years old
Poverty rate: 9.7 percent
COVID test positivity rate: 5.7 percent
Unemployment rate: 6.1 percent
Carbon dioxide emissions per year: 98 million metric tons
Worst State Index score: 71.05
31
Arizona
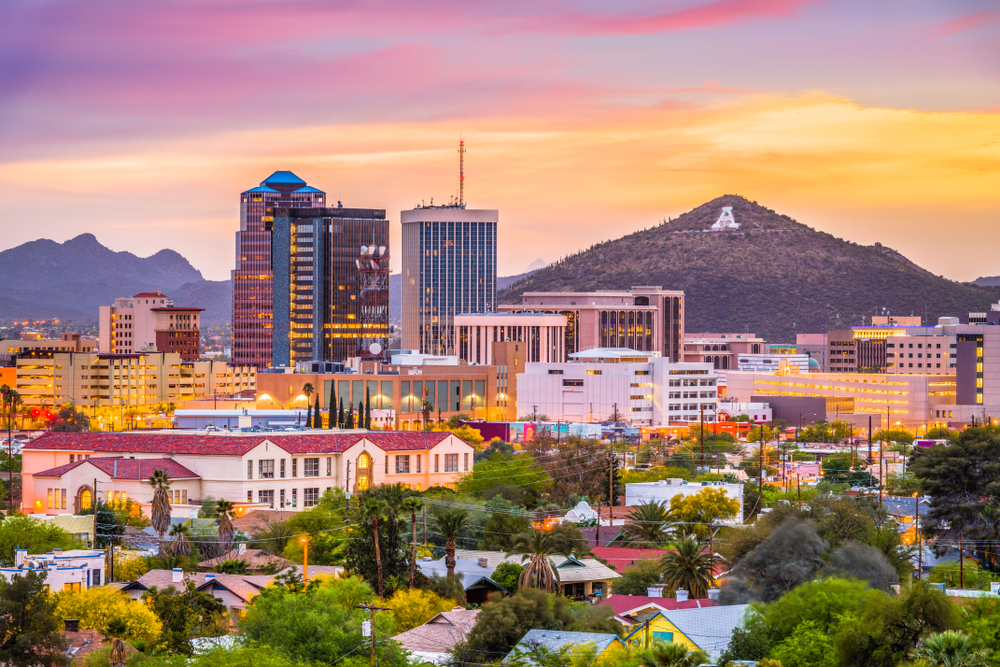
Life expectancy: 79.9 years old
Poverty rate: 12.1 percent
COVID test positivity rate: 6.7 percent
Unemployment rate: 5.7 percent
Carbon dioxide emissions per year: 86 million metric tons
Worst State Index score: 71.15
30
New Jersey

Life expectancy: 80.5 years old
Poverty rate: 8.2 percent
COVID test positivity rate: 2.6 percent
Unemployment rate: 10.9 percent
Carbon dioxide emissions per year: 101 million metric tons
Worst State Index score: 74.23
29
South Dakota

Life expectancy: 79.4 years old
Poverty rate: 10.6 percent
COVID test positivity rate: 21.5 percent
Unemployment rate: 4.8 percent
Carbon dioxide emissions per year: 14 million metric tons
Worst State Index score: 74.65
28
Idaho
Life expectancy: 79.4 years old
Poverty rate: 10 percent
COVID test positivity rate: 23.3 percent
Unemployment rate: 4.1 percent
Carbon dioxide emissions per year: 18 million metric tons
Worst State Index score: 74.95
27
South Carolina

Life expectancy: 77 years old
Poverty rate: 14.4 percent
COVID test positivity rate: 4.4 percent
Unemployment rate: 6.3 percent
Carbon dioxide emissions per year: 69 million metric tons
Worst State Index score: 76.03
26
Iowa

Life expectancy: 79.6 years old
Poverty rate: 8.6 percent
COVID test positivity rate: 17.7 percent
Unemployment rate: 6 percent
Carbon dioxide emissions per year: 76 million metric tons
Worst State Index score: 78.60
25
Wyoming

Life expectancy: 78.8 years old
Poverty rate: 10.5 percent
COVID test positivity rate: 15.1 percent
Unemployment rate: 6.6 percent
Carbon dioxide emissions per year: 61 million metric tons
Worst State Index score: 78.83
24
Kansas

Life expectancy: 78.6 years old
Poverty rate: 10.4 percent
COVID test positivity rate: 16.2 percent
Unemployment rate: 6.9 percent
Carbon dioxide emissions per year: 58 million metric tons
Worst State Index score: 80.45
23
North Carolina
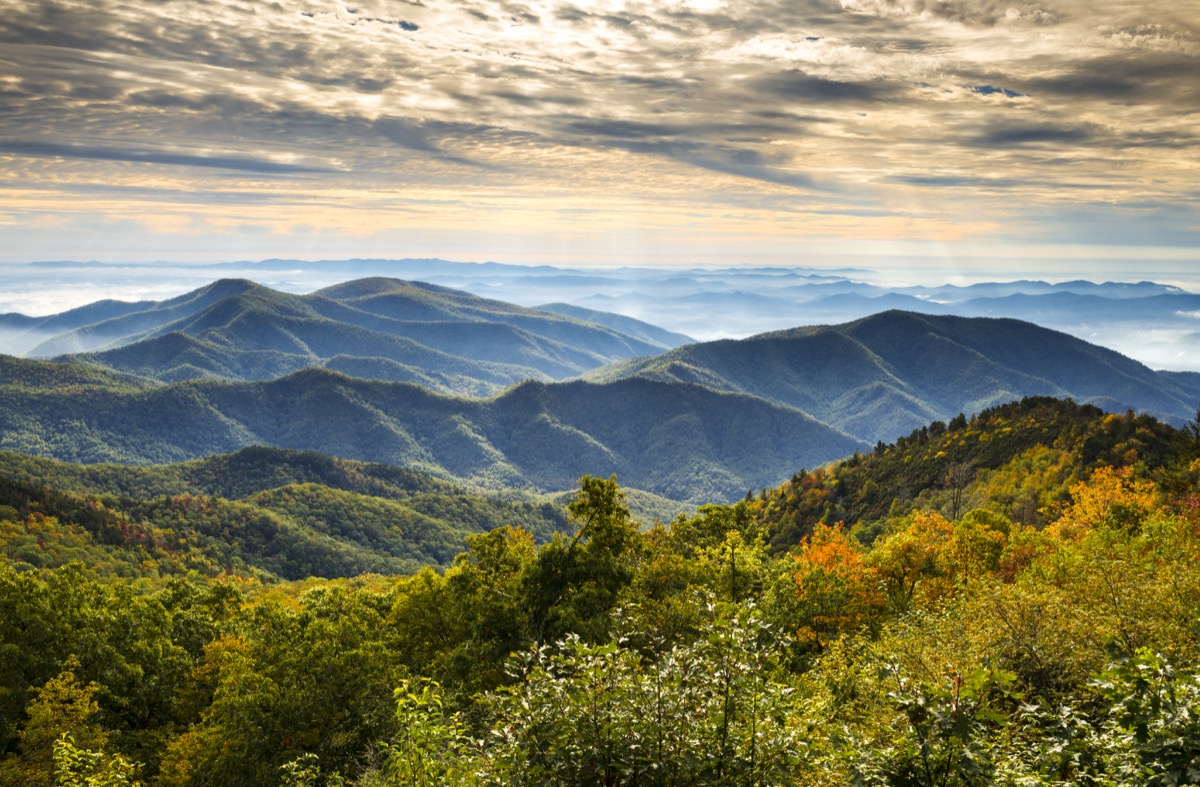
Life expectancy: 78.1 years old
Poverty rate: 13.6 percent
COVID test positivity rate: 6 percent
Unemployment rate: 6.5 percent
Carbon dioxide emissions per year: 115 million metric tons
Worst State Index score: 80.78
22
Georgia

Life expectancy: 77.7 years old
Poverty rate: 13.3 percent
COVID test positivity rate: 6.2 percent
Unemployment rate: 5.6 percent
Carbon dioxide emissions per year: 132 million metric tons
Worst State Index score: 81.80
21
Oklahoma

Life expectancy: 75.8 years old
Poverty rate: 12.4 percent
COVID test positivity rate: 8.6 percent
Unemployment rate: 5.7 percent
Carbon dioxide emissions per year: 93 million metric tons
Worst State Index score: 82.43
20
Missouri

Life expectancy: 77.6 years old
Poverty rate: 11 percent
COVID test positivity rate: 7.4 percent
Unemployment rate: 7 percent
Carbon dioxide emissions per year: 122 million metric tons
Worst State Index score: 82.45
19
Wisconsin

Life expectancy: 80 years old
Poverty rate: 8.7 percent
COVID test positivity rate: 19.3 percent
Unemployment rate: 6.2 percent
Carbon dioxide emissions per year: 98 million metric tons
Worst State Index score: 82.65
18
Arkansas

Life expectancy: 76 years old
Poverty rate: 15 percent
COVID test positivity rate: 7.8 percent
Unemployment rate: 7.4 percent
Carbon dioxide emissions per year: 64 million metric tons
Worst State Index score: 83.60
17
Michigan

Life expectancy: 78.2 years old
Poverty rate: 10.7 percent
COVID test positivity rate: 3.3 percent
Unemployment rate: 8.7 percent
Carbon dioxide emissions per year: 152 million metric tons
Worst State Index score: 84.00
16
New Mexico
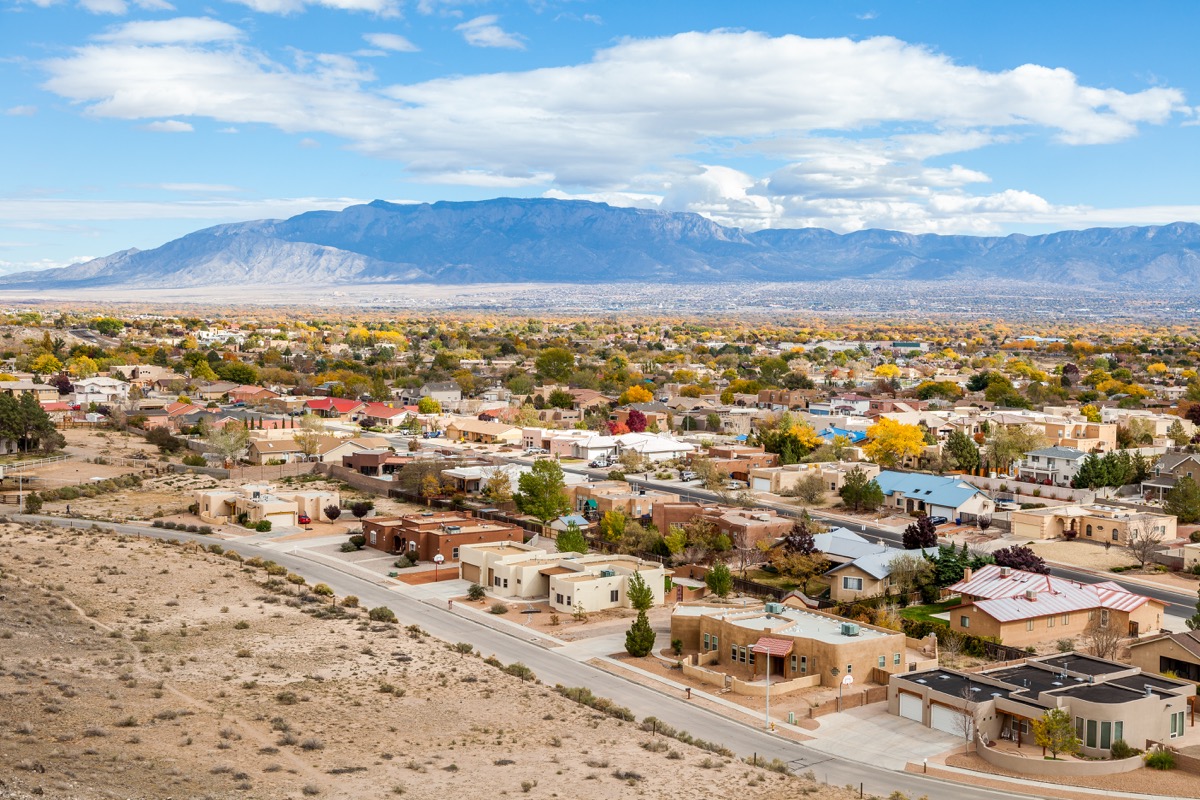
Life expectancy: 78.4 years old
Poverty rate: 17.2 percent
COVID test positivity rate: 5 percent
Unemployment rate: 11.3 percent
Carbon dioxide emissions per year: 49 million metric tons
Worst State Index score: 84.13
15
Tennessee

Life expectancy: 76.3 years old
Poverty rate: 12.1 percent
COVID test positivity rate: 6.4 percent
Unemployment rate: 8.5 percent
Carbon dioxide emissions per year: 98 million metric tons
Worst State Index score: 85.15
14
New York

Life expectancy: 81 years old
Poverty rate: 12.1 percent
COVID test positivity rate: 1.2 percent
Unemployment rate: 12.5 percent
Carbon dioxide emissions per year: 157 million metric tons
Worst State Index score: 85.93
13
West Virginia

Life expectancy: 75.3 years old
Poverty rate: 15.6 percent
COVID test positivity rate: 3.2 percent
Unemployment rate: 8.9 percent
Carbon dioxide emissions per year: 91 million metric tons
Worst State Index score: 87.38
12
Kentucky

Life expectancy: 75.9 years old
Poverty rate: 14.2 percent
COVID test positivity rate: 7.3 percent
Unemployment rate: 7.6 percent
Carbon dioxide emissions per year: 114 million metric tons
Worst State Index score: 89.15
11
Mississippi

Life expectancy: 74.9 years old
Poverty rate: 19.1 percent
COVID test positivity rate: 6.4 percent
Unemployment rate: 7.9 percent
Carbon dioxide emissions per year: 67 million metric tons
Worst State Index score: 89.88
10
Nevada

Life expectancy: 78.4 years old
Poverty rate: 12.2 percent
COVID test positivity rate: 14.9 percent
Unemployment rate: 13.2 percent
Carbon dioxide emissions per year: 36 million metric tons
Worst State Index score: 91.20
9
Alabama

Life expectancy: 75.5 years old
Poverty rate: 14.7 percent
COVID test positivity rate: 13.3 percent
Unemployment rate: 5.6 percent
Carbon dioxide emissions per year: 108 million metric tons
Worst State Index score: 91.70
8
Illinois

Life expectancy: 79.3 years old
Poverty rate: 10.4 percent
COVID test positivity rate: 4.1 percent
Unemployment rate: 11 percent
Carbon dioxide emissions per year: 201 million metric tons
Worst State Index score: 93.03
7
Ohio
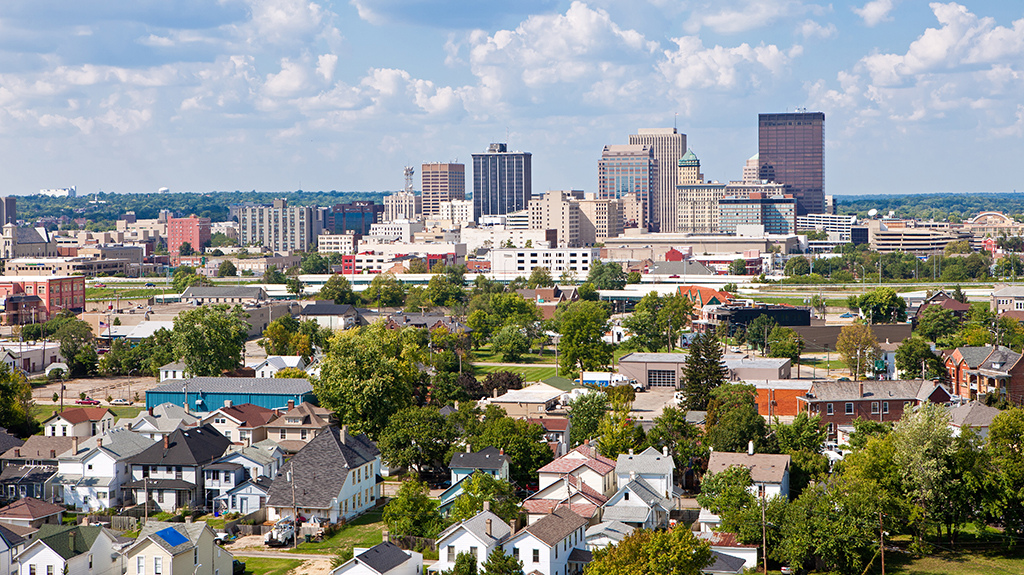
Life expectancy: 77.6 years old
Poverty rate: 12.4 percent
COVID test positivity rate: 3.5 percent
Unemployment rate: 8.9 percent
Carbon dioxide emissions per year: 204 million metric tons
Worst State Index score: 94.00
6
Indiana

Life expectancy: 77.4 years old
Poverty rate: 11.1 percent
COVID test positivity rate: 14.1 percent
Unemployment rate: 6.4 percent
Carbon dioxide emissions per year: 176 million metric tons
Worst State Index score: 95.20
5
Florida

Life expectancy: 80.1 years old
Poverty rate: 12.9 percent
COVID test positivity rate: 10.1 percent
Unemployment rate: 7.4 percent
Carbon dioxide emissions per year: 227 million metric tons
Worst State Index score: 95.98
4
Pennsylvania

Life expectancy: 78.6 years old
Poverty rate: 10.5 percent
COVID test positivity rate: 7.9 percent
Unemployment rate: 10.3 percent
Carbon dioxide emissions per year: 215 million metric tons
Worst State Index score: 98.68
3
Louisiana

Life expectancy: 76 years old
Poverty rate: 19.1 percent
COVID test positivity rate: 4.9 percent
Unemployment rate: 7.6 percent
Carbon dioxide emissions per year: 226 million metric tons
Worst State Index score: 105.45
2
California

Life expectancy: 81.3 years old
Poverty rate: 11.4 percent
COVID test positivity rate: 2.7 percent
Unemployment rate: 11.4 percent
Carbon dioxide emissions per year: 359 million metric tons
Worst State Index score: 109.18
1
Texas

Life expectancy: 78.8 years old
Poverty rate: 12.7 percent
COVID test positivity rate: 7.6 percent
Unemployment rate: 6.8 percent
Carbon dioxide emissions per year: 707 million metric tons
Worst State Index score: 154.68
And for another factor that plays into a state’s quality of life, find out The State Where Your Money Is Worth the Least.