This Is the Smelliest State in America

Some states are known for their crisp air and pine tree scent (looking at you, Vermont). But not all are so lucky—many smell like rotten eggs or sewage when you’re driving through. So why are some foul-smelling and others fresh? We decided to find out for ourselves by parsing through the data to rank each state from freshest to stinkiest.
According to the Environmental Protection Agency (EPA), high emissions of methane, ammonia, and hydrogen sulfide are the main culprits behind the stench. Using the EPA’s Greenhouse Gas Reporting Program, we calculated the methane emissions per capita, as well as the percentage of each state that’s covered in landfills, from the EPA’s Landfill Methane Outreach Program. We then factored in the natural gas plant liquid production for each state, with data provided by the U.S. Energy Information Administration and the United States Department of Agriculture’s Major Land Uses Survey.
This left us with one final important metric: cropland. According to the USDA Agricultural Air Quality Task Force, roughly 60 to 85 percent of ammonia emissions in the United States are estimated to come from agricultural sources. Agriculture is also a major source of methane emissions (36 percent) followed by oil and natural gas systems (31 percent), according to the EPA.
Together, we compiled and analyzed these numbers through our exclusive algorithm to determine the Smelliness Score for each state. While the stinkiest state had the second highest amount of landfills (phew!), the runner-up had the most methane emissions. Keep reading to discover which state is really the smelliest and learn where your state stands. And for more places that aren’t so fresh and clean, This is the Dirtiest State in the U.S.
50
Nevada
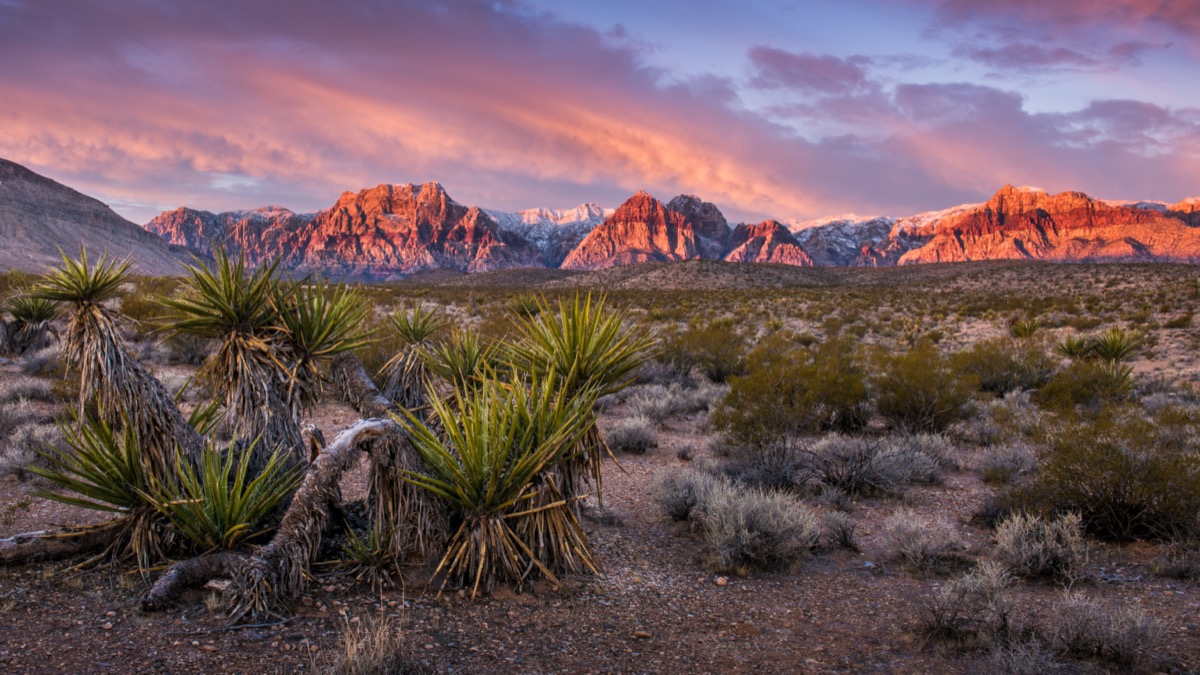
Methane emissions per capita: 0.14 tons
Percentage of state occupied by landfills: 0.0016
Percentage of state occupied by cropland: 0.8
Natural gas plant liquid production per capita: N/A
Smelliness Score: 0.01
And for more places that aren’t very pleasant, This Is the Rudest State in America.
49
Maine

Methane emissions per capita: 0.19 tons
Percentage of state occupied by landfills: 0.0013
Percentage of state occupied by cropland: 2
Natural gas plant liquid production per capita: N/A
Smelliness Score: 1.15
48
Utah

Methane emissions per capita: 0.31 tons
Percentage of state occupied by landfills: 0.0019
Percentage of state occupied by cropland: 2.8
Natural gas plant liquid production per capita: 301
Smelliness Score: 4.43
And for more areas you may not enjoy, This Is the Most Hated State in America.
47
Arizona
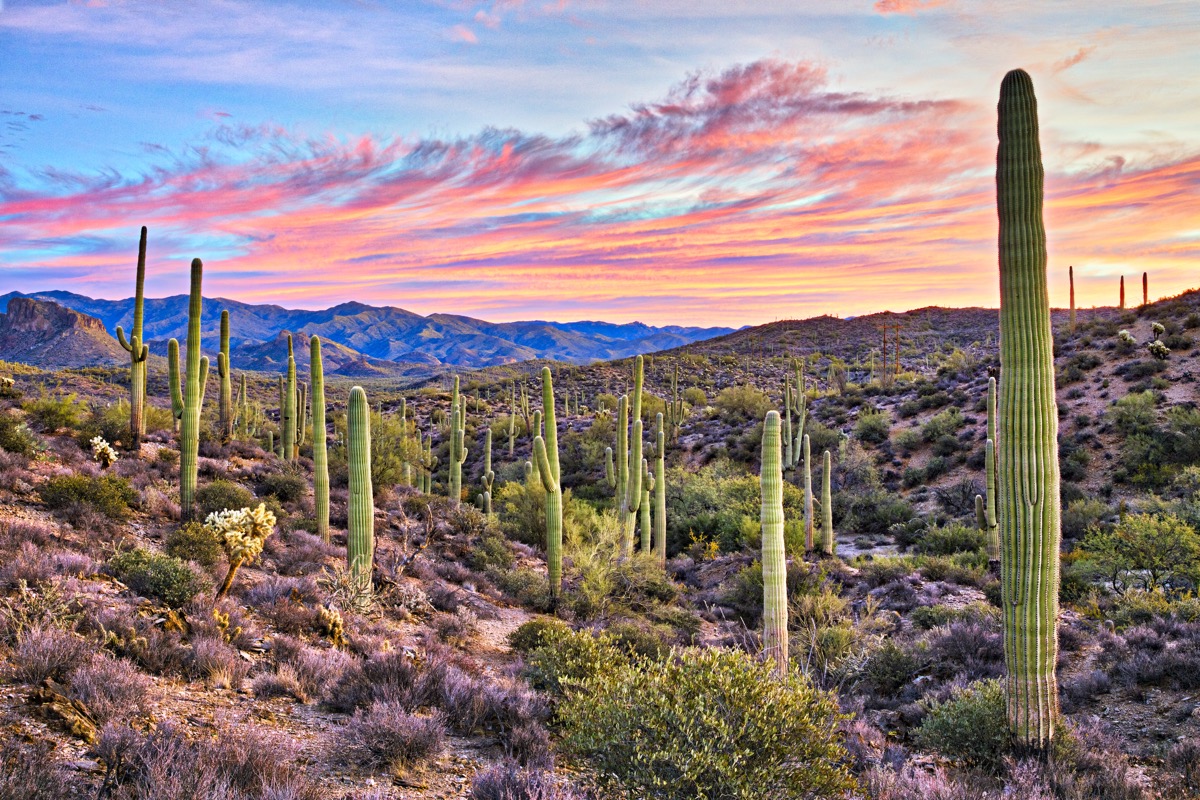
Methane emissions per capita: 0.24 tons
Percentage of state occupied by landfills: 0.0038
Percentage of state occupied by cropland: 1.6
Natural gas plant liquid production per capita: N/A
Smelliness Score: 5.44
46
Vermont

Methane emissions per capita: 0.1 tons
Percentage of state occupied by landfills: 0.0026
Percentage of state occupied by cropland: 7
Natural gas plant liquid production per capita: N/A
Smelliness Score: 7.21
45
Oregon
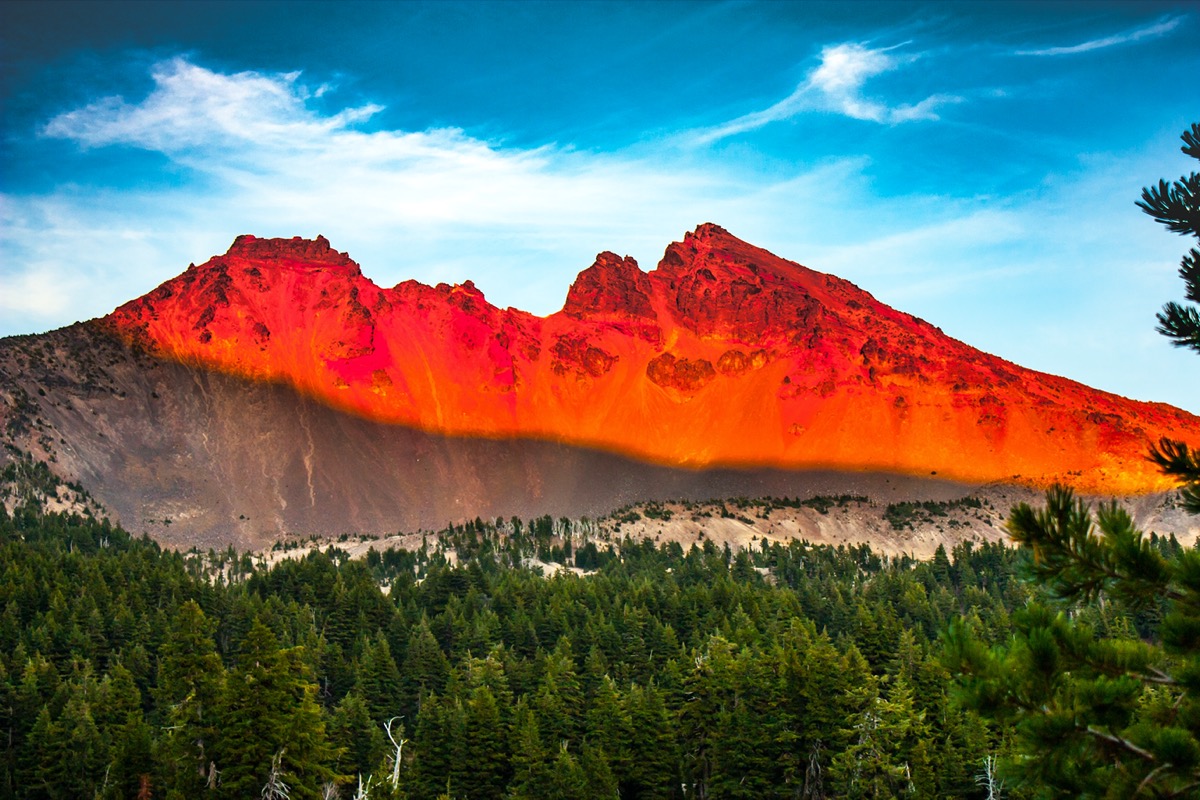
Methane emissions per capita: 0.23 tons
Percentage of state occupied by landfills: 0.0019
Percentage of state occupied by cropland: 7.6
Natural gas plant liquid production per capita: N/A
Smelliness Score: 7.88
44
Idaho
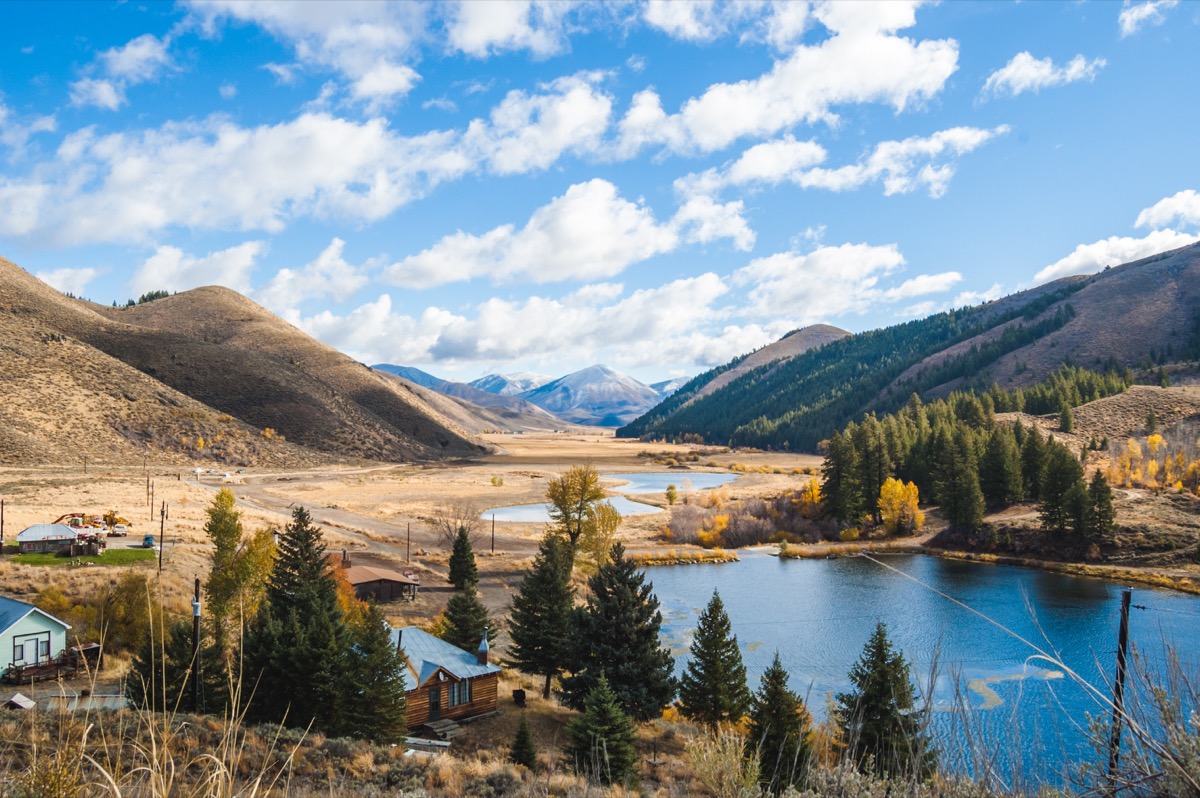
Methane emissions per capita: 0.32 tons
Percentage of state occupied by landfills: 0.0008
Percentage of state occupied by cropland: 11
Natural gas plant liquid production per capita: 2.6
Smelliness Score: 10.05
43
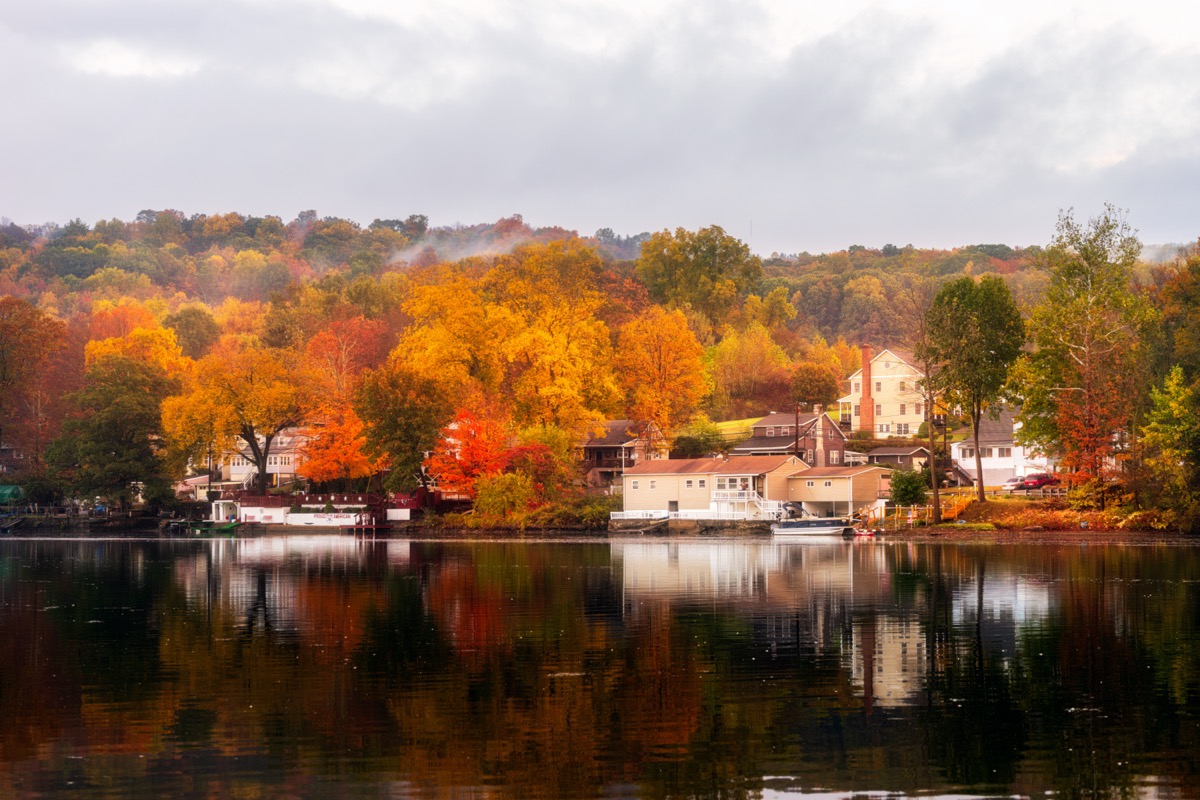
New Hampshire

Methane emissions per capita: 0.26 tons
Percentage of state occupied by landfills: 0.0079
Percentage of state occupied by cropland: 1.6
Natural gas plant liquid production per capita: N/A
Smelliness Score: 12.48
42
Montana

Methane emissions per capita: 0.32 tons
Percentage of state occupied by landfills: 0.0004
Percentage of state occupied by cropland: 17.8
Natural gas plant liquid production per capita: 136.6
Smelliness Score: 16.03
41
Hawaii

Methane emissions per capita: 0.25 tons
Percentage of state occupied by landfills: 0.006
Percentage of state occupied by cropland: 9.1
Natural gas plant liquid production per capita: N/A
Smelliness Score: 16.36
40
New Mexico
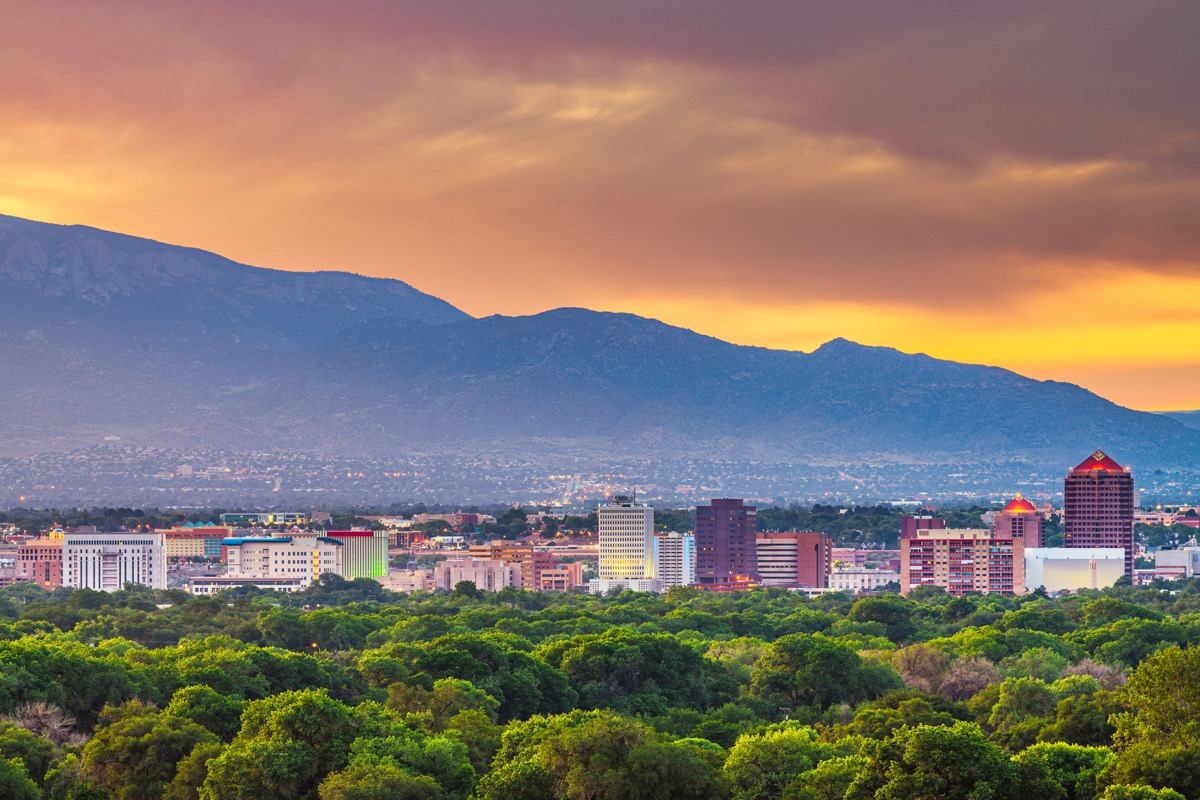
Methane emissions per capita: 0.82 tons
Percentage of state occupied by landfills: 0.0013
Percentage of state occupied by cropland: 2.5
Natural gas plant liquid production per capita: 8115.9
Smelliness Score: 16.82
39
Wyoming

Methane emissions per capita: 0.75 tons
Percentage of state occupied by landfills: 0.0004
Percentage of state occupied by cropland: 3.2
Natural gas plant liquid production per capita: 9511.4
Smelliness Score: 16.93
38
Connecticut
Methane emissions per capita: 0.09 tons
Percentage of state occupied by landfills: 0.0111
Percentage of state occupied by cropland: 4
Natural gas plant liquid production per capita: N/A
Smelliness Score: 18.56
37
Washington

Methane emissions per capita: 0.19 tons
Percentage of state occupied by landfills: 0.0038
Percentage of state occupied by cropland: 17.7
Natural gas plant liquid production per capita: N/A
Smelliness Score: 20.17
36
Alaska
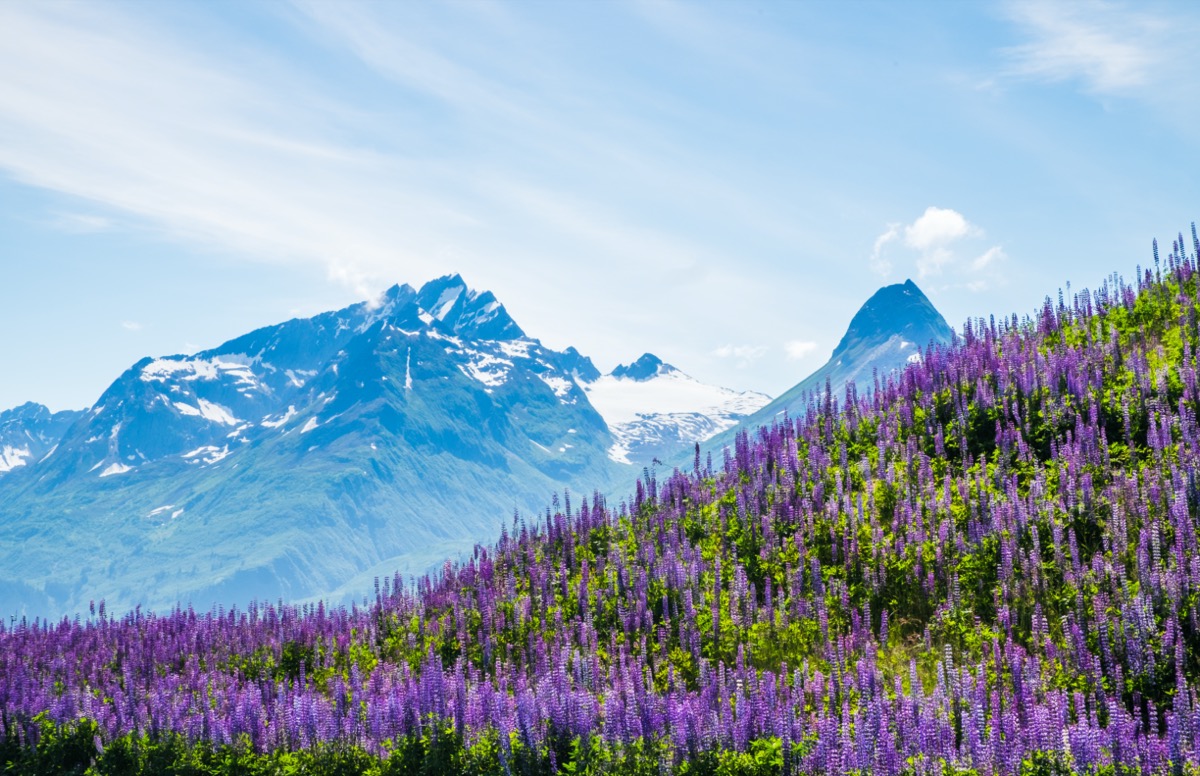
Methane emissions per capita: 0.76 tons
Percentage of state occupied by landfills: 0.01
Percentage of state occupied by cropland: N/A
Natural gas plant liquid production per capita: 2,714.4
Smelliness Score: 22.48
35
Colorado
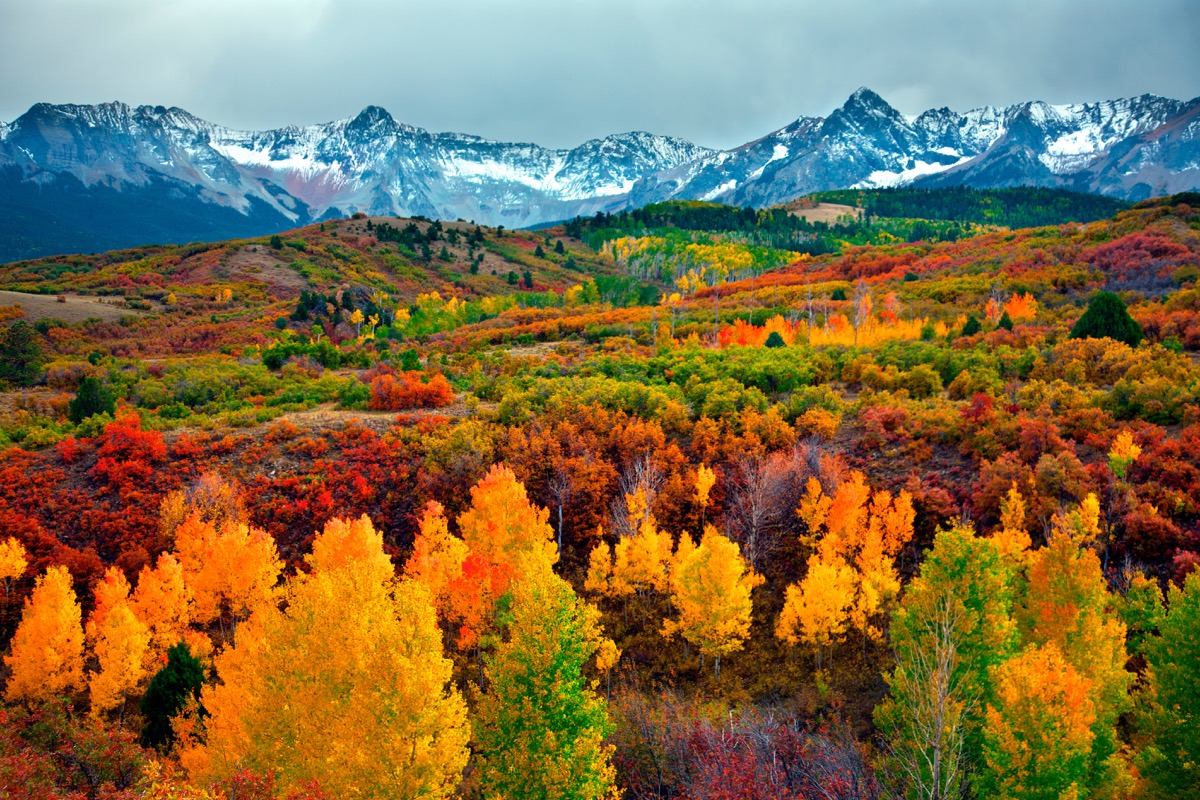
Methane emissions per capita: 0.41 tons
Percentage of state occupied by landfills: 0.0039
Percentage of state occupied by cropland: 16.1
Natural gas plant liquid production per capita: 2485.7
Smelliness Score: 23.79
34
Mississippi

Methane emissions per capita: 0.8 tons
Percentage of state occupied by landfills: 0.0035
Percentage of state occupied by cropland: 17.2
Natural gas plant liquid production per capita: 0.2
Smelliness Score: 25.22
33
South Carolina

Methane emissions per capita: 0.36 tons
Percentage of state occupied by landfills: 0.0105
Percentage of state occupied by cropland: 9.9
Natural gas plant liquid production per capita: N/A
Smelliness Score: 25.73
32
Arkansas

Methane emissions per capita: 0.63 tons
Percentage of state occupied by landfills: 0.0035
Percentage of state occupied by cropland: 24.7
Natural gas plant liquid production per capita: 8.5
Smelliness Score: 30.65
And for more places that aren’t very pretty, This Is the Ugliest State in the U.S.
31
Alabama

Methane emissions per capita: 1.87 tons
Percentage of state occupied by landfills: 0.0058
Percentage of state occupied by cropland: 8.7
Natural gas plant liquid production per capita: 64.6
Smelliness Score: 31.57
30
California

Methane emissions per capita: 0.22 tons
Percentage of state occupied by landfills: 0.0153
Percentage of state occupied by cropland: 9.6
Natural gas plant liquid production per capita: 22.2
Smelliness Score: 32.18
29
Georgia

Methane emissions per capita: 0.57 tons
Percentage of state occupied by landfills: 0.0122
Percentage of state occupied by cropland: 11.9
Natural gas plant liquid production per capita: N/A
Smelliness Score: 32.53
28
North Carolina
Methane emissions per capita: 0.44 tons
Percentage of state occupied by landfills: 0.0119
Percentage of state occupied by cropland: 14.4
Natural gas plant liquid production per capita: N/A
Smelliness Score: 33.1
27
Massachusetts

Methane emissions per capita: 0.13 tons
Percentage of state occupied by landfills: 0.0205
Percentage of state occupied by cropland: 3
Natural gas plant liquid production per capita: N/A
Smelliness Score: 33.73
26
Michigan

Methane emissions per capita: 0.51 tons
Percentage of state occupied by landfills: 0.0079
Percentage of state occupied by cropland: 21.5
Natural gas plant liquid production per capita: 11.2
Smelliness Score: 33.81
25
Tennessee

Methane emissions per capita: 0.44 tons
Percentage of state occupied by landfills: 0.0095
Percentage of state occupied by cropland: 19.9
Natural gas plant liquid production per capita: 0.2
Smelliness Score: 34.29
24
Florida

Methane emissions per capita: 0.36 tons
Percentage of state occupied by landfills: 0.0166
Percentage of state occupied by cropland: 8.3
Natural gas plant liquid production per capita: 1.4
Smelliness Score: 34.49
23
New York
Methane emissions per capita: 0.16 tons
Percentage of state occupied by landfills: 0.0146
Percentage of state occupied by cropland: 14.1
Natural gas plant liquid production per capita: N/A
Smelliness Score: 34.67
22
Wisconsin

Methane emissions per capita: 0.28 tons
Percentage of state occupied by landfills: 0.0058
Percentage of state occupied by cropland: 29.1
Natural gas plant liquid production per capita: N/A
Smelliness Score: 35.26
And if you can’t get enough state rankings and facts, get them sent straight to your inbox by signing up for our daily newsletter.
21
Texas

Methane emissions per capita: 0.51 tons
Percentage of state occupied by landfills: 0.0083
Percentage of state occupied by cropland: 17.5
Natural gas plant liquid production per capita: 4116.1
Smelliness Score: 35.32
20
Virginia

Methane emissions per capita: 0.7 tons
Percentage of state occupied by landfills: 0.0136
Percentage of state occupied by cropland: 11.8
Natural gas plant liquid production per capita: 0.6
Smelliness Score: 36.09
19
South Dakota
Methane emissions per capita: 0.3 tons
Percentage of state occupied by landfills: 0.0007
Percentage of state occupied by cropland: 39.9
Natural gas plant liquid production per capita: 0.1
Smelliness Score: 37.07
18
Louisiana

Methane emissions per capita: 1.35 tons
Percentage of state occupied by landfills: 0.0072
Percentage of state occupied by cropland: 16.6
Natural gas plant liquid production per capita: 1121.5
Smelliness Score: 37.53
17
Missouri

Methane emissions per capita: 0.27 tons
Percentage of state occupied by landfills: 0.0046
Percentage of state occupied by cropland: 35.5
Natural gas plant liquid production per capita: N/A
Smelliness Score: 39.17
16
Oklahoma

Methane emissions per capita: 0.72 tons
Percentage of state occupied by landfills: 0.0034
Percentage of state occupied by cropland: 25.7
Natural gas plant liquid production per capita: 7212.2
Smelliness Score: 40.4
15
Kentucky

Methane emissions per capita: 0.83 tons
Percentage of state occupied by landfills: 0.0086
Percentage of state occupied by cropland: 25.2
Natural gas plant liquid production per capita: 114.1
Smelliness Score: 41.78
14
Minnesota

Methane emissions per capita: 0.35 tons
Percentage of state occupied by landfills: 0.0028
Percentage of state occupied by cropland: 44.1
Natural gas plant liquid production per capita: N/A
Smelliness Score: 45.12
13
Nebraska

Methane emissions per capita: 0.64 tons
Percentage of state occupied by landfills: 0.0016
Percentage of state occupied by cropland: 44.5
Natural gas plant liquid production per capita: N/A
Smelliness Score: 46.28
12
Pennsylvania

Methane emissions per capita: 0.94 tons
Percentage of state occupied by landfills: 0.0191
Percentage of state occupied by cropland: 15.8
Natural gas plant liquid production per capita: 746.2
Smelliness Score: 52.32
11
Kansas
Methane emissions per capita: 0.62 tons
Percentage of state occupied by landfills: 0.0032
Percentage of state occupied by cropland: 54.6
Natural gas plant liquid production per capita: 531.4
Smelliness Score: 58.96
10
Maryland

Methane emissions per capita: 0.21 tons
Percentage of state occupied by landfills: 0.0263
Percentage of state occupied by cropland: 22.2
Natural gas plant liquid production per capita: N/A
Smelliness Score: 62.47
9
Rhode Island

Methane emissions per capita: 0.23 tons
Percentage of state occupied by landfills: 0.0375
Percentage of state occupied by cropland: 3.8
Natural gas plant liquid production per capita: N/A
Smelliness Score: 64.09
8
Ohio

Methane emissions per capita: 0.51 tons
Percentage of state occupied by landfills: 0.0165
Percentage of state occupied by cropland: 41.4
Natural gas plant liquid production per capita: 444.7
Smelliness Score: 67.63
7
New Jersey

Methane emissions per capita: 0.22 tons
Percentage of state occupied by landfills: 0.0421
Percentage of state occupied by cropland: 9.5
Natural gas plant liquid production per capita: N/A
Smelliness Score: 77.09
6
Iowa

Methane emissions per capita: 0.54 tons
Percentage of state occupied by landfills: 0.0045
Percentage of state occupied by cropland: 74.7
Natural gas plant liquid production per capita: N/A
Smelliness Score: 78.77
5
Indiana

Methane emissions per capita: 0.89 tons
Percentage of state occupied by landfills: 0.0174
Percentage of state occupied by cropland: 55.4
Natural gas plant liquid production per capita: N/A
Smelliness Score: 85.67
4
North Dakota
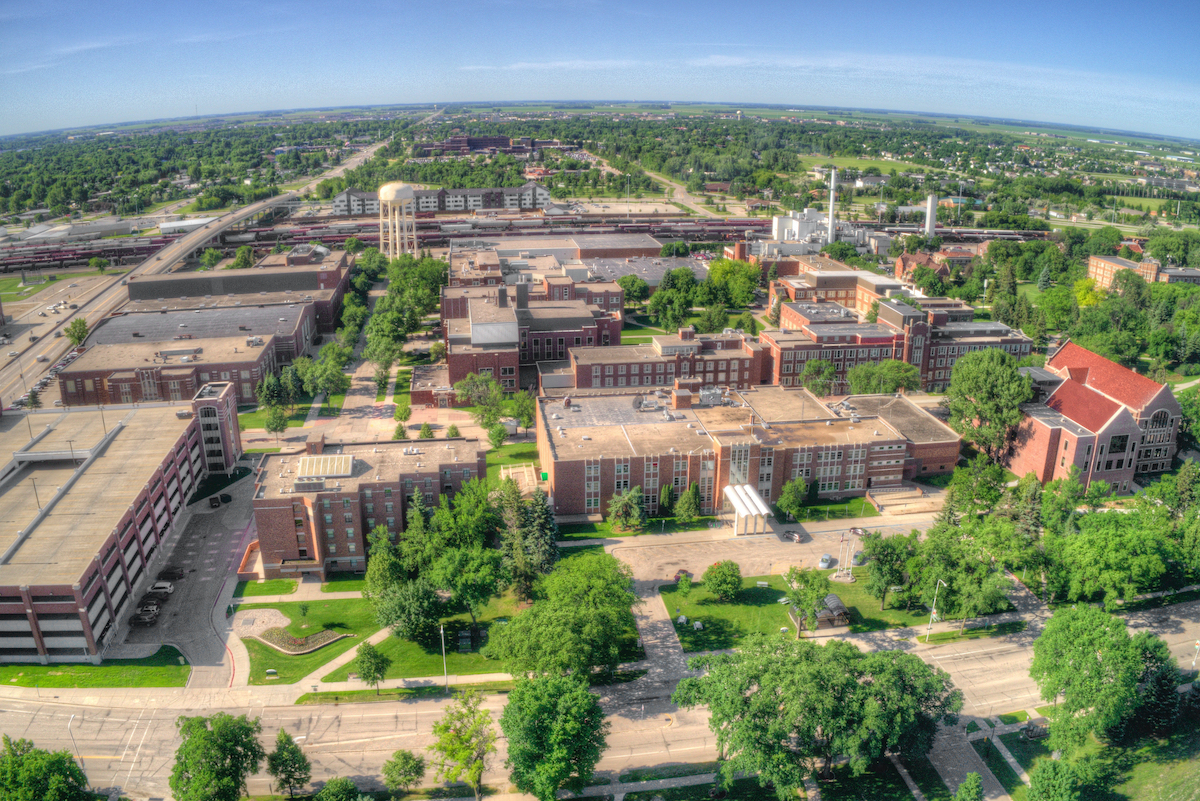
Methane emissions per capita: 0.9 tons
Percentage of state occupied by landfills: 0.0007
Percentage of state occupied by cropland: 61.4
Natural gas plant liquid production per capita: 21082.5
Smelliness Score: 86.97
3
Illinois
Methane emissions per capita: 0.51 tons
Percentage of state occupied by landfills: 0.016
Percentage of state occupied by cropland: 67.4
Natural gas plant liquid production per capita: 0.3
Smelliness Score: 90.93
2
West Virginia

Methane emissions per capita: 7.22 tons
Percentage of state occupied by landfills: 0.0067
Percentage of state occupied by cropland: 5.1
Natural gas plant liquid production per capita: 10497.7
Smelliness Score: 93.8
1
Delaware
Methane emissions per capita: 0.45 tons
Percentage of state occupied by landfills: 0.0399
Percentage of state occupied by cropland: 35.1
Natural gas plant liquid production per capita: N/A
Smelliness Score: 99.91