The 50 Best American Cities for Runners

So you’re one of America’s 65 million active runners. Congrats! You’re well on your way to a stronger heart, a seriously deft and nimble brain, and a stress-free, longer life. But do you know the best places in America where you can bound out of bed for your favorite exercise?
We certainly do. We’ve crunched the relevant data on America’s running capitals—taking into account the number of available parks (via the Trust for Public Land), the local climate (via U.S. Climate Data), the number of road races held annually (courtesy of RunningInTheUSA), the air quality (courtesy of the Environmental Protection Agency), the area’s walkability (via WalkScore), and the percentage of locals who live within an easy ten minutes from a great green space where they can run to their heart’s delight away from the harsh surface of concrete—and created a proprietary “running score.” Here you’ll find the top 50 runners’ paradises in America, from the least running-friendly to the most-running friendly.
So read on, and see if your city makes the grade. And since it’s officially fall race season, don’t miss the 4 Essentials Steps for Running a Perfect Race!
50
Anaheim, CA

Walkability: 54
Number of Races Within 25 Miles: 252
Parkland as Percent of Adjusted City Area: 8%
Percent of Residents Within 10 Min Walk of Park: 19%
Air Quality Index: 72
Average Temperature: 67.05°F
Runner Score: 38.80
For more healthy ways to unwind, here are the 32 Secrets of a Stress-Proof Life.
49
Colorado Spring, CO

Walkability: 50
Number of Races Within 25 Miles: 52
Parkland as Percent of Adjusted City Area: 9%
Percent of Residents Within 10 Min Walk of Park: 24%
Air Quality Index: 45
Average Temperature: 48.95°F
Runner Score: 39.80
48
Richmond, VA

Walkability: 51
Number of Races Within 25 Miles: 55
Parkland as Percent of Adjusted City Area: 5%
Percent of Residents Within 10 Min Walk of Park: 26%
Air Quality Index: 2
Average Temperature: 58.75°F
Days Per Year with Precipitation: 116
Runner Score: 40.38
And if you’re going to run “the ‘Mond,” be sure to know The Smart Way to Tie Your Shoes Before a Run.
47
Tampa, FL
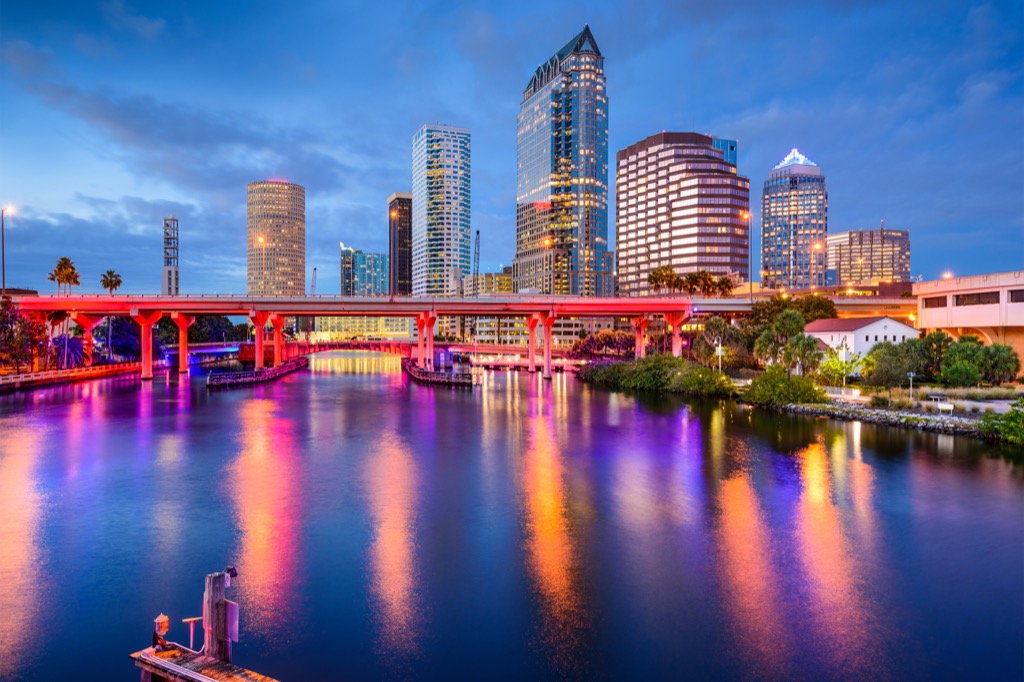
Walkability: 50
Number of Races Within 25 Miles:139
Parkland as Percent of Adjusted City Area: 7%
Percent of Residents Within 10 Min Walk of Park: 18%
Air Quality Index: 23
Average Temperature: 73.35°F
Runner Score: 40.64
46
Detroit, MI

Walkability: 55
Number of Races Within 25 Miles:114
Parkland as Percent of Adjusted City Area: 6%
Percent of Residents Within 10 Min Walk of Park: 28%
Air Quality Index: 56
Average Temperature: 48.7°F
Days Per Year with Precipitation: 133
Runner Score: 41.02
45
Sacramento, CA

Walkability: 47
Number of Races Within 25 Miles: 92
Parkland as Percent of Adjusted City Area: 8%
Percent of Residents Within 10 Min Walk of Park: 29%
Air Quality Index: 43
Average Temperature: 60.95°F
Runner Score: 41.13
Remember: Coffee is a great pre-run drink. It’s one of the things you’ll learn about in the 75 Amazing Benefits of Coffee!
44
Santa Ana, CA

Walkability: 66
Number of Races Within 25 Miles:185
Parkland as Percent of Adjusted City Area: 4%
Percent of Residents Within 10 Min Walk of Park: 25%
Air Quality Index:72
Average Temperature: 65.6°F
Runner Score: 42.13
43
Hialeah, FL
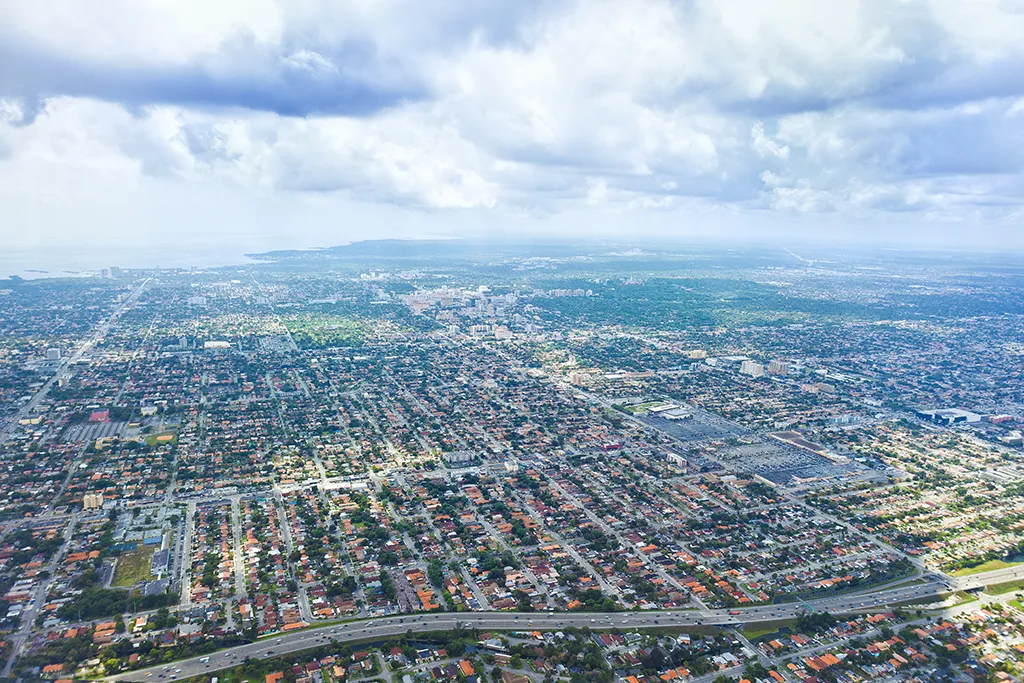
Walkability: 69
Number of Races Within 25 Miles: 115
Parkland as Percent of Adjusted City Area: 1%
Percent of Residents Within 10 Min Walk of Park: 19%
Air Quality Index: 29
Average Temperature: 75.95°F
Runner Score: 43.04
42
Toledo, OH

Walkability: 46
Number of Races Within 25 Miles: 40
Parkland as Percent of Adjusted City Area: 6%
Percent of Residents Within 10 Min Walk of Park: 27%
Average Temperature: 53.4°F
Runner Score: 43.50
41
Cincinnati, OH

Walkability: 49
Number of Races Within 25 Miles: 65
Parkland as Percent of Adjusted City Area: 14%
Percent of Residents Within 10 Min Walk of Park:25%
Air Quality Index: 51
Average Temperature: 54.65°F
Days Per Year with Precipitation: 132
Runner Score: 44.13
40
Lincoln, NE

Walkability: 43
Number of Races Within 25 Miles: 16
Parkland as Percent of Adjusted City Area: 7%
Percent of Residents Within 10 Min Walk of Park: 33%
Average Temperature: 51.5°F
Runner Score: 45.40
39
Cleveland, OH

Walkability: 60
Number of Races Within 25 Miles: 85
Parkland as Percent of Adjusted City Area: 6%
Percent of Residents Within 10 Min Walk of Park: 29%
Air Quality Index: 42
Average Temperature: 51.35°F
Runner Score: 45.63
38
Omaha, NE
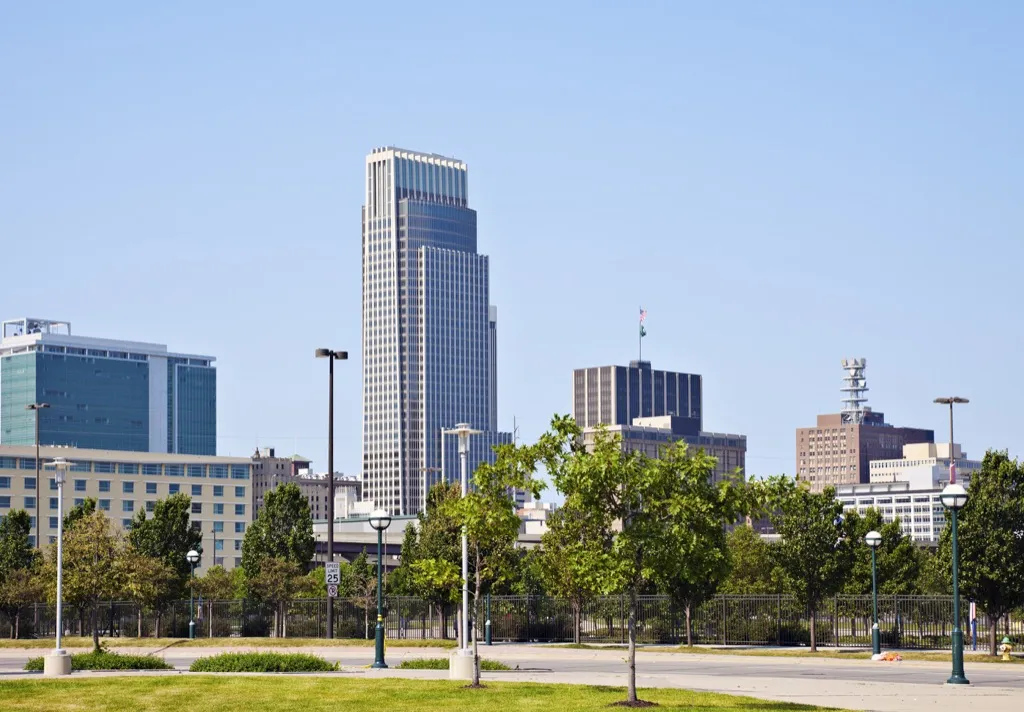
Walkability: 45
Number of Races Within 25 Miles: 28
Parkland as Percent of Adjusted City Area: 14%
Percent of Residents Within 10 Min Walk of Park: 28%
Air Quality Index: 30
Average Temperature: 50.65°F
Days Per Year with Precipitation: 98
Runner Score: 46.20
For ways to structure your day around your run, check out 29 Best Body Clock Hacks to Maximize Your Day.
37
Los Angeles, CA

Walkability: 67
Number of Races Within 25 Miles: 212
Parkland as Percent of Adjusted City Area: 13%
Percent of Residents Within 10 Min Walk of Park: 15%
Air Quality Index: 73
Average Temperature: 63.8°F
Runner Score: 47.13
36
Denver, CO

Walkability: 61
Number of Races Within 25 Miles: 160
Parkland as Percent of Adjusted City Area: 8%
Percent of Residents Within 10 Min Walk of Park: 33%
Air Quality Index: 70
Average Temperature: 50.7°F
Runner Score: 47.33
35
Irvine, CA

Walkability: 44
Number of Races Within 25 Miles: 163
Parkland as Percent of Adjusted City Area: 20%
Percent of Residents Within 10 Min Walk of Park: 27%
Air Quality Index: 72
Average Temperature: 63.5°F
Runner Score: 47.58
34
Anchorage, AK
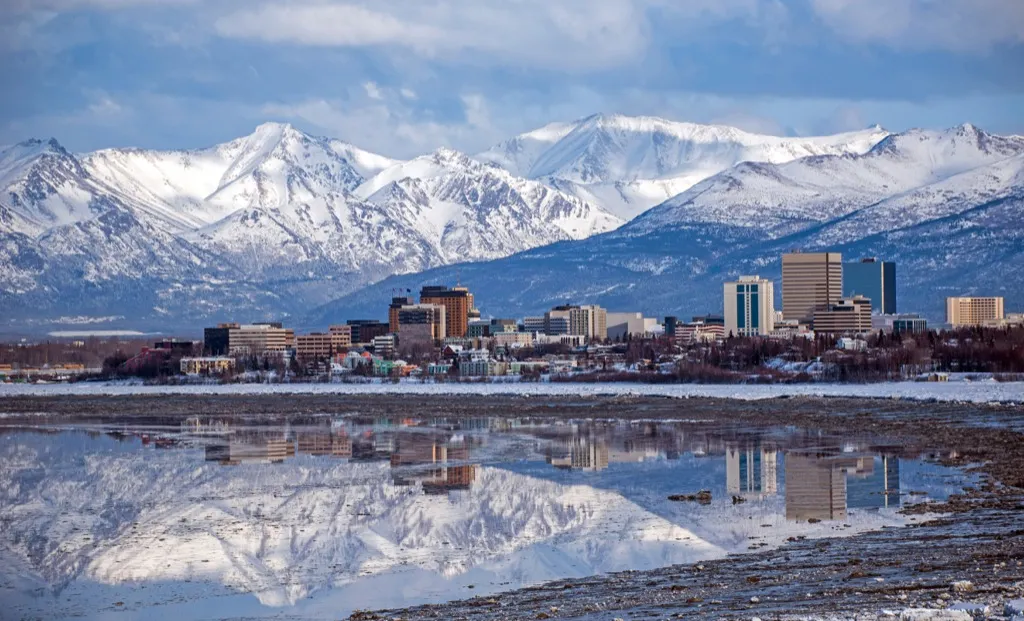
Walkability: 32
Number of Races Within 25 Miles: 11
Parkland as Percent of Adjusted City Area: 20%
Percent of Residents Within 10 Min Walk of Park: 25%
Air Quality Index: 2
Average Temperature: 37°F
Days Per Year with Precipitation: 103
Runner Score: 48.44
33
St. Petersburg, FL
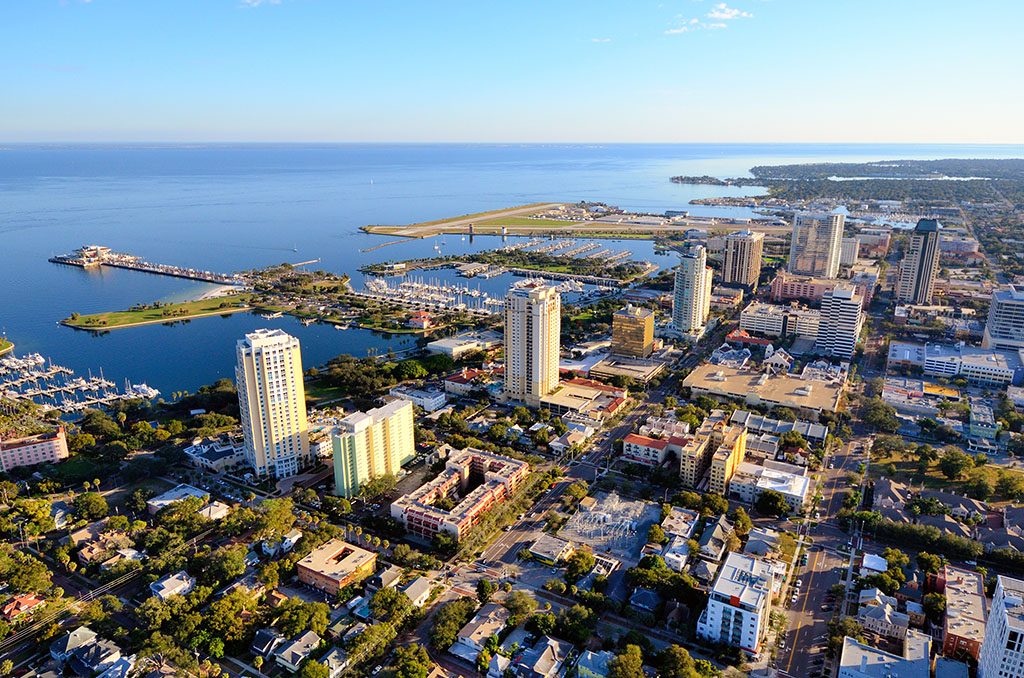
Walkability: 43
Number of Races Within 25 Miles: 119
Parkland as Percent of Adjusted City Area: 16%
Percent of Residents Within 10 Min Walk of Park: 25%
Air Quality Index: 26
Runner Score: 48.64
32
Aurora, CO

Walkability: 43
Number of Races Within 25 Miles: 142
Parkland as Percent of Adjusted City Area: 13%
Percent of Residents Within 10 Min Walk of Park: 33%
Air Quality Index: 35
Runner Score: 48.72
31
Buffalo, NY

Walkability: 68
Number of Races Within 25 Miles: 25
Parkland as Percent of Adjusted City Area: 7%
Percent of Residents Within 10 Min Walk of Park: 22%
Air Quality Index: 23
Average Temperature: 48.25°F
Runner Score: 48.79
30
Las Vegas, NV

Walkability: 41
Number of Races Within 25 Miles: 68
Parkland as Percent of Adjusted City Area: 20%
Percent of Residents Within 10 Min Walk of Park: 24%
Air Quality Index: 31
Average Temperature: 69.3°F
Days Per Year with Precipitation: 21
Runner Score: 49.03
29
Lexington, KY

Walkability: 80
Number of Races Within 25 Miles: 42
Parkland as Percent of Adjusted City Area: 2%
Percent of Residents Within 10 Min Walk of Park: 13%
Average Temperature: 55.55°F
Runner Score: 49.55
28
Louisville, KY

Walkability: 95
Number of Races Within 25 Miles: 37
Parkland as Percent of Adjusted City Area: 7%
Percent of Residents Within 10 Min Walk of Park: 4%
Air Quality Index: 40
Average Temperature: 58.2°F
Runner Score: 50.76
27
San Diego, CA

Walkability: 51
Number of Races Within 25 Miles: 87
Parkland as Percent of Adjusted City Area: 20%
Percent of Residents Within 10 Min Walk of Park: 28%
Air Quality Index: 61
Average Temperature: 63.65°F
Days Per Year with Precipitation: 43
Runner Score: 51.51
26
Albuquerque, NM
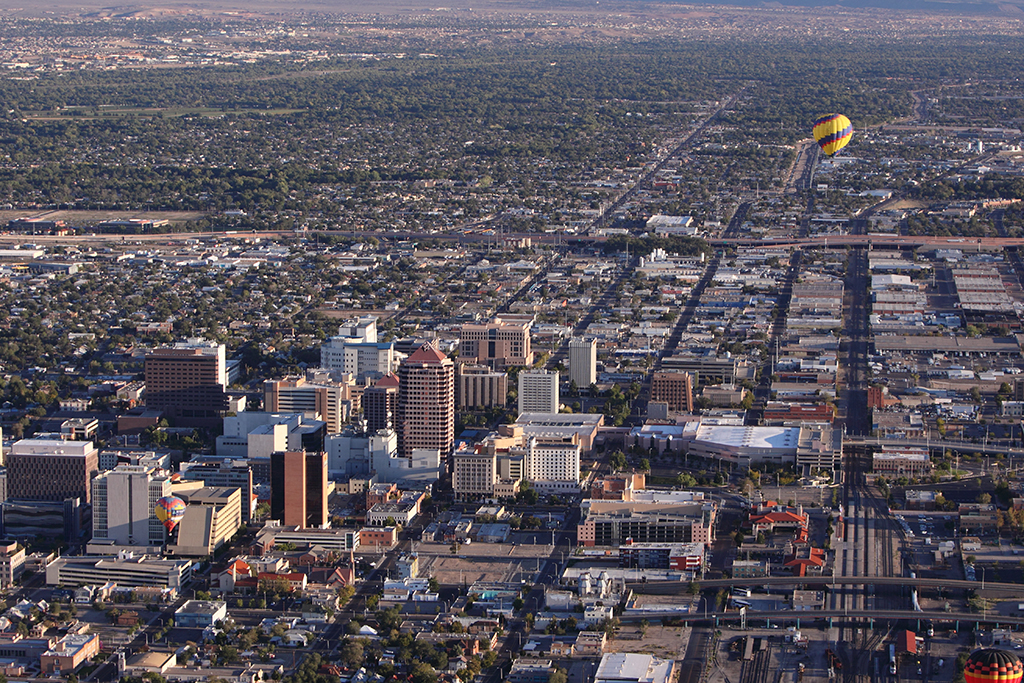
Walkability: 43
Number of Races Within 25 Miles: 35
Parkland as Percent of Adjusted City Area:20%
Percent of Residents Within 10 Min Walk of Park: 31%
Air Quality Index: 29
Average Temperature: 57.1°F
Runner Score: 53.04
25
Madison, WI

Walkability: 49
Number of Races Within 25 Miles: 59
Parkland as Percent of Adjusted City Area: 14%
Percent of Residents Within 10 Min Walk of Park:35%
Air Quality Index: 23
Average Temperature: 46.3°F
Runner Score: 53.64
24
New Orleans, LA
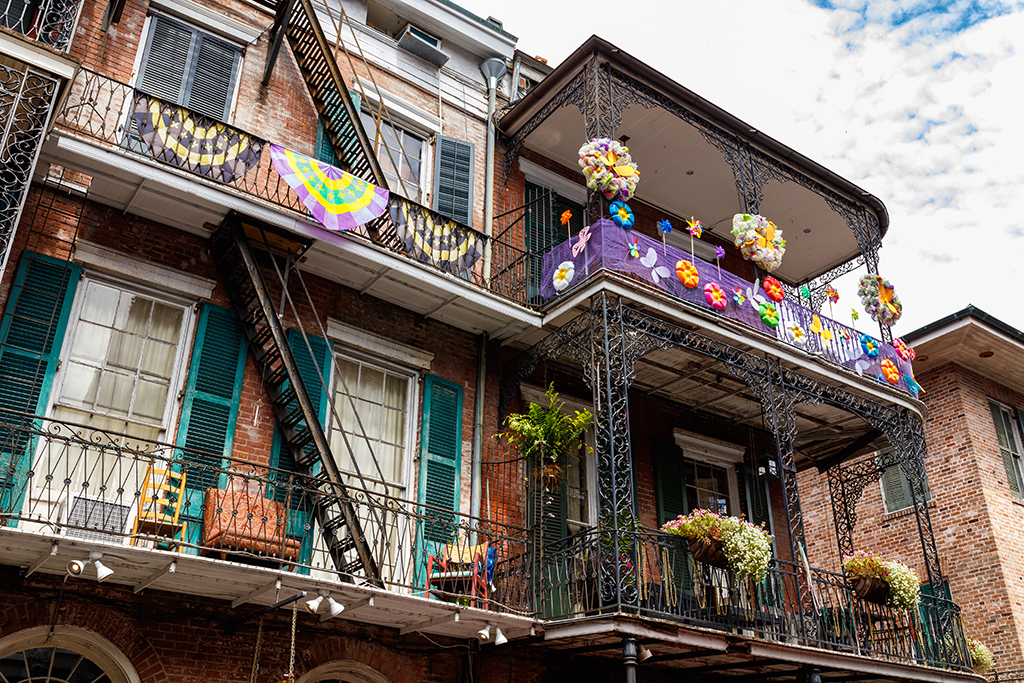
Walkability: 58
Number of Races Within 25 Miles:
Parkland as Percent of Adjusted City Area: 20%
Percent of Residents Within 10 Min Walk of Park: 28%
Air Quality Index: 53
Average Temperature: 69.55°F
Days Per Year with Precipitation: 108
Runner Score: 54.17
23
St. Louis, MO

Walkability: 65
Number of Races Within 25 Miles: 121
Parkland as Percent of Adjusted City Area: 9%
Percent of Residents Within 10 Min Walk of Park: 35%
Air Quality Index: 46
Average Temperature: 54.75°F
Runner Score: 54.36
22
Milwaukee, WI

Walkability: 6
Number of Races Within 25 Miles: 81
Parkland as Percent of Adjusted City Area: 10%
Percent of Residents Within 10 Min Walk of Park: 34%
Air Quality Index: 31
Average Temperature: 47.75°F
Days Per Year with Precipitation: 121
Runner Score: 54.86
21
Long Beach, CA

Walkability: 70
Number of Races Within 25 Miles: 223
Parkland as Percent of Adjusted City Area: 10%
Percent of Residents Within 10 Min Walk of Park: 30%
Air Quality Index: 63
Average Temperature: 64.8°F
Runner Score: 55.08
20
Miami, FL
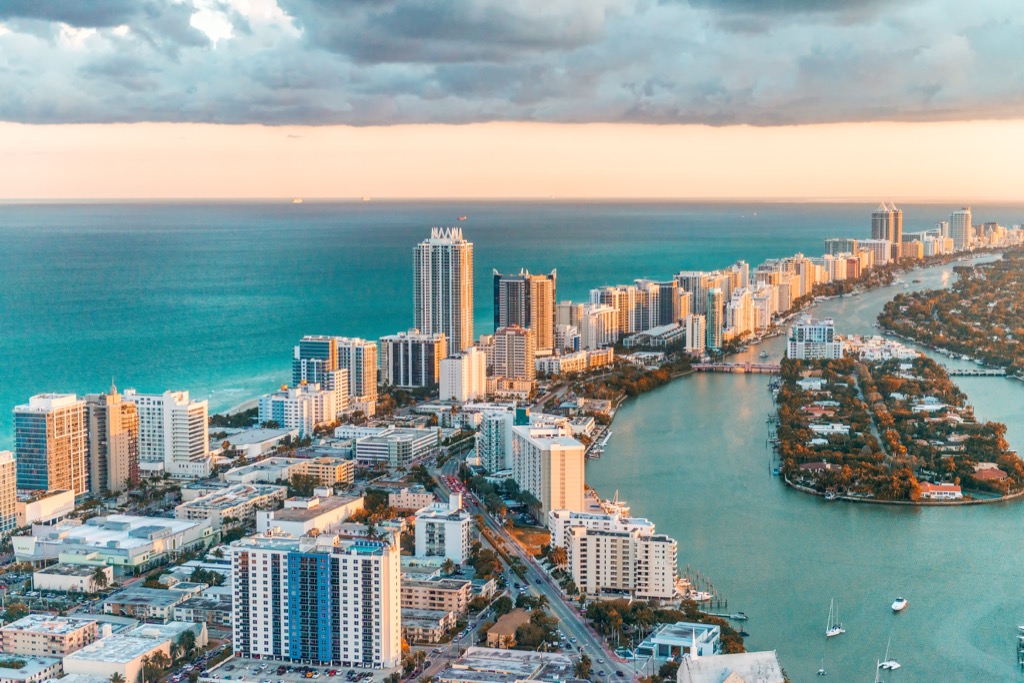
Walkability: 74
Number of Races Within 25 Miles: 103
Parkland as Percent of Adjusted City Area: 6%
Percent of Residents Within 10 Min Walk of Park: 30%
Air Quality Index: 29
Average Temperature: 52.65°F
Runner Score: 55.74
19
Pittsburgh, PA

Walkability: 62
Number of Races Within 25 Miles: 167
Parkland as Percent of Adjusted City Area: 10%
Percent of Residents Within 10 Min Walk of Park: 32%
Air Quality Index: 28
Average Temperature: 52°F
Runner Score: 56.51
18
Nashville, TN

Walkability: 91
Number of Races Within 25 Miles: 81
Parkland as Percent of Adjusted City Area:11%
Percent of Residents Within 10 Min Walk of Park: 7%
Air Quality Index: 33
Average Temperature: 59.25°F
Days Per Year with Precipitation: 119
Runner Score: 56.53
17
Boise, ID

Walkability: 88
Number of Races Within 25 Miles: 24
Parkland as Percent of Adjusted City Area: 8%
Percent of Residents Within 10 Min Walk of Park:19%
Air Quality Index: 22
Average Temperature: 52.5°F
Days Per Year with Precipitation: 82
Runner Score: 58.43
16
Baltimore, MD
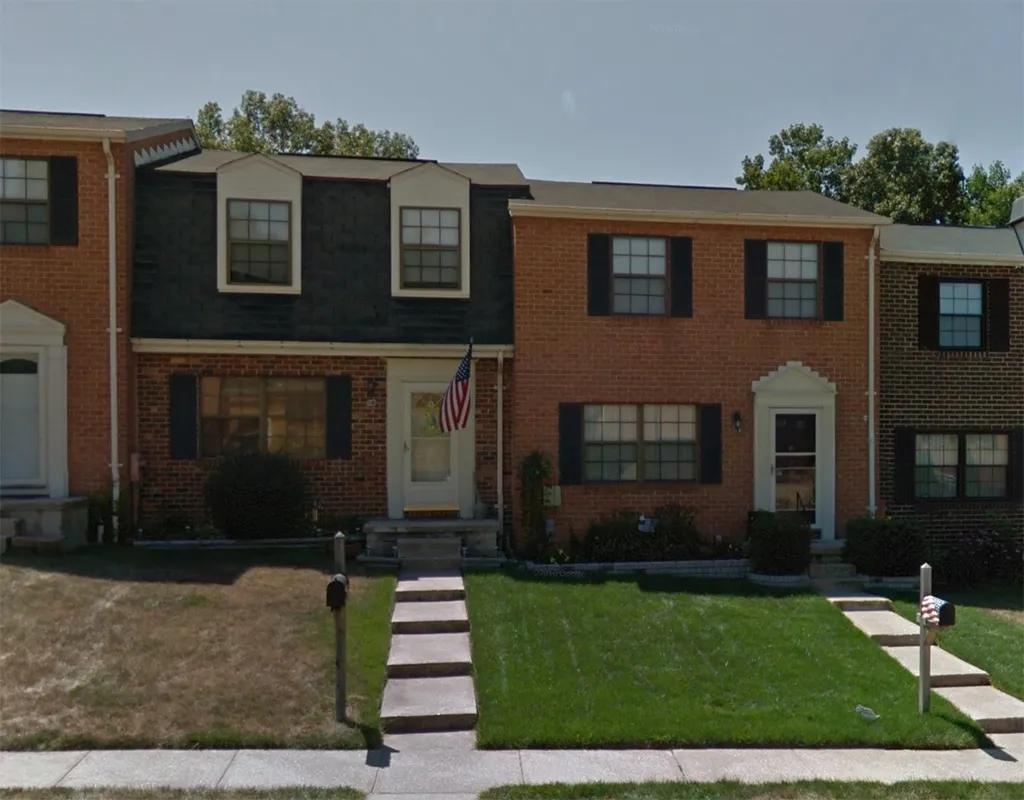
Walkability: 69
Number of Races Within 25 Miles: 181
Parkland as Percent of Adjusted City Area:10%
Percent of Residents Within 10 Min Walk of Park: 32%
Air Quality Index: 28
Average Temperature: 58.45°F
Days Per Year with Precipitation: 111
Runner Score: 60.36
15
Arlington, VA
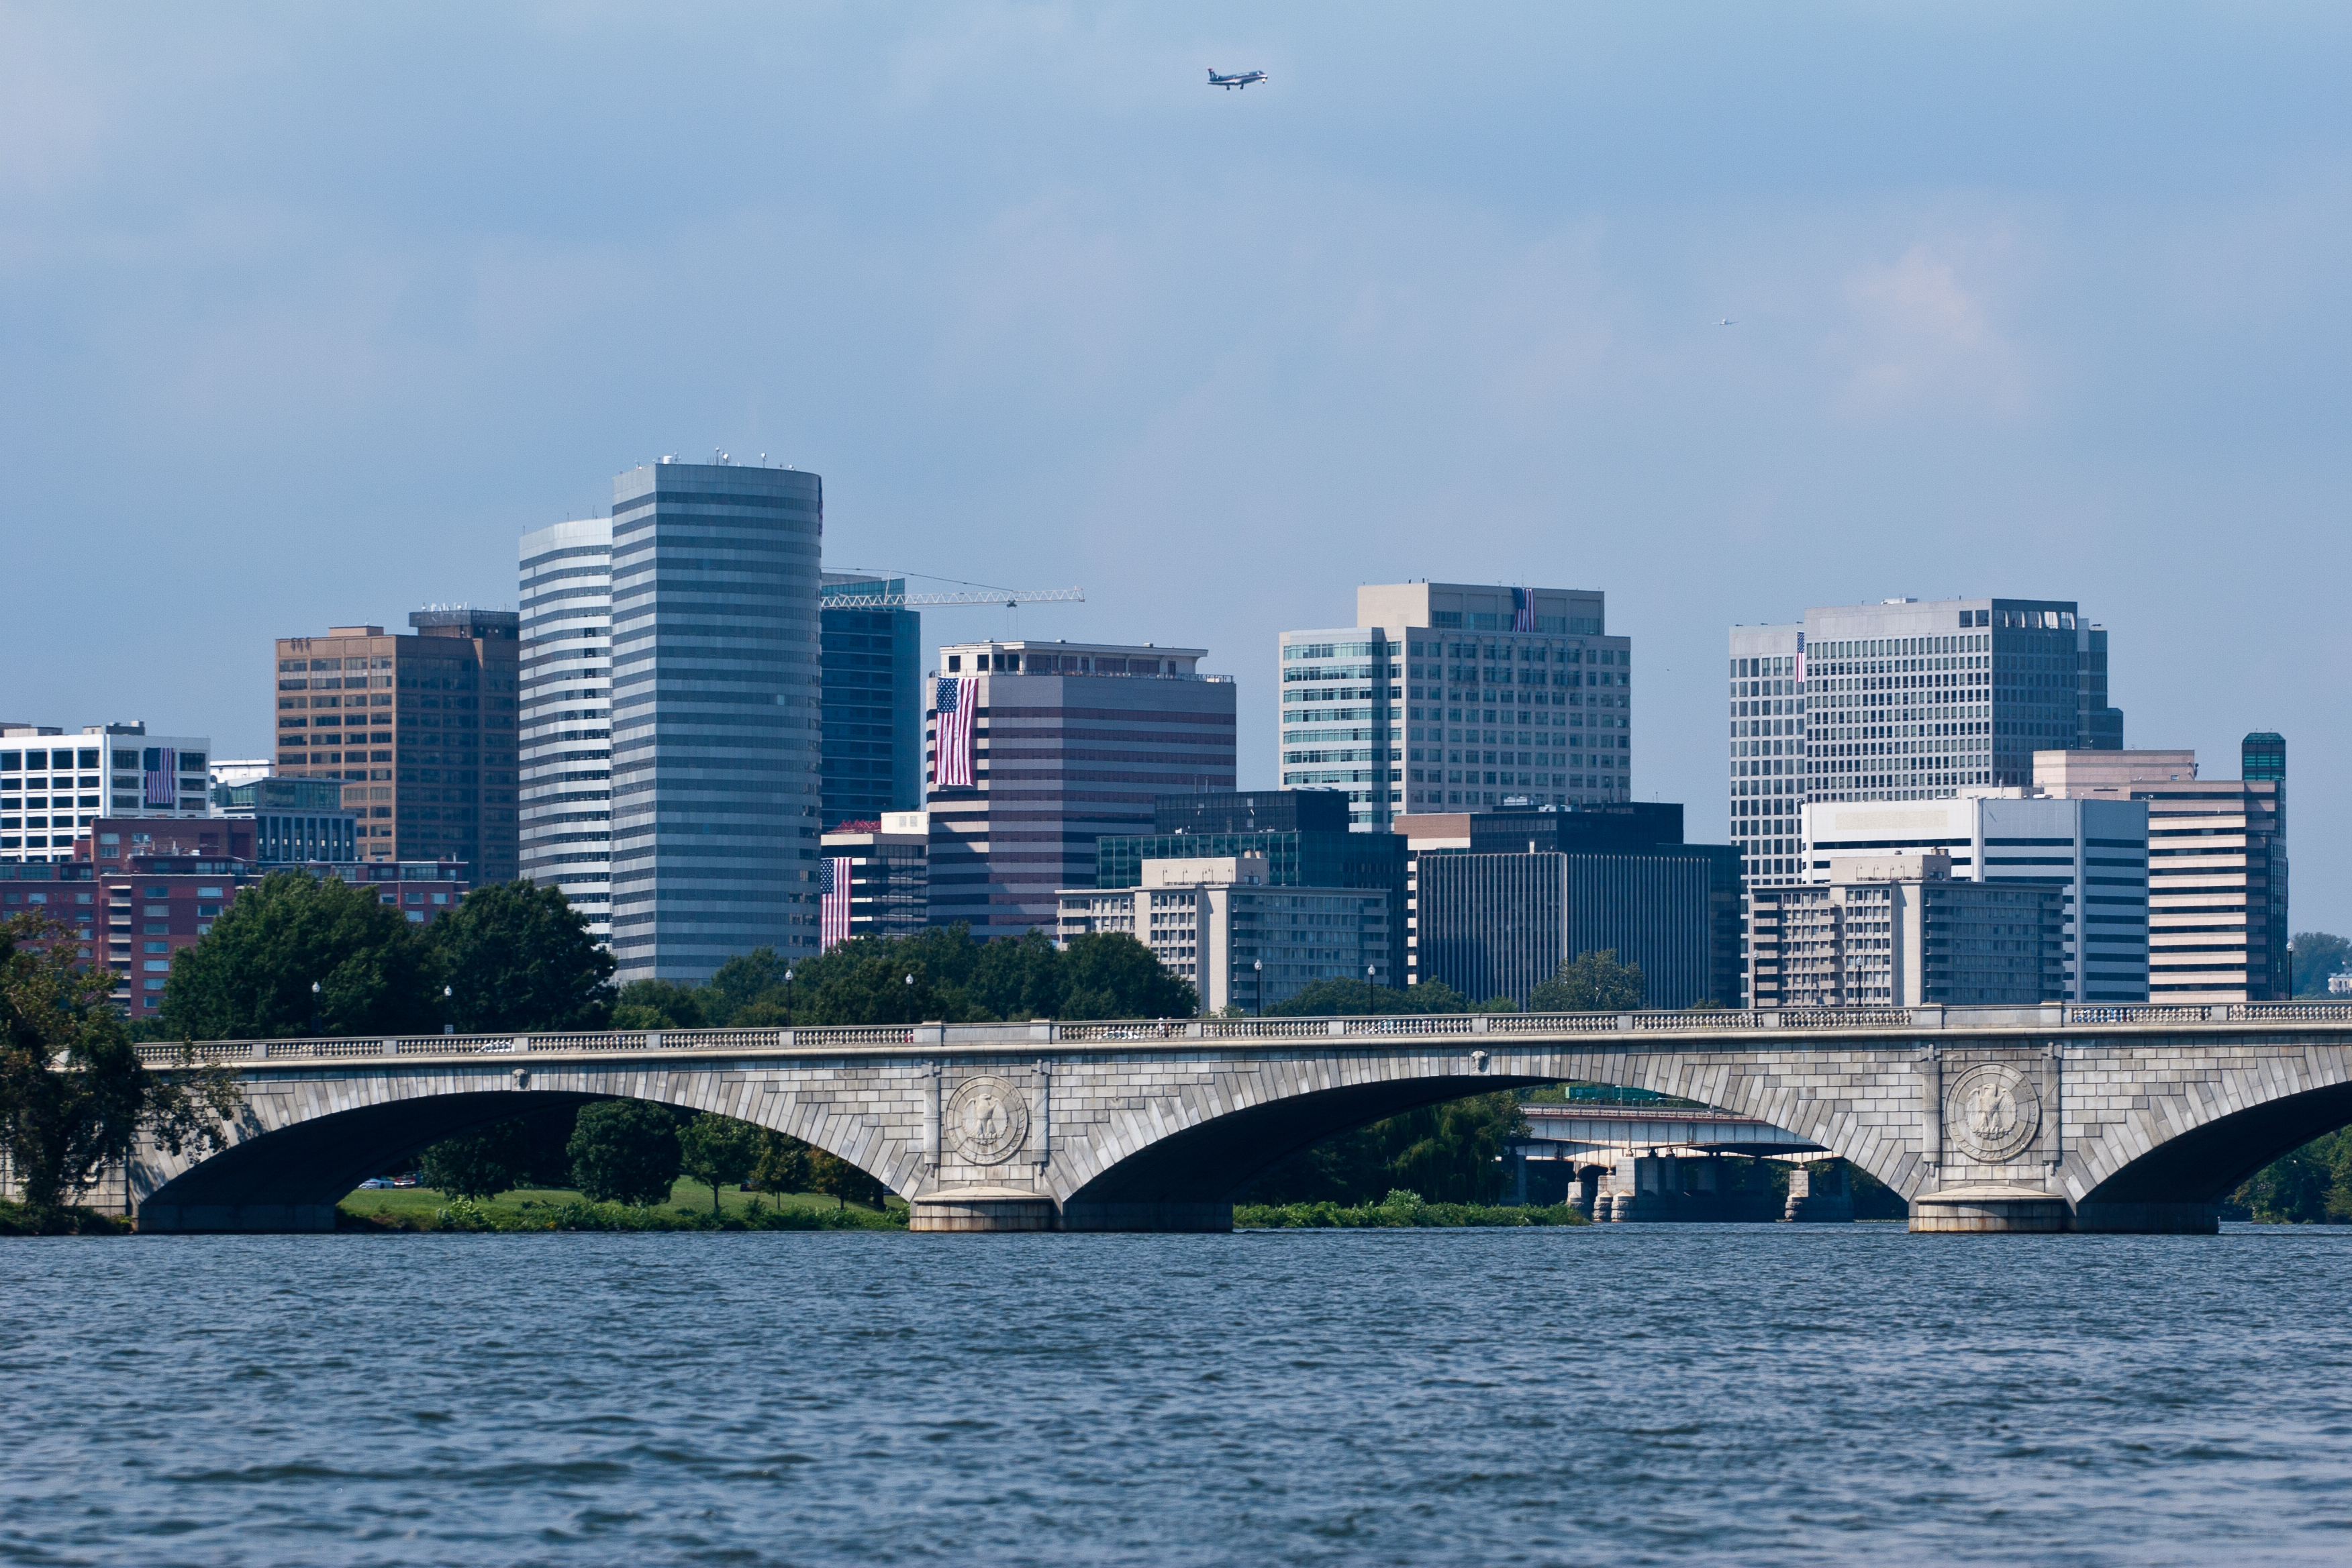
Walkability: 69
Number of Races Within 25 Miles: 254
Parkland as Percent of Adjusted City Area: 11%
Percent of Residents Within 10 Min Walk of Park: 39%
Air Quality Index: 65
Average Temperature: 58.15°F
Runner Score: 60.52
14
Oakland, CA

Walkability: 72
Number of Races Within 25 Miles: 271
Parkland as Percent of Adjusted City Area: 12%
Percent of Residents Within 10 Min Walk of Park: 32%
Air Quality Index: 60
Average Temperature: 59.2°F
Runner Score: 60.78
13
Portland, OR

Walkability: 65
Number of Races Within 25 Miles: 120
Parkland as Percent of Adjusted City Area: 19%
Percent of Residents Within 10 Min Walk of Park: 33%
Air Quality Index: 38
Average Temperature: 54.5°F
Runner Score: 64.67
12
Chicago, IL

Walkability: 78
Number of Races Within 25 Miles: 119
Parkland as Percent of Adjusted City Area: 10%
Percent of Residents Within 10 Min Walk of Park:39%
Air Quality Index: 35
Average Temperature: 51.3°F
Days Per Year with Precipitation: 119
Runner Score: 65.64
11
Minneapolis, MN

Walkability: 69
Number of Races Within 25 Miles: 150
Parkland as Percent of Adjusted City Area: 15%
Percent of Residents Within 10 Min Walk of Park: 39%
Air Quality Index: 32
Average Temperature: 46.15°F
Days Per Year with Precipitation: 112
Runner Score: 67.42
10
Seattle, WA
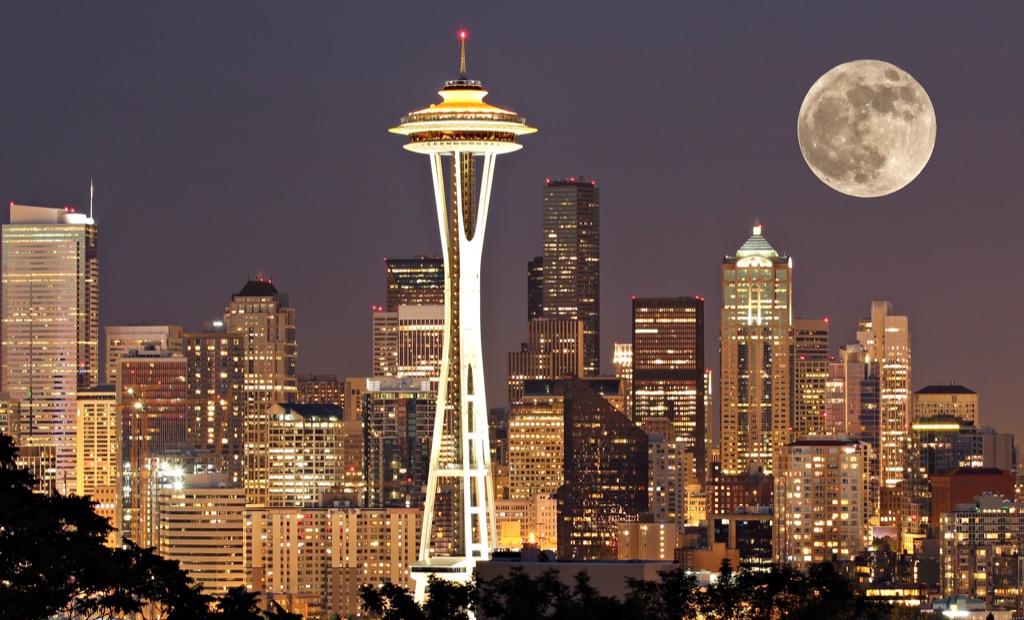
Walkability: 73
Number of Races Within 25 Miles: 136
Parkland as Percent of Adjusted City Area: 13%
Percent of Residents Within 10 Min Walk of Park: 37%
Air Quality Index: 22
Average Temperature: 52.65°F
Days Per Year with Precipitation: 147
Runner Score: 67.73
9
Honolulu, HI

Walkability: 64
Number of Races Within 25 Miles: 34
Parkland as Percent of Adjusted City Area: 20%
Percent of Residents Within 10 Min Walk of Park: 32%
Air Quality Index: 6
Average Temperature: 77.6°F
Days Per Year with Precipitation: 154
Runner Score: 67.85
8
Philadelphia, PA

Walkability: 79
Number of Races Within 25 Miles: 258
Parkland as Percent of Adjusted City Area: 13%
Percent of Residents Within 10 Min Walk of Park: 37%
Air Quality Index: 29
Average Temperature: 55.85°F
Runner Score: 72.62
7
Newark, NJ

Walkability: 80
Number of Races Within 25 Miles: 648
Parkland as Percent of Adjusted City Area: 6%
Percent of Residents Within 10 Min Walk of Park: 35%
Air Quality Index: 24
Average Temperature: 54.9°F
Runner Score: 75.70
6
San Francisco, CA

Walkability: 86
Number of Races Within 25 Miles: 242
Parkland as Percent of Adjusted City Area: 20%
Percent of Residents Within 10 Min Walk of Park: 40%
Air Quality Index: 60
Average Temperature: 57.3°F
Days Per Year with Precipitation: 68
Runner Score: 79.05
5
Washington DC

Walkability: 77
Number of Races Within 25 Miles: 249
Parkland as Percent of Adjusted City Area: 20%
Percent of Residents Within 10 Min Walk of Park: 39%
Air Quality Index: 22
Average Temperature: 55.7°F
Days Per Year with Precipitation: 115
Runner Score: 80.56
4
Boston, MA

Walkability: 81
Number of Races Within 25 Miles: 393
Parkland as Percent of Adjusted City Area: 18%
Percent of Residents Within 10 Min Walk of Park: 39%
Air Quality Index: 18
Average Temperature: 51.4°F
Days Per Year with Precipitation: 120
Runner Score: 84.83
3
Jersey City, NJ

Walkability: 87
Number of Races Within 25 Miles: 653
Parkland as Percent of Adjusted City Area: 19%
Percent of Residents Within 10 Min Walk of Park: 36%
Air Quality Index: 24
Average Temperature: 52.65°F
Runner Score: 92.83
2
New York, NY

Walkability: 89
Number of Races Within 25 Miles: 635
Parkland as Percent of Adjusted City Area: 20%
Percent of Residents Within 10 Min Walk of Park: 39%
Air Quality Index: 21
Average Temperature: 55.15°F
Days Per Year with Precipitation: 121
Runner Score: 96.38
1
Saint Paul, MN

Walkability: 150
Number of Races Within 25 Miles: 150
Parkland as Percent of Adjusted City Area: 16%
Percent of Residents Within 10 Min Walk of Park: 39%
Air Quality Index: 32
Average Temperature: 47.05°F
Days Per Year with Precipitation: 59
Runner Score: 99.40
For more advice on living your best life, follow us on Facebook now!