The 30 Worst Cities for Raising a Kid

There are roughly 759,109 factors that influence how a kid turns out. Setting aside genetics, chief among them is the kind of household mom and dad create. But a close second is the environment—including the zip code—a kid is reared in. Everything from crime and graduation rates to air quality levels and access to exercise can play a significant role. To that end, we dove deep into these figures to ID which cities in the United States are the absolute least ideal for raising a child.
A quick note on the data: it all comes from the County Health Rankings & Roadmaps and the Federal Bureau of Investigation. Most of it is self-explanatory, except for these two. “Disconnected Youth” is the percentage of teens and young adults ages 16 to 24 who are neither working nor in school, while “Severe Housing Problems” lists the percentage of households with severe problems, like overcrowding, inadequate kitchen area, or a lack of plumbing. If you’re looking to raise a family, you might want to pack your bags first. And for more amazing parenting advice, learn all about the 20 Biggest Regrets Nearly Every Parent Has.
30
Rancho Cucamonga, CA
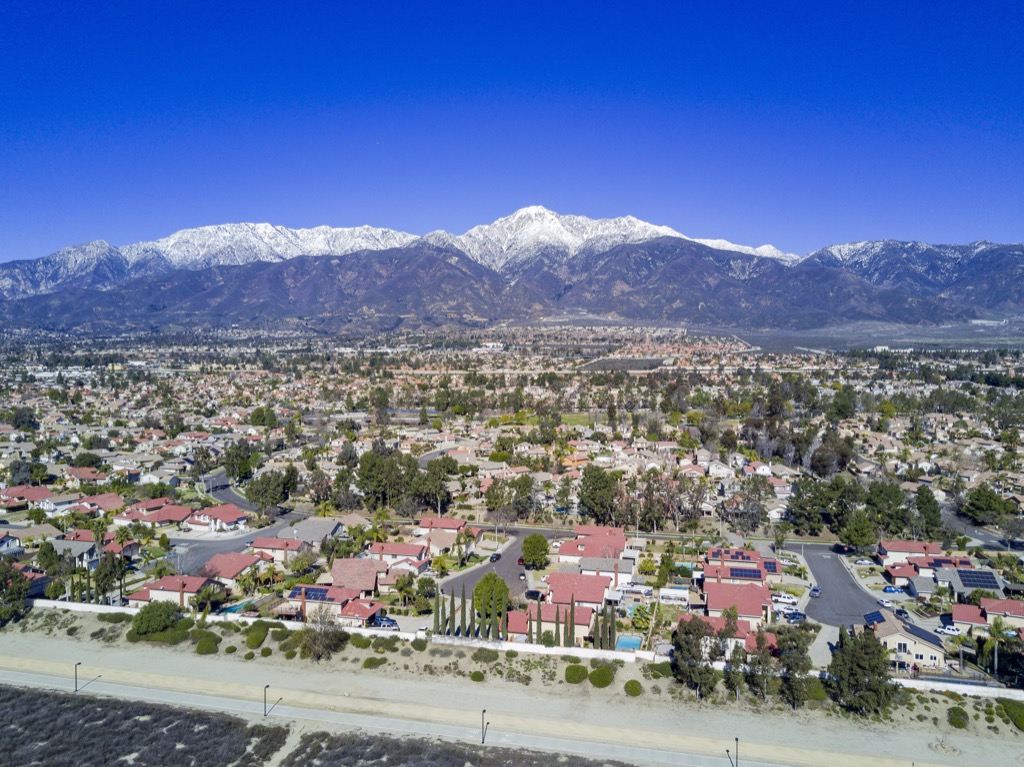
Population: 176,534
High School Graduation Rate: 81%
Disconnected Youth: 19%
Excessive Drinking: 18%
Food Environment Index (1–10): 14.2
Access to Exercise Opportunities: 84%
Air Pollution (average daily PM2.5): 14.2
Severe Housing Problems: 28%
Violent Crime Rate (per 100K people): 150.68
Raising Kids Index: 50.79
And for more rankings of American zip codes, here are The 50 Most Caffeinated Cities in America.
29
Lancaster, CA

Population: 160,106
High School Graduation Rate: 79%
Disconnected Youth: 14%
Excessive Drinking: 17%
Food Environment Index (1–10): 14.4
Access to Exercise Opportunities: 94%
Air Pollution (average daily PM2.5): 14.4
Severe Housing Problems: 34%
Violent Crime Rate (per 100K people): 688.92
Raising Kids Index: 50.01
You’d also have a pretty long drive living here, as Lancaster is one of The 50 Cities with the Worst Commutes in America.
28
Los Angeles, CA
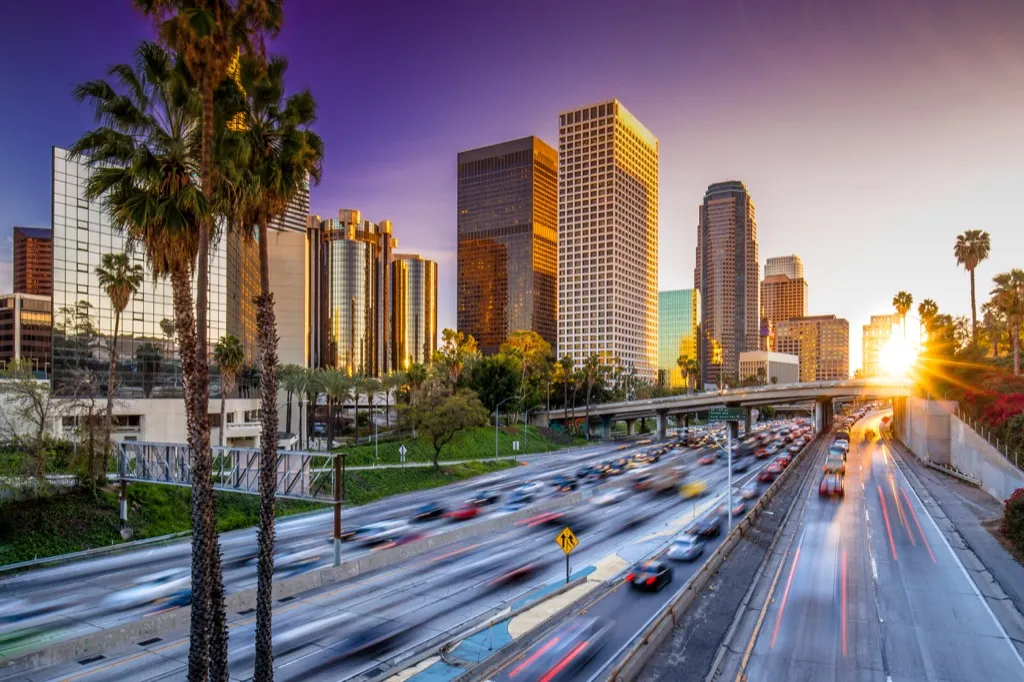
Population: 3,976,322
High School Graduation Rate: 79%
Disconnected Youth: 14%
Excessive Drinking: 17%
Food Environment Index (1–10): 14.4
Access to Exercise Opportunities: 94%
Air Pollution (average daily PM2.5): 14.4
Severe Housing Problems: 34%
Violent Crime Rate (per 100K people): 724.71
Raising Kids Index: 49.65
27
Montgomery, AL
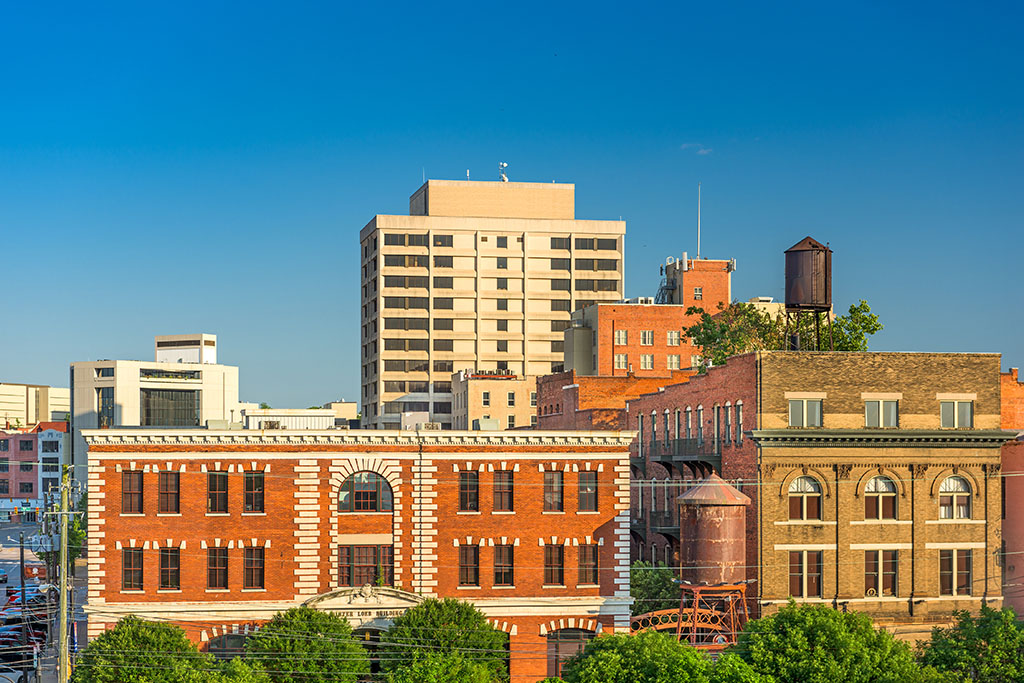
Population: 200,022
High School Graduation Rate: 79%
Disconnected Youth: 16%
Excessive Drinking: 16%
Food Environment Index (1–10): 11.2
Access to Exercise Opportunities: 75%
Air Pollution (average daily PM2.5): 11.2
Severe Housing Problems: 19%
Violent Crime Rate (per 100K people): 607.43
Raising Kids Index: 49.63
Might be best to keep kids away from here, since Montgomery is also one of the The 100 Drunkest Cities in America.
26
Augusta, GA
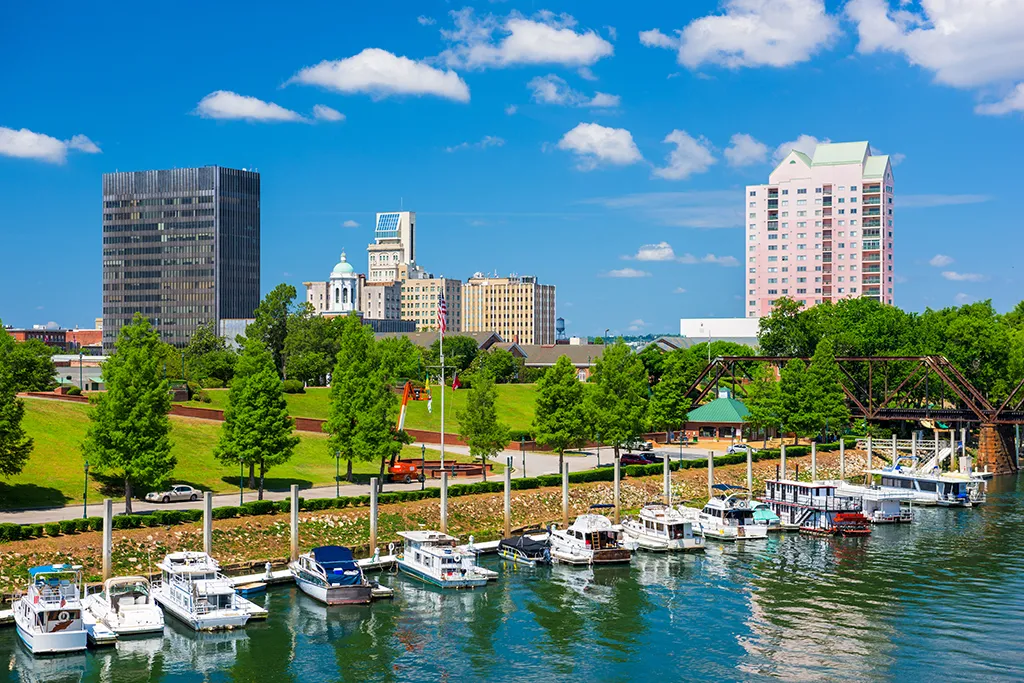
Population: 197,081
High School Graduation Rate: 78%
Disconnected Youth: 22%
Excessive Drinking: 15%
Food Environment Index (1–10): 11.2
Access to Exercise Opportunities: 71%
Air Pollution (average daily PM2.5): 11.2
Severe Housing Problems: 20%
Violent Crime Rate (per 100K people): 11.16
Raising Kids Index: 49.59
25
Mobile, AL
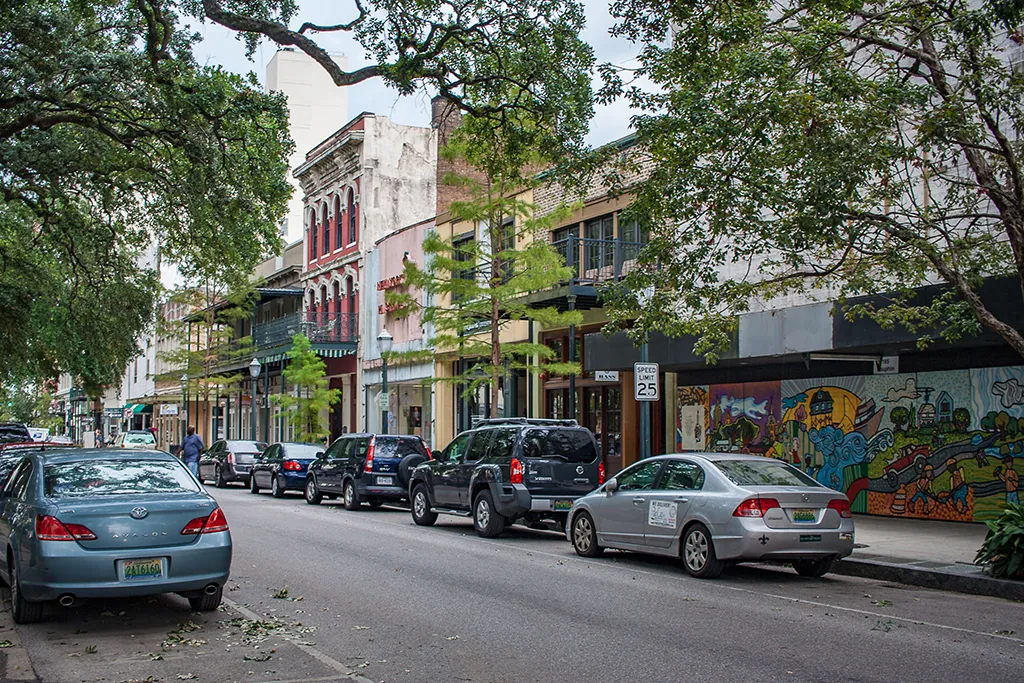
Population: 192,904
High School Graduation Rate: 86%
Disconnected Youth: 20%
Excessive Drinking: 16%
Food Environment Index (1–10): 10
Access to Exercise Opportunities: 73%
Air Pollution (average daily PM2.5): 10
Severe Housing Problems: 18%
Violent Crime Rate (per 100K people): 885.93
Raising Kids Index: 49.54
24
Ontario, CA
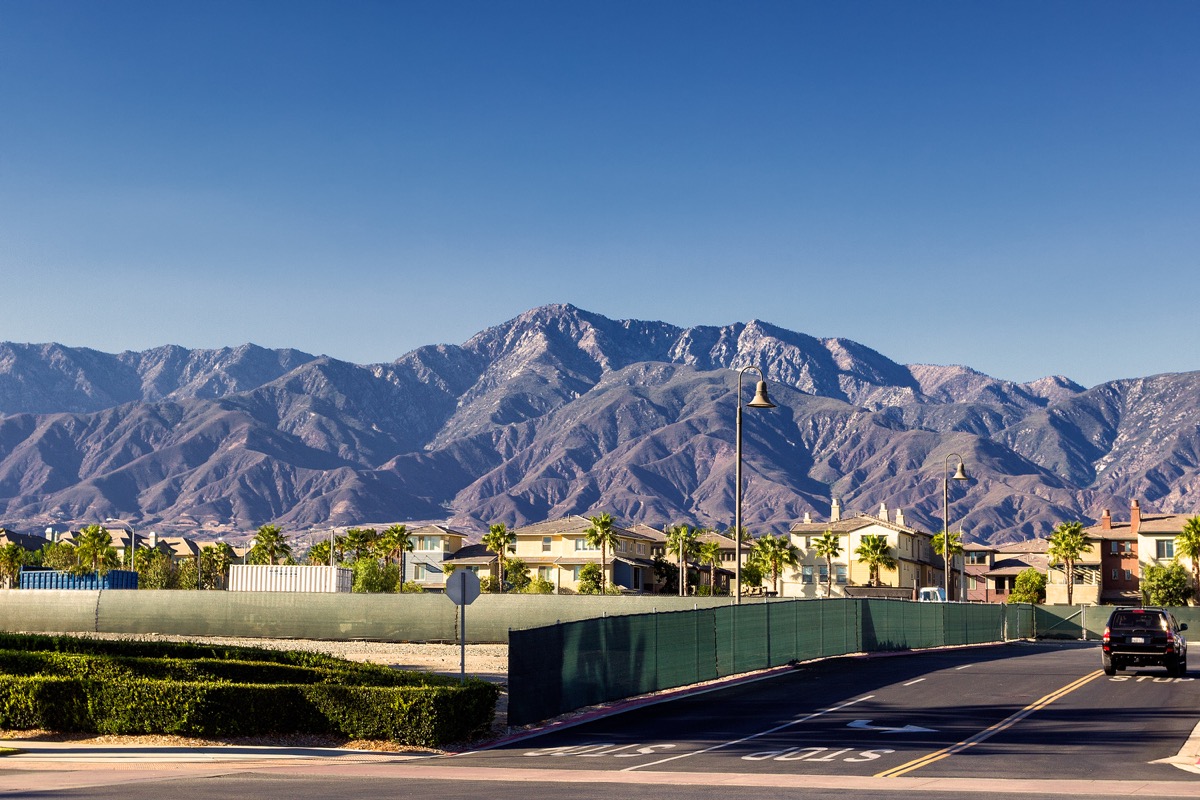
Population: 173,212
High School Graduation Rate: 81%
Disconnected Youth: 19%
Excessive Drinking: 18%
Food Environment Index (1–10): 14.2
Access to Exercise Opportunities: 84%
Air Pollution (average daily PM2.5): 14.2
Severe Housing Problems: 28%
Violent Crime Rate (per 100K people): 347.55
Raising Kids Index: 48.82
23
Shreveport, LA
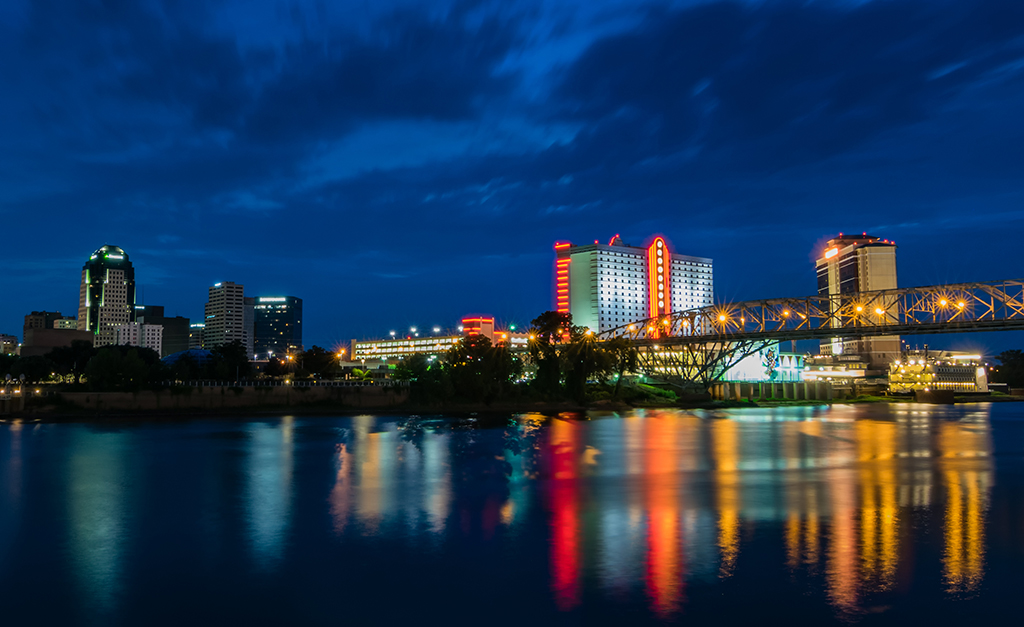
Population: 194,920
High School Graduation Rate: 75%
Disconnected Youth: 20%
Excessive Drinking: 15%
Food Environment Index (1–10): 11.2
Access to Exercise Opportunities: 84%
Air Pollution (average daily PM2.5): 11.2
Severe Housing Problems: 17%
Violent Crime Rate (per 100K people): 956.80
Raising Kids Index: 48.63
22
McAllen, TX
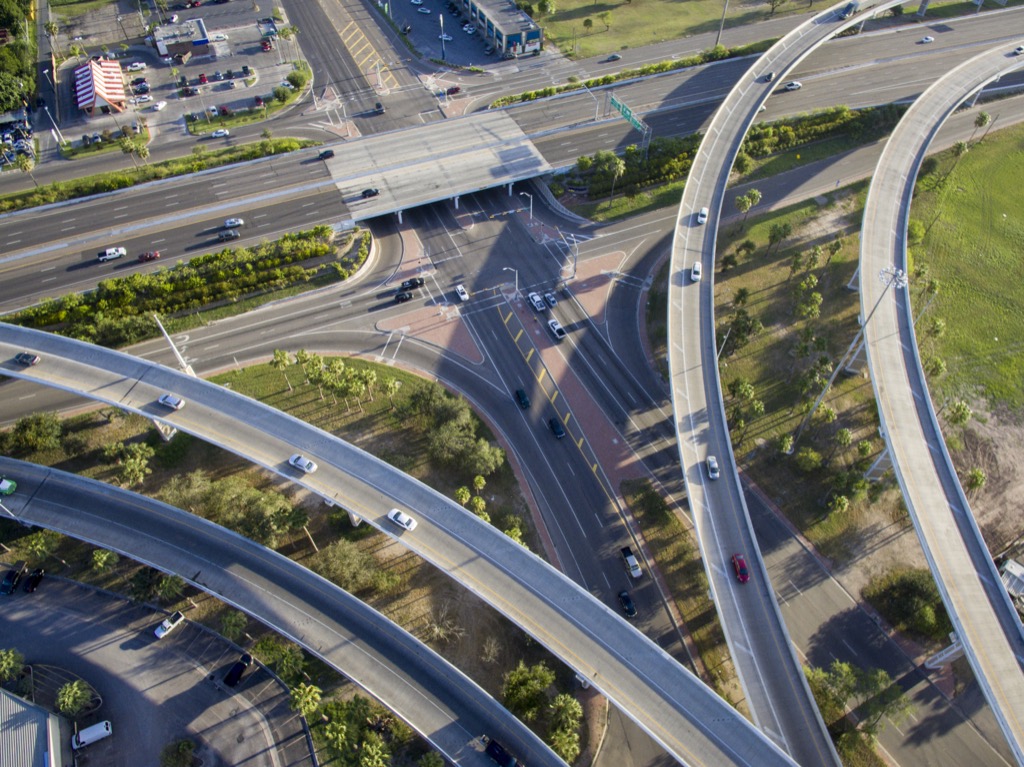
Population: 142,212
High School Graduation Rate: 87%
Disconnected Youth: 19%
Excessive Drinking: 14%
Food Environment Index (1–10): 8.9
Access to Exercise Opportunities: 62%
Air Pollution (average daily PM2.5): 8.9
Severe Housing Problems: 28%
Violent Crime Rate (per 100K people): 151.18
Raising Kids Index: 48.49
21
Albuquerque, NM
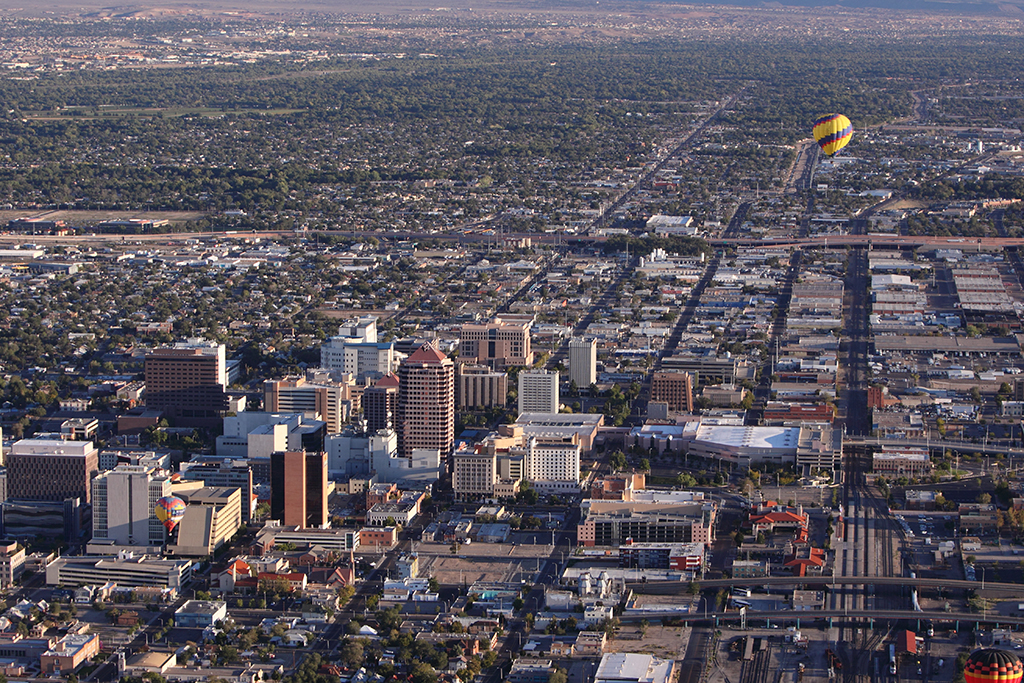
Population: 559,277
High School Graduation Rate: 62%
Disconnected Youth: 14%
Excessive Drinking: 16%
Food Environment Index (1–10): 8.5
Access to Exercise Opportunities: 92%
Air Pollution (average daily PM2.5): 8.5
Severe Housing Problems: 19%
Violent Crime Rate (per 100K people): 1,116.62
Raising Kids Index: 48.23
20
Fontana, CA
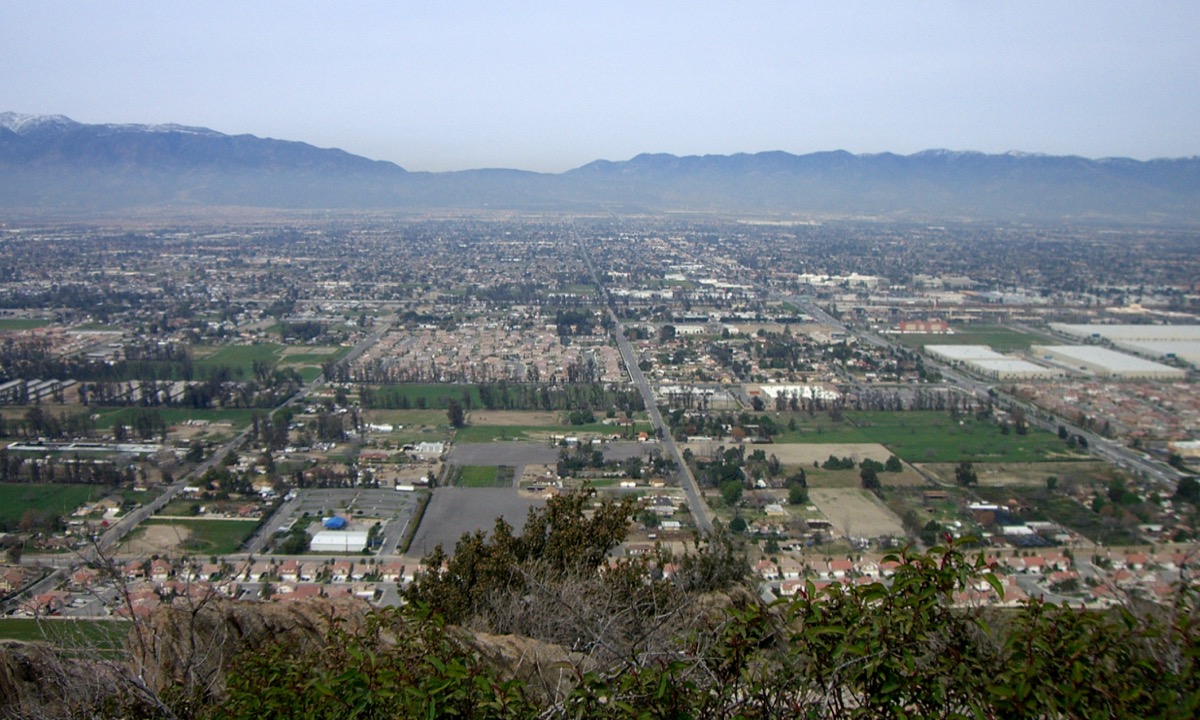
Population: 209,665
High School Graduation Rate: 81%
Disconnected Youth: 19%
Excessive Drinking: 18%
Food Environment Index (1–10): 14.2
Access to Exercise Opportunities: 84%
Air Pollution (average daily PM2.5): 14.2
Severe Housing Problems: 28%
Violent Crime Rate (per 100K people): 414.95
Raising Kids Index: 48.15
19
Cleveland, OH
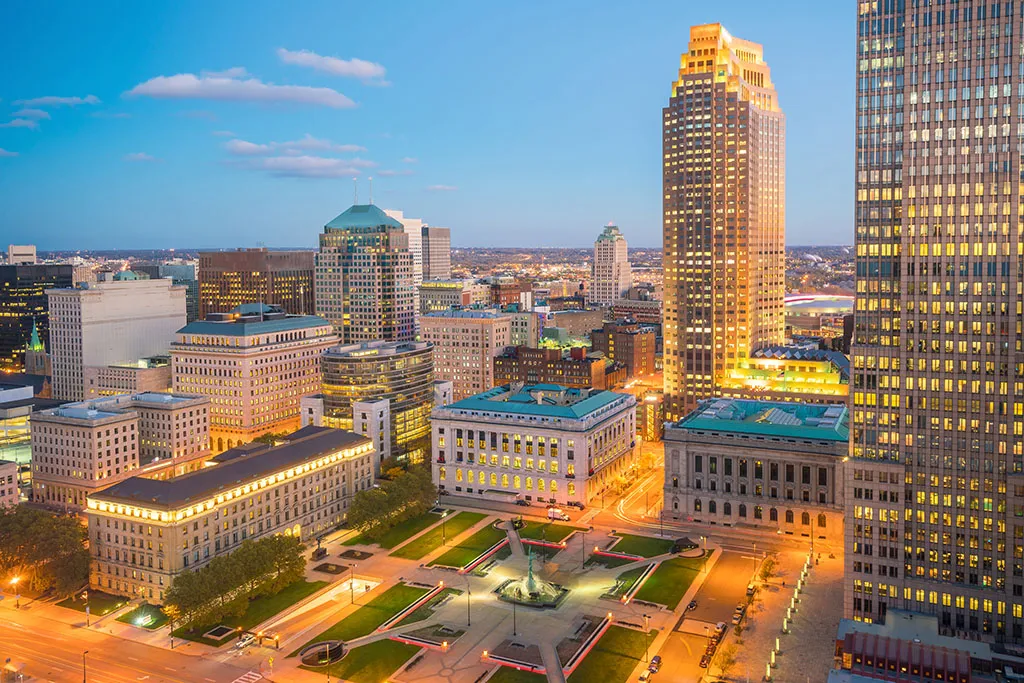
Population: 385,809
High School Graduation Rate: 75%
Disconnected Youth: 15%
Excessive Drinking: 17%
Food Environment Index (1–10): 12.9
Access to Exercise Opportunities: 96%
Air Pollution (average daily PM2.5): 12.9
Severe Housing Problems: 19%
Violent Crime Rate (per 100K people): 1,632.67
Raising Kids Index: 47.87
18
Rockford, IL
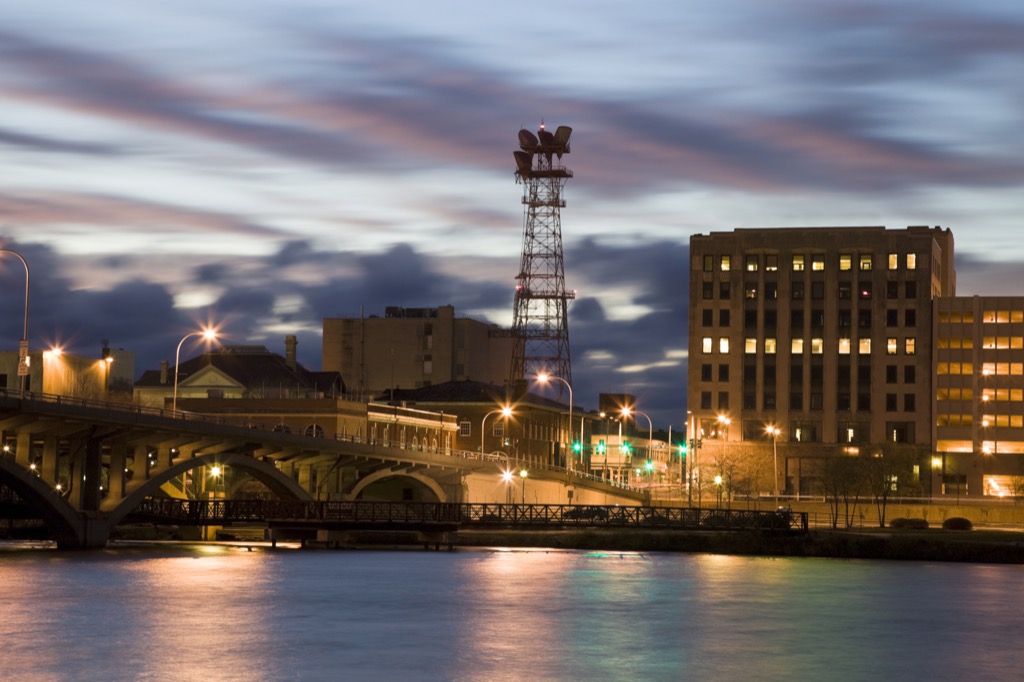
Population: 147,651
High School Graduation Rate: 74%
Disconnected Youth: 18%
Excessive Drinking: 18%
Food Environment Index (1–10): 10.5
Access to Exercise Opportunities: 93%
Air Pollution (average daily PM2.5): 10.5
Severe Housing Problems: 17%
Violent Crime Rate (per 100K people): 1,655.25
Raising Kids Index: 46.65
You might also want to steer clear, since Rockford is also one of The 25 U.S. Cities with the Worst Drinking Water.
17
Milwaukee, WI
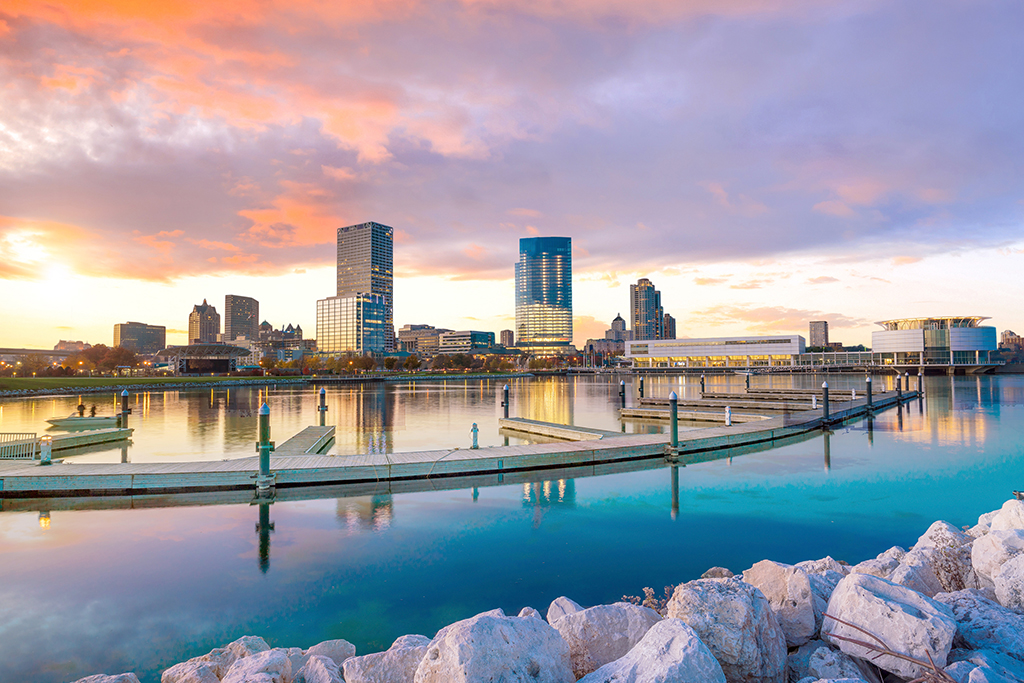
Population: 595,047
High School Graduation Rate: 74%
Disconnected Youth: 15%
Excessive Drinking: 25%
Food Environment Index (1–10): 10.7
Access to Exercise Opportunities: 99%
Air Pollution (average daily PM2.5): 10.7
Severe Housing Problems: 22%
Violent Crime Rate (per 100K people): 1,546.26
Raising Kids Index: 46.64
16
Philadelphia, PA

Population: 1,567,872
High School Graduation Rate: 70%
Disconnected Youth: 20%
Excessive Drinking: 22%
Food Environment Index (1–10): 11.2
Access to Exercise Opportunities: 97%
Air Pollution (average daily PM2.5): 11.2
Severe Housing Problems: 24%
Violent Crime Rate (per 100K people): 990.77
Raising Kids Index: 46.09
15
Washington D.C.

Population: 681,170
High School Graduation Rate: 68%
Disconnected Youth: 16%
Excessive Drinking: 28%
Food Environment Index (1–10): 10.9
Access to Exercise Opportunities: 100%
Air Pollution (average daily PM2.5): 10.9
Severe Housing Problems: 22%
Violent Crime Rate (per 100K people): 1,132.02
Raising Kids Index: 45.58
14
Toledo, OH
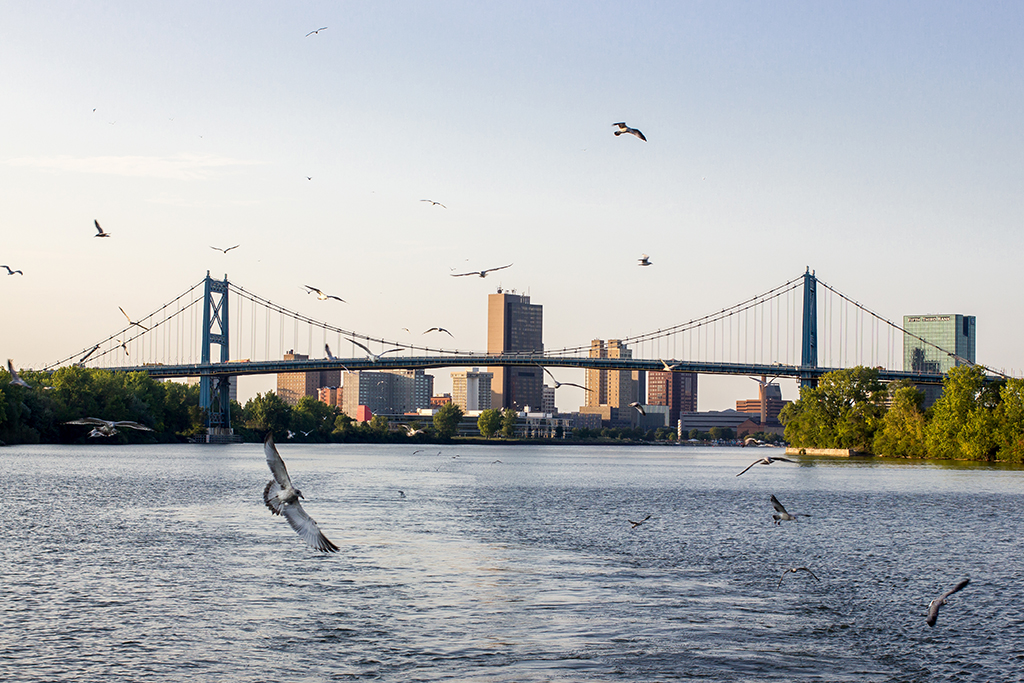
Population: 278,508
High School Graduation Rate: 60%
Disconnected Youth: 14%
Excessive Drinking: 19%
Food Environment Index (1–10): 11.4
Access to Exercise Opportunities: 95%
Air Pollution (average daily PM2.5): 11.4
Severe Housing Problems: 17%
Violent Crime Rate (per 100K people): 1,191.71
Raising Kids Index: 44.68
13
Memphis, TN
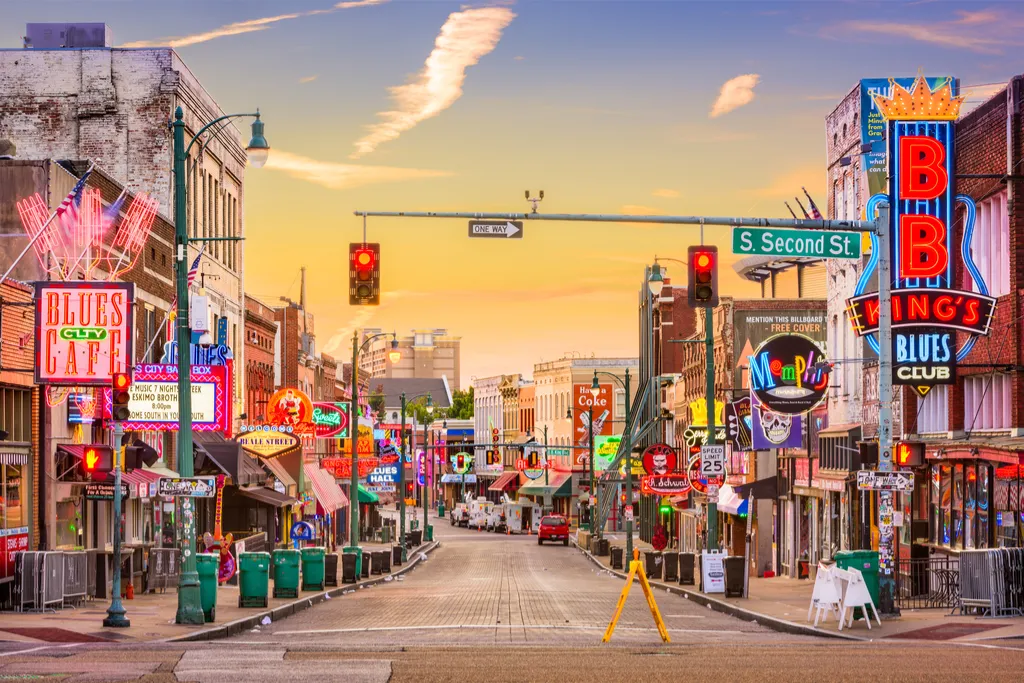
Population: 652,717
High School Graduation Rate: 78%
Disconnected Youth: 19%
Excessive Drinking: 13%
Food Environment Index (1–10): 9.8
Access to Exercise Opportunities: 87%
Air Pollution (average daily PM2.5): 9.8
Severe Housing Problems: 21%
Violent Crime Rate (per 100K people): 1,830.35
Raising Kids Index: 44.40
12
Bakersfield, CA
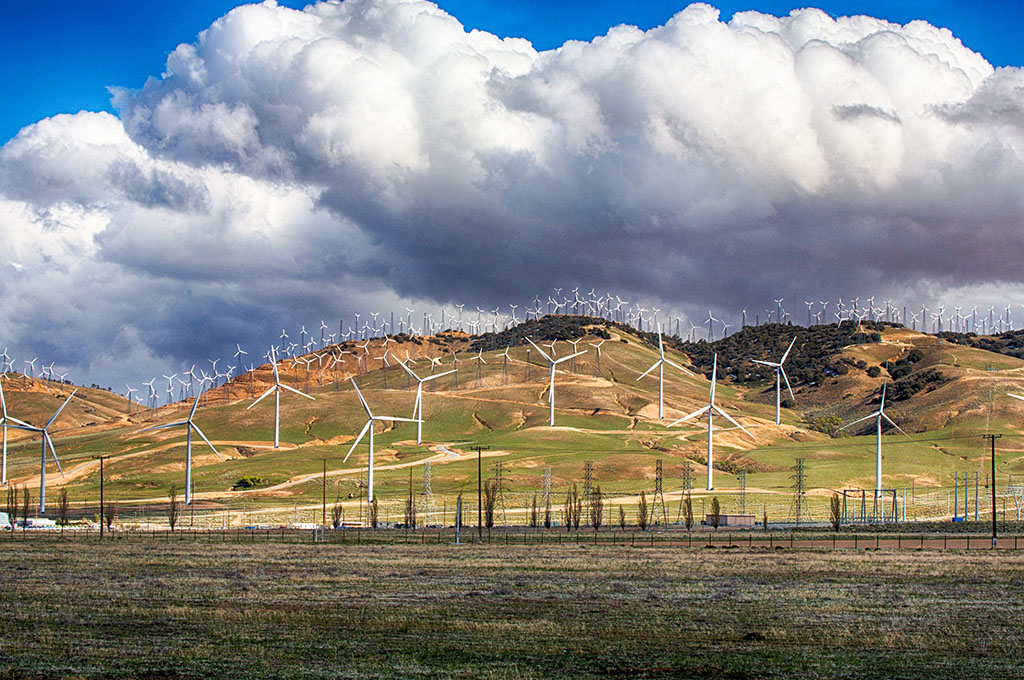
Population: 376,380
High School Graduation Rate: 83%
Disconnected Youth: 22%
Excessive Drinking: 19%
Food Environment Index (1–10): 13.9
Access to Exercise Opportunities: 78%
Air Pollution (average daily PM2.5): 13.9
Severe Housing Problems: 26%
Violent Crime Rate (per 100K people): 483.82
Raising Kids Index: 44.36
11
Fresno, CA
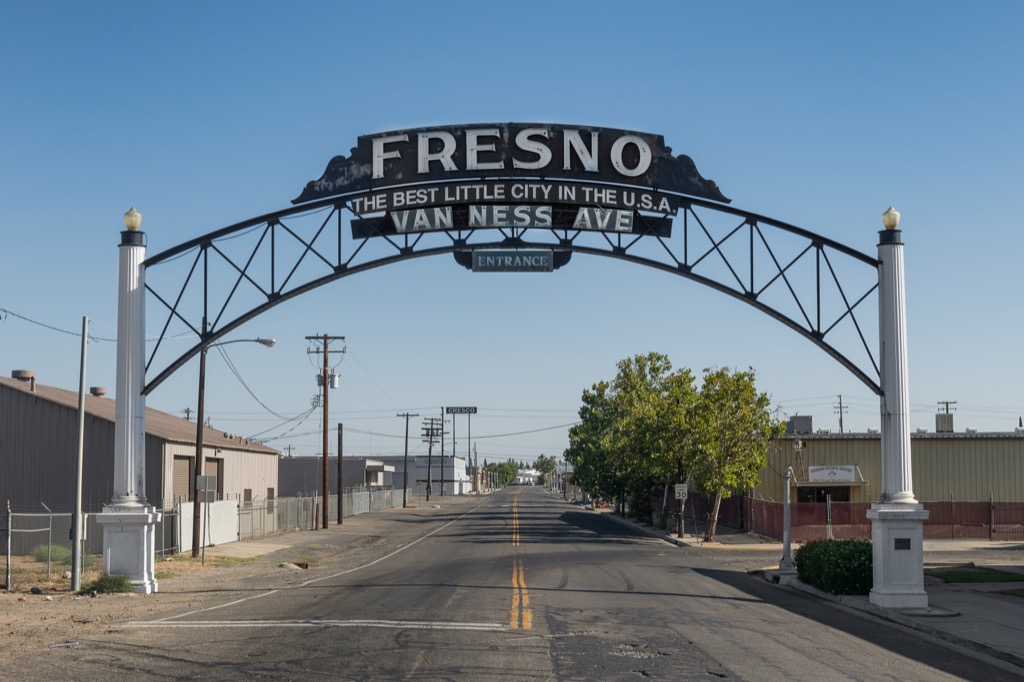
Population: 522,053
High School Graduation Rate: 82%
Disconnected Youth: 19%
Excessive Drinking: 16%
Food Environment Index (1–10): 14.3
Access to Exercise Opportunities: 79%
Air Pollution (average daily PM2.5): 14.3
Severe Housing Problems: 29%
Violent Crime Rate (per 100K people): 614.11
Raising Kids Index: 44.16
10
Little Rock, AR
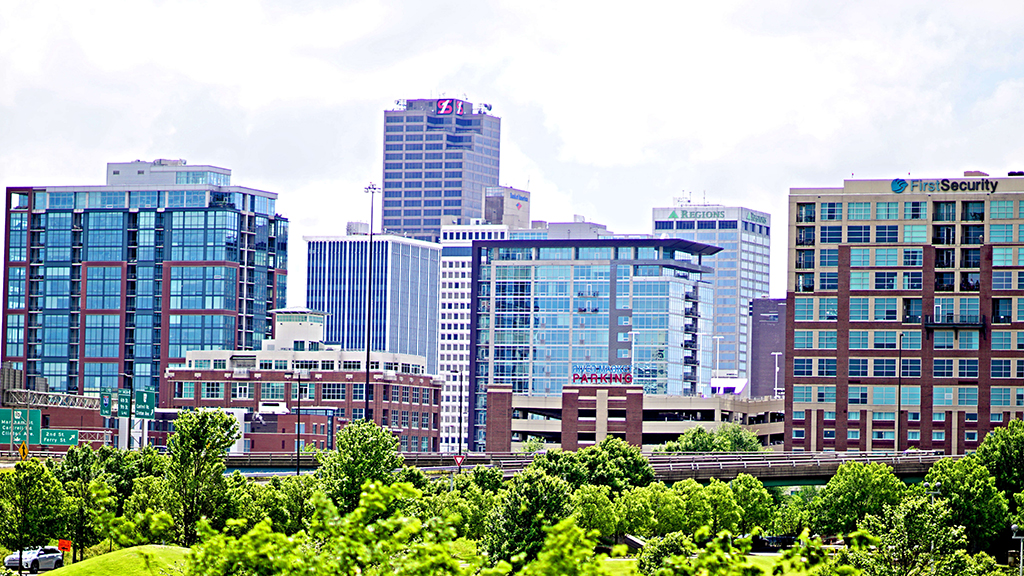
Population: 198,541
High School Graduation Rate: 72%
Disconnected Youth: 16%
Excessive Drinking: 16%
Food Environment Index (1–10): 12.2
Access to Exercise Opportunities: 87%
Air Pollution (average daily PM2.5): 12.2
Severe Housing Problems: 16%
Violent Crime Rate (per 100K people): 1,533.18
Raising Kids Index: 43.87
9
Baltimore, MD
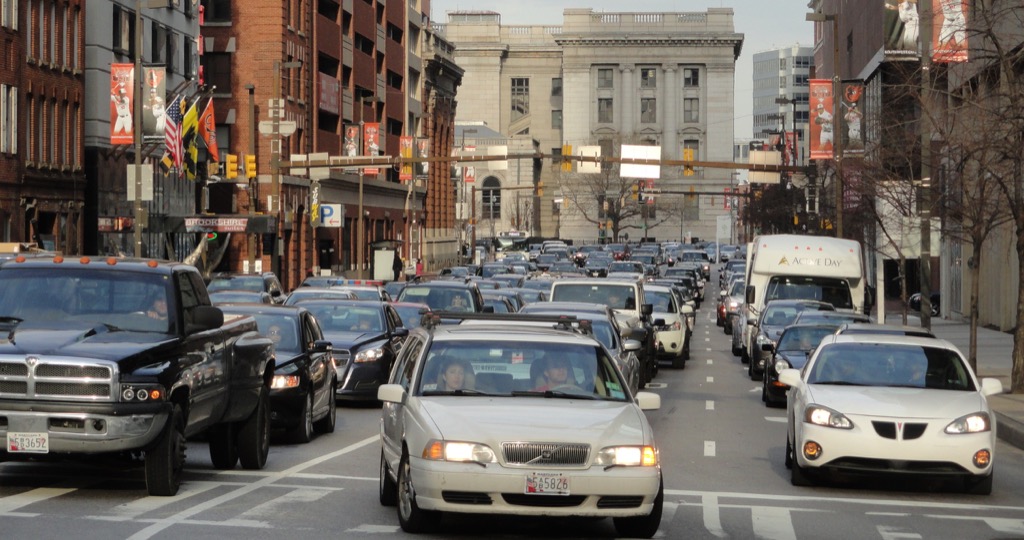
Population: 614,664
High School Graduation Rate: 70%
Disconnected Youth: 19%
Excessive Drinking: 18%
Food Environment Index (1–10): 10.3
Access to Exercise Opportunities: 99%
Air Pollution (average daily PM2.5): 10.3
Severe Housing Problems: 23%
Violent Crime Rate (per 100K people): 1,791.22
Raising Kids Index: 43.19
8
Indianapolis, IN
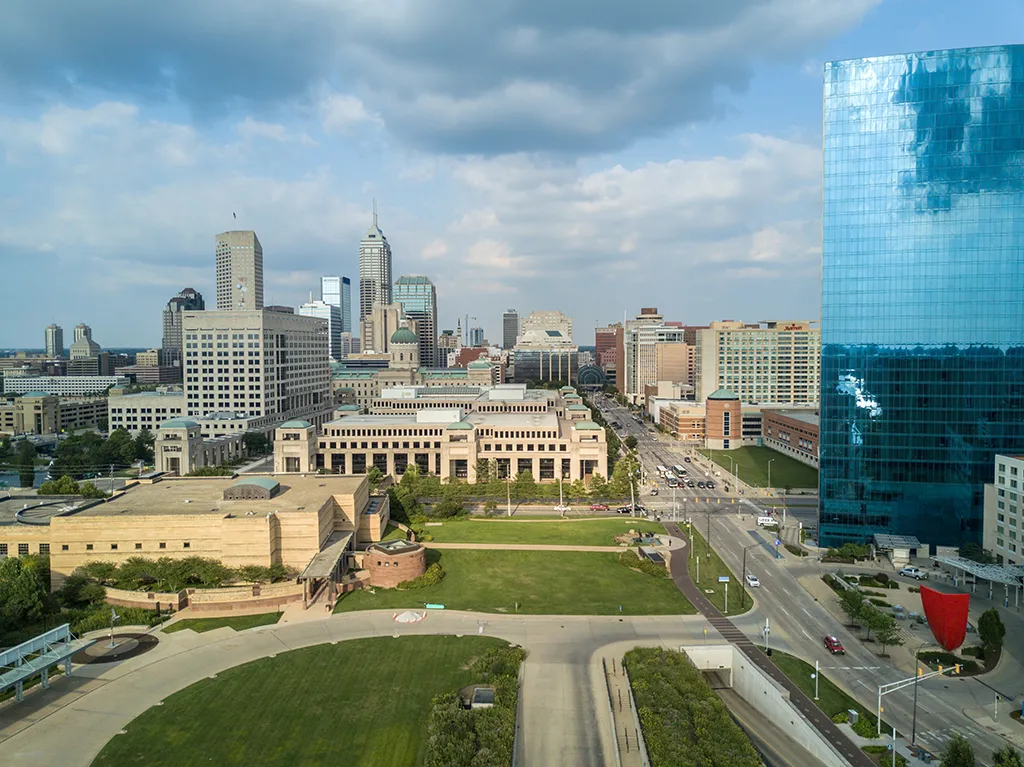
Population: 855,164
High School Graduation Rate: 72%
Disconnected Youth: 16%
Excessive Drinking: 19%
Food Environment Index (1–10): 12.3
Access to Exercise Opportunities: 87%
Air Pollution (average daily PM2.5): 12.3
Severe Housing Problems: 19%
Violent Crime Rate (per 100K people): 1,392.36
Raising Kids Index: 42.18
7
Las Vegas, NV
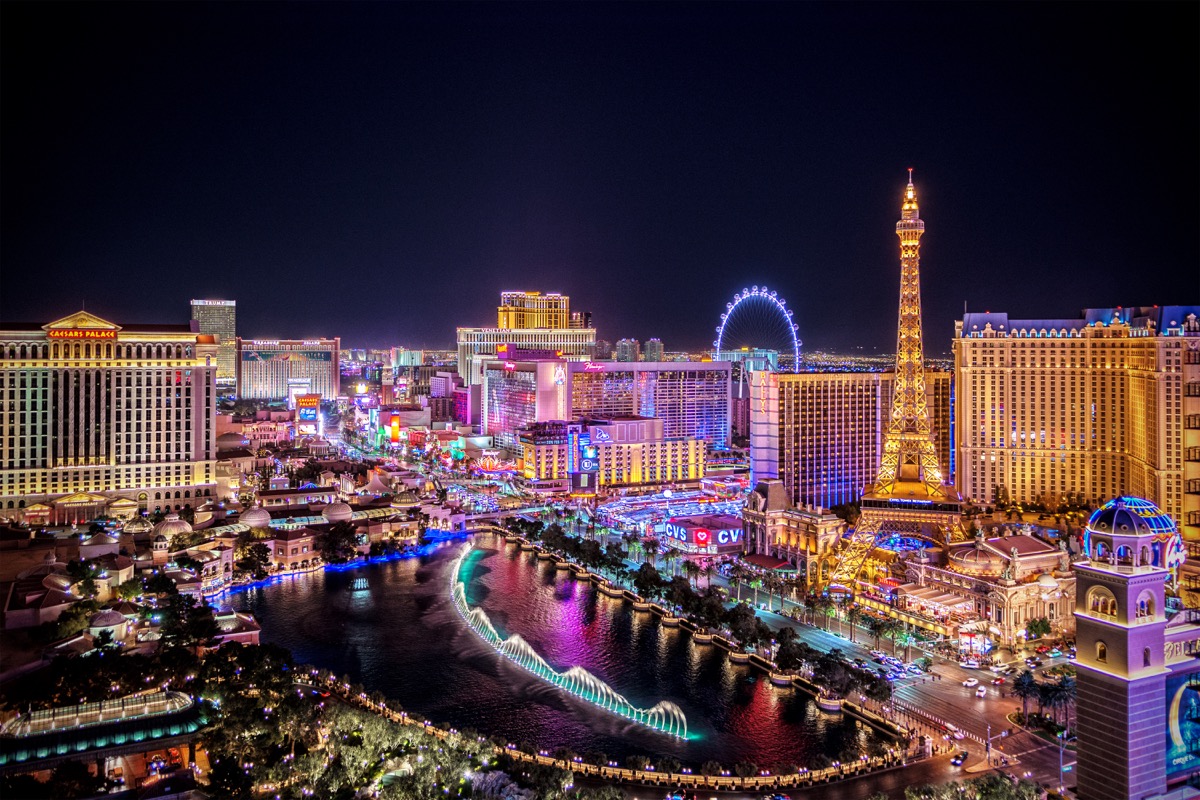
Population: 632,912
High School Graduation Rate: 72%
Disconnected Youth: 18%
Excessive Drinking: 18%
Food Environment Index (1–10): 8.9
Access to Exercise Opportunities: 96%
Air Pollution (average daily PM2.5): 8.9
Severe Housing Problems: 22%
Violent Crime Rate (per 100K people): 2,136.16
Raising Kids Index: 41.54
6
Jackson, MS
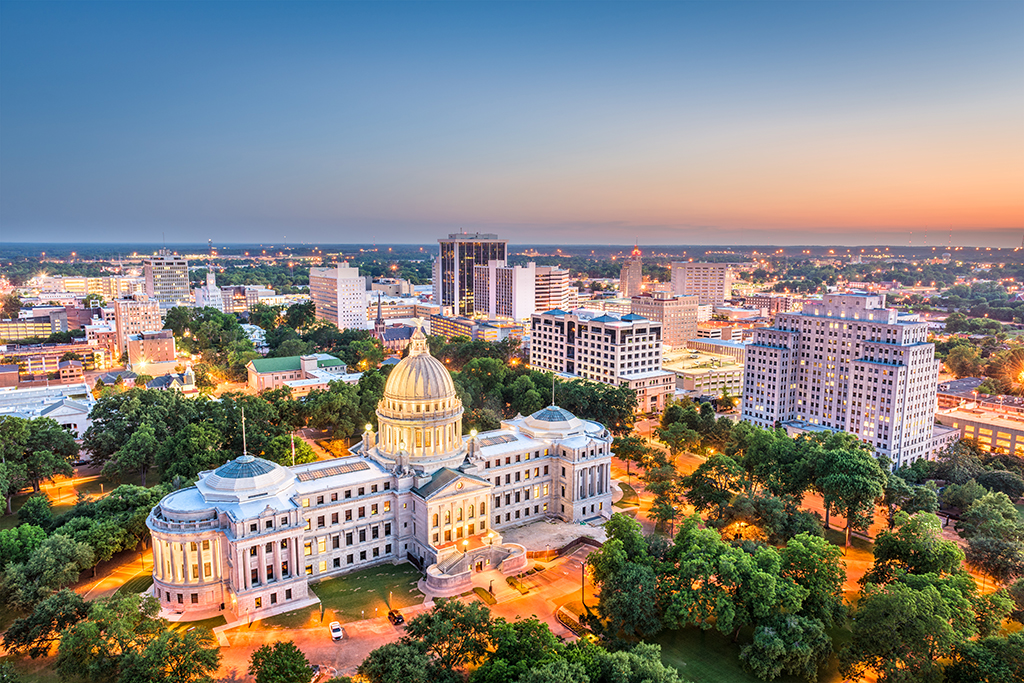
Population: 169,148
High School Graduation Rate: 68%
Disconnected Youth: 16%
Excessive Drinking: 12%
Food Environment Index (1–10): 10
Access to Exercise Opportunities: 73%
Air Pollution (average daily PM2.5): 10
Severe Housing Problems: 21%
Violent Crime Rate (per 100K people): 857.83
Raising Kids Index: 41.52
5
Detroit, MI
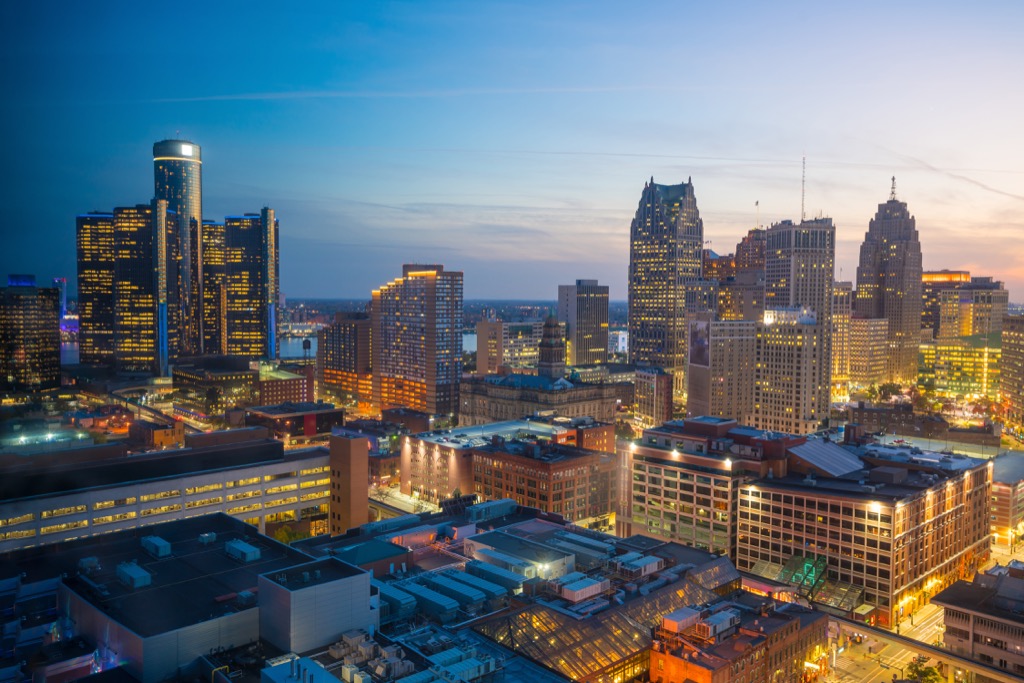
Population: 672,795
High School Graduation Rate: 79%
Disconnected Youth: 21%
Excessive Drinking: 20%
Food Environment Index (1–10): 11.5
Access to Exercise Opportunities: 93%
Air Pollution (average daily PM2.5): 11.5
Severe Housing Problems: 22%
Violent Crime Rate (per 100K people): 2,037.02
Raising Kids Index: 39.83
4
Salem, OR
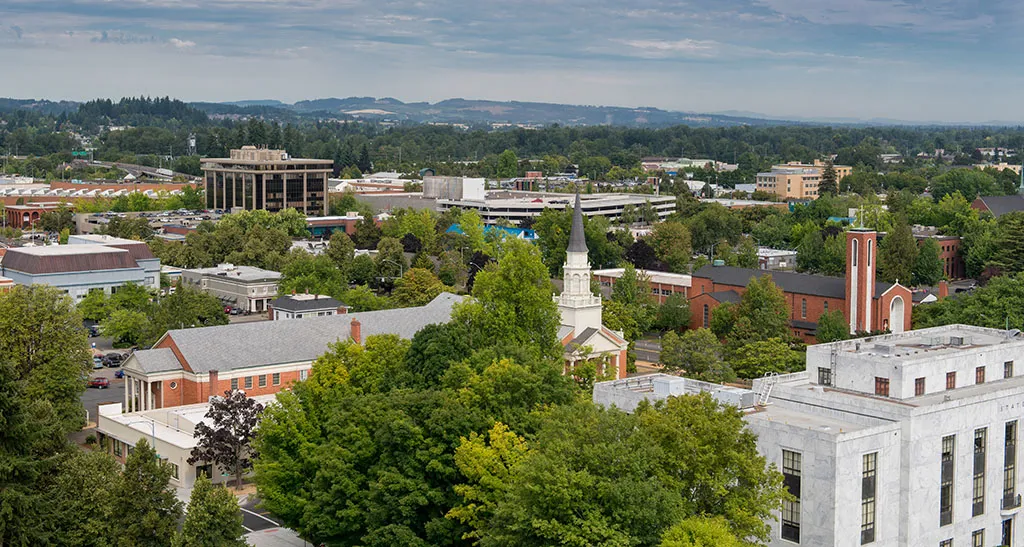
Population: 167,419
High School Graduation Rate: 74%
Disconnected Youth: 17%
Excessive Drinking: 17%
Food Environment Index (1–10): 8.8
Access to Exercise Opportunities: 59%
Air Pollution (average daily PM2.5): 8.8
Severe Housing Problems: 22%
Violent Crime Rate (per 100K people): 318.36
Raising Kids Index: 39.82
3
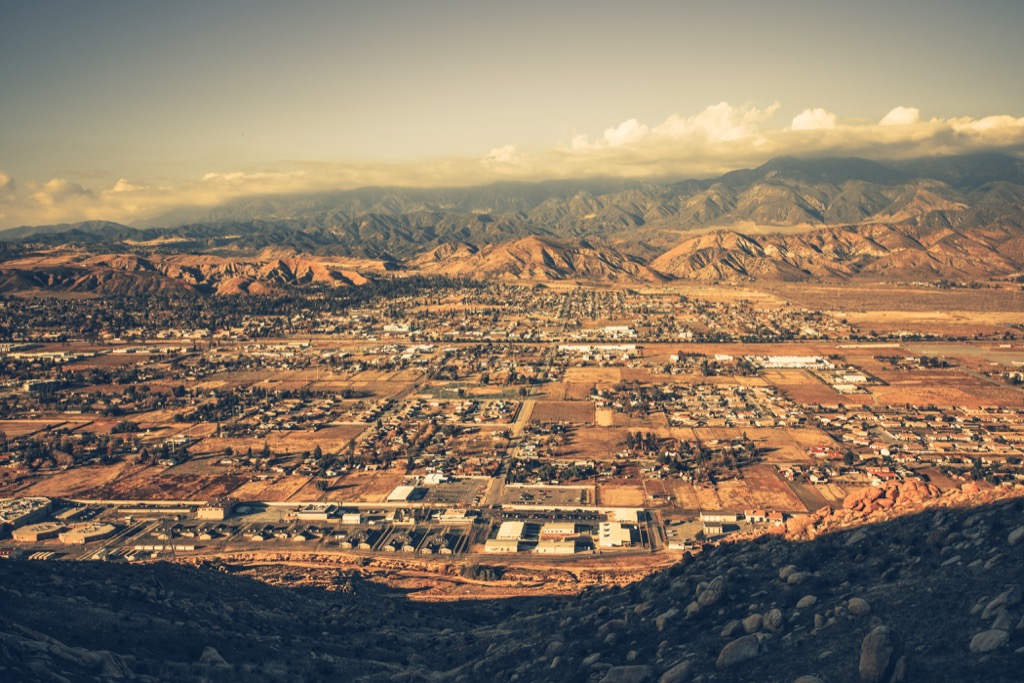
San Bernardino, CA
Population: 216,239
High School Graduation Rate: 81%
Disconnected Youth: 19%
Excessive Drinking: 18%
Food Environment Index (1–10): 14.2
Access to Exercise Opportunities: 84%
Air Pollution (average daily PM2.5): 14.2
Severe Housing Problems: 28%
Violent Crime Rate (per 100K people): 1,330.93
Raising Kids Index: 38.99
2
Stockton, CA

Population: 307,072
High School Graduation Rate: 82%
Disconnected Youth: 18%
Excessive Drinking: 18%
Food Environment Index (1–10): 9.7
Access to Exercise Opportunities: 73%
Air Pollution (average daily PM2.5): 9.7
Severe Housing Problems: 27%
Violent Crime Rate (per 100K people): 1,426.70
Raising Kids Index: 37.53
1
Columbia, SC

Population: 134,309
High School Graduation Rate: 63%
Disconnected Youth: 10%
Excessive Drinking: 19%
Food Environment Index (1–10): 10
Access to Exercise Opportunities: 65%
Air Pollution (average daily PM2.5): 10
Severe Housing Problems: 18%
Violent Crime Rate (per 100K people): 830.92
Raising Kids Index: 34.99
And for more great city rankings, especially if you’re looking to start a family, check out The 50 Best Cities for Buying a Bigger House.
To discover more amazing secrets about living your best life, click here to follow us on Instagram!