This Is the Most Hated State in America

Hate is a harsh word, especially in today’s divisive times. However, when it comes to regional rivalries, there tends to be no love lost. For instance, if you ask a New Yorker what they think about Boston, Massachusetts—particularly if they’re a baseball fan—you’ll likely be given a look of disgust. On the other hand, it can also be easy to hate on the place where you live as well. To figure out which state is the most disliked by both residents and rivals, we’ve done some digging and crunched the numbers–and you may be surprised by the answer.
We started off by calculating the percentage of the population that has recently moved out of each state. While locals don’t give reviews of their hometowns like they would a restaurant on Yelp, they do tend to vote with their feet, so we compared the population increase or decrease in each state to the national average of 0.6 percent, according to the U.S. Census Bureau. Next, we analyzed a Gallup poll of which citizens felt the most pride in their home states—defined as the percentage of people who agreed with the statement that their state is “the best or one of the best possible states to live.” The states with the least pride ranked higher in our Hatred Index. Finally, we looked at the findings of illustrator and amateur researcher Matt Shirley, who polled his 320,000 Instagram followers from across the country in 2020 to discover which state they hate the most. We then factored in the population of the states that hated on each state to measure the volume of hostility hurled in every state’s direction. (Some states, Shirley found, had no states that hate them.) These results were compiled into an algorithm that produced the final score of our Hatred Index, wherein the higher the number, the more hated that state is.
In the end, the top 10 most hated states spanned every region, from the East Coast to the South. (Yes, even the Midwest isn’t as nice as you thought.) But one state drew the most vitriol of them all. Read on to see if your home state is loathed or loved as we rank every state, from least hated to most hated. And for more places where locals aren’t the most welcoming, This Is the Unfriendliest State in the U.S.
50
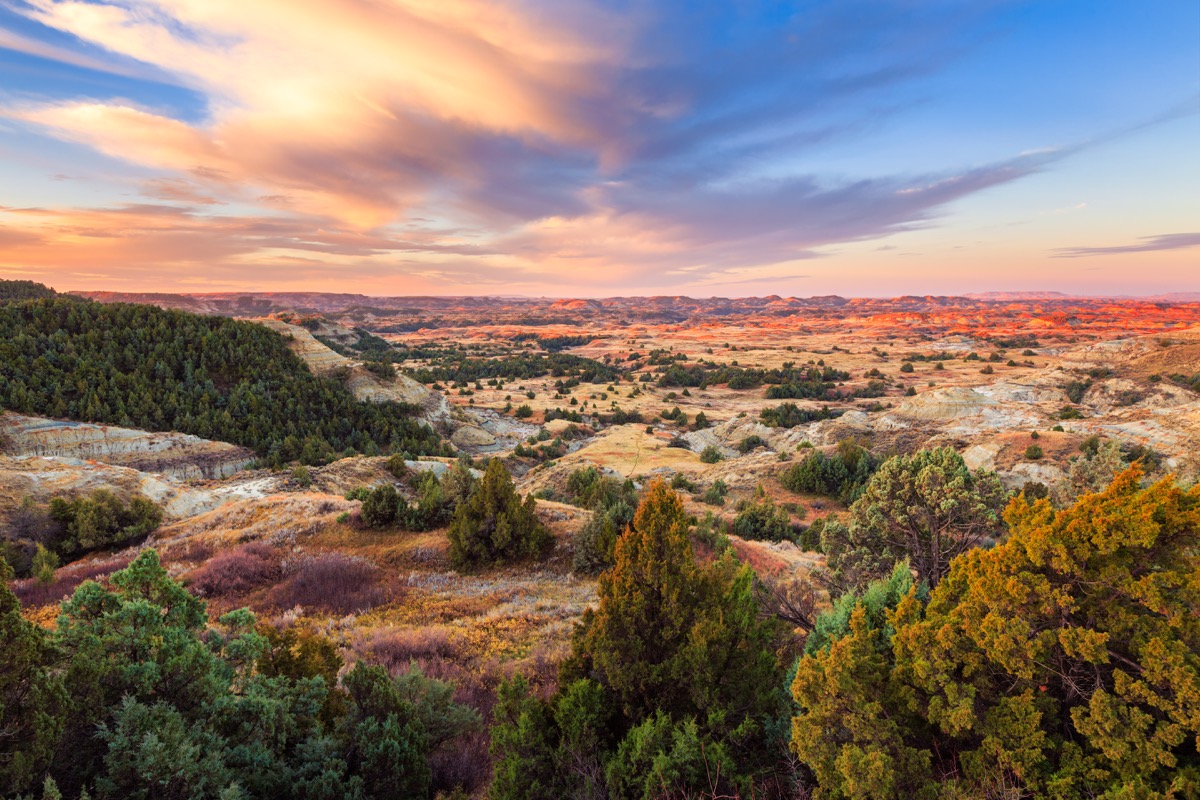
Idaho

Population change compared to the U.S. average: 3.5 percent
State pride: 54 percent
States that hate it: None
Population of states that hate it: N/A
Hatred Index: -304
And to find out which state could be cleaner, This Is the Dirtiest State in the U.S.
49
Utah
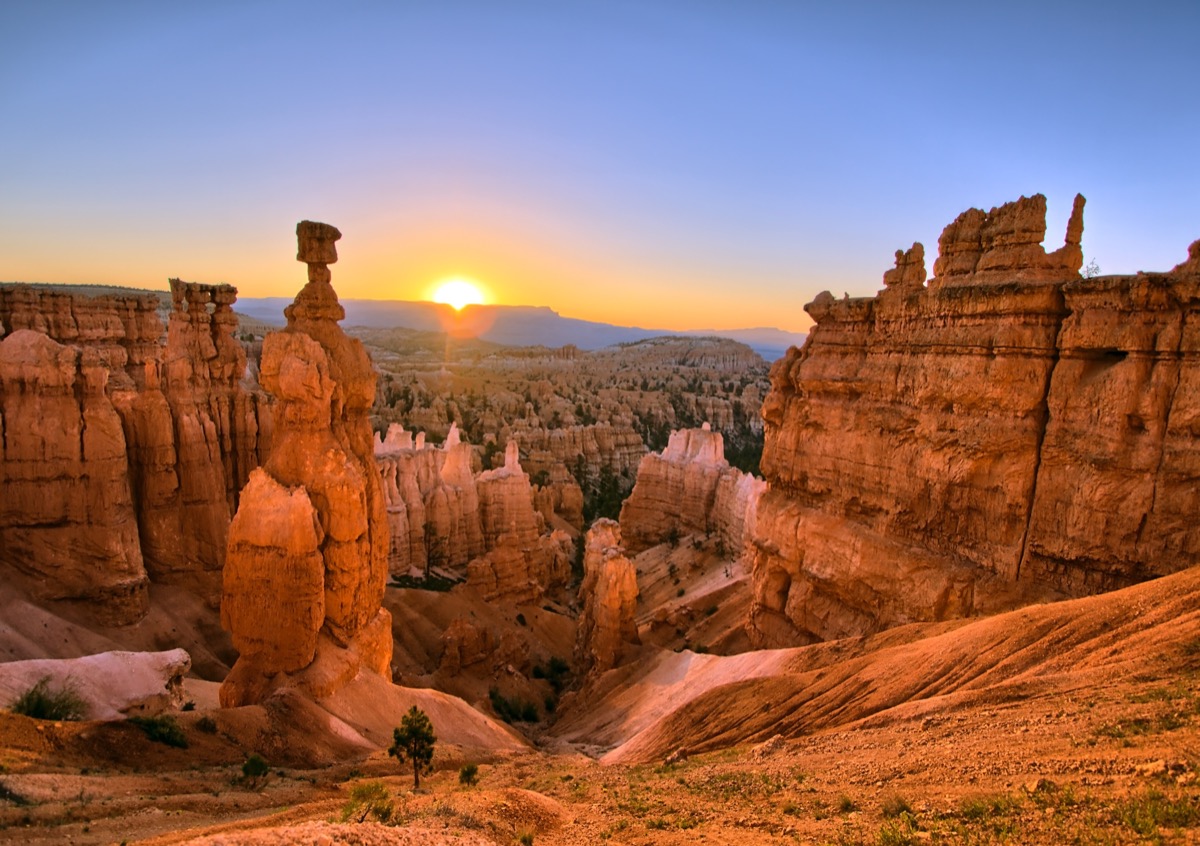
Population change compared to the U.S. average: 3.2 percent
State pride: 70 percent
States that hate it: None
Population of states that hate it: N/A
Hatred Index: -290
48
Washington

Population change compared to the U.S. average: 2.8 percent
State pride: 58 percent
States that hate it: None
Population of states that hate it: N/A
Hatred Index: -238
And for the state that’ll make you snooze, This Is the Most Boring State in the U.S.
47
Nevada

Population change compared to the U.S. average: 2.8 percent
State pride: 28 percent
States that hate it: None
Population of states that hate it: N/A
Hatred Index: -208
46
Arizona
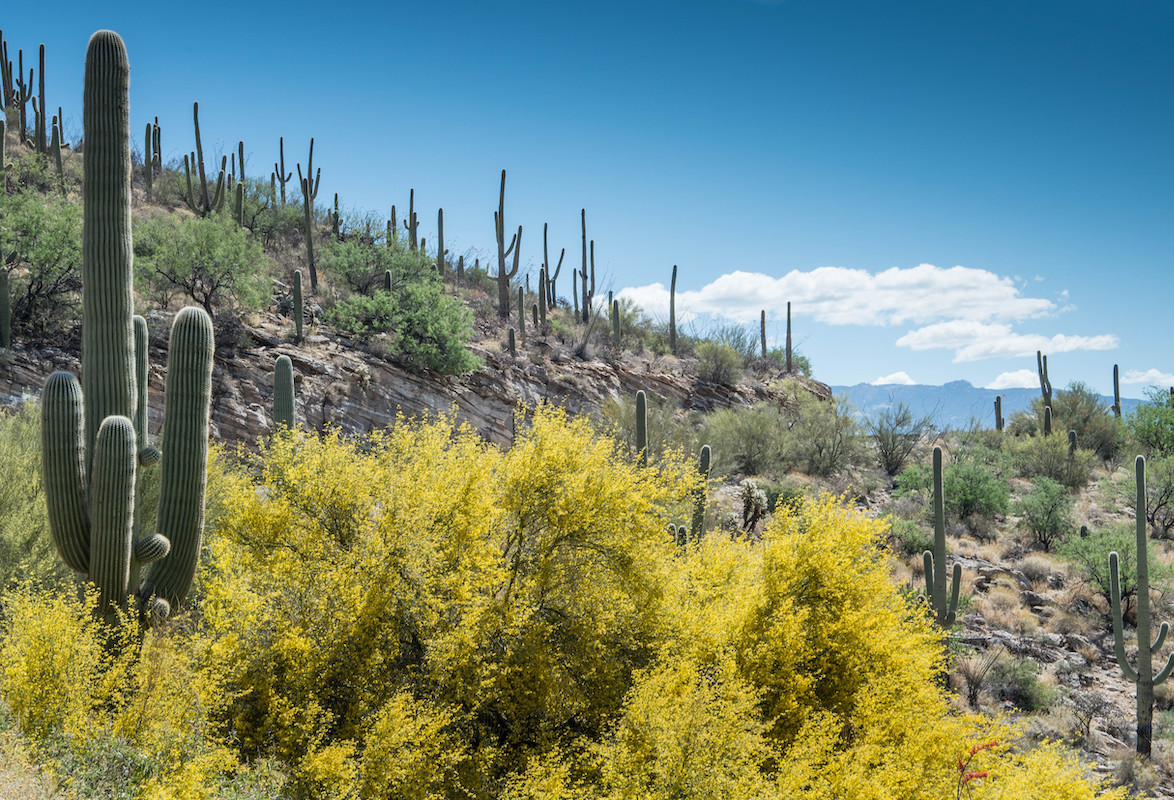
Population change compared to the U.S. average: 2.28 percent
State pride: 41 percent
States that hate it: None
Population of states that hate it: N/A
Hatred Index: -169
45
Colorado

Population change compared to the U.S. average: 2 percent
State pride: 65 percent
States that hate it: None
Population of states that hate it: N/A
Hatred Index: -165
And if you want more state guides to read, sign up for our daily newsletter.
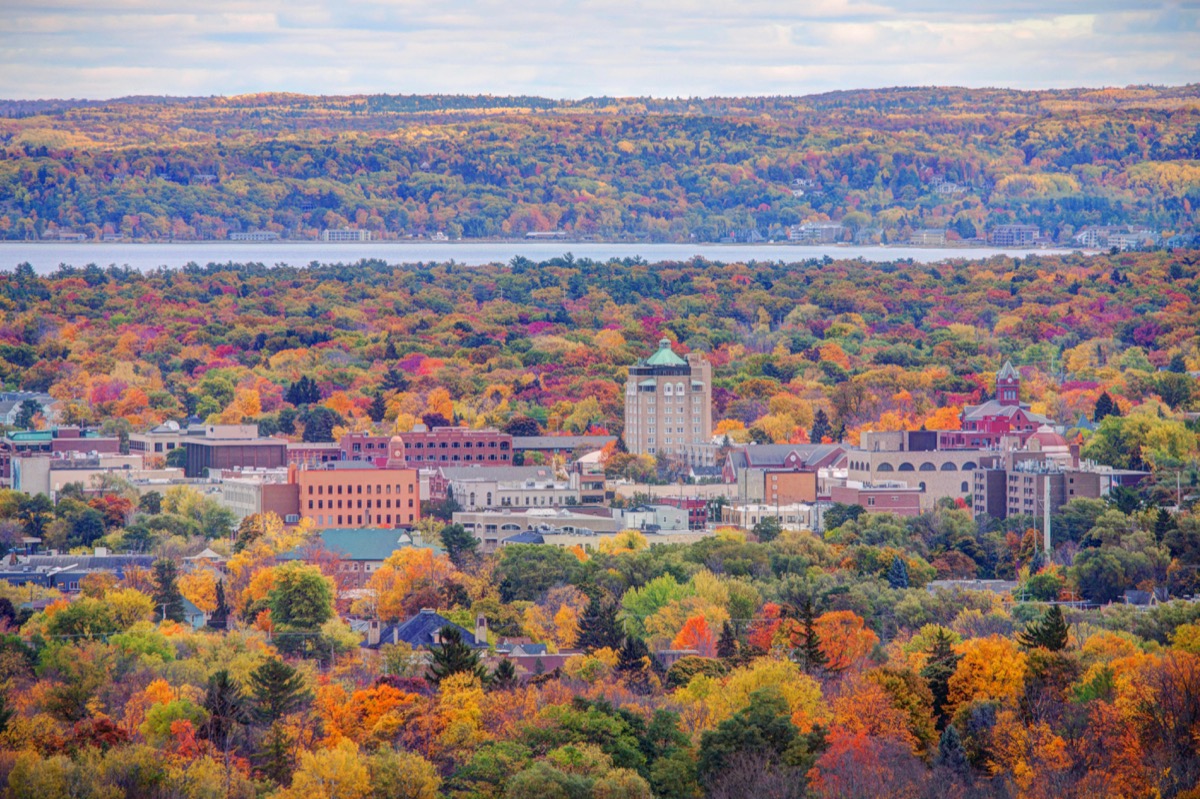
44
Oregon

Population change compared to the U.S. average: 2 percent
State pride: 61 percent
States that hate it: None
Population of states that hate it: N/A
Hatred Index: -161
43
South Dakota
Population change compared to the U.S. average: 1.7 percent
State pride: 57 percent
States that hate it: North Dakota
Population of states that hate it: 762,062
Hatred Index: -112
42
Montana

Population change compared to the U.S. average: 1.7 percent
State pride: 29 percent
States that hate it: None
Population of states that hate it: N/A
Hatred Index: -99
41
Wyoming
Population change compared to the U.S. average: 1.2 percent
State pride: 69 percent
States that hate it: None
Population of states that hate it: N/A
Hatred Index: -89
40
North Carolina

Population change compared to the U.S. average: 1.5 percent
State pride: 34 percent
States that hate it: None
Population of states that hate it: N/A
Hatred Index: -84
39
Georgia

Population change compared to the U.S. average: 1.4 percent
State pride: 41 percent
States that hate it: None
Population of states that hate it: N/A
Hatred Index: -81
38
Minnesota

Population change compared to the U.S. average: 0.9 percent
State pride: 61 percent
States that hate it: None
Population of states that hate it: N/A
Hatred Index: -51
37
Delaware
Population change compared to the U.S. average: 1 percent
State pride: 39 percent
States that hate it: None
Population of states that hate it: N/A
Hatred Index: -39
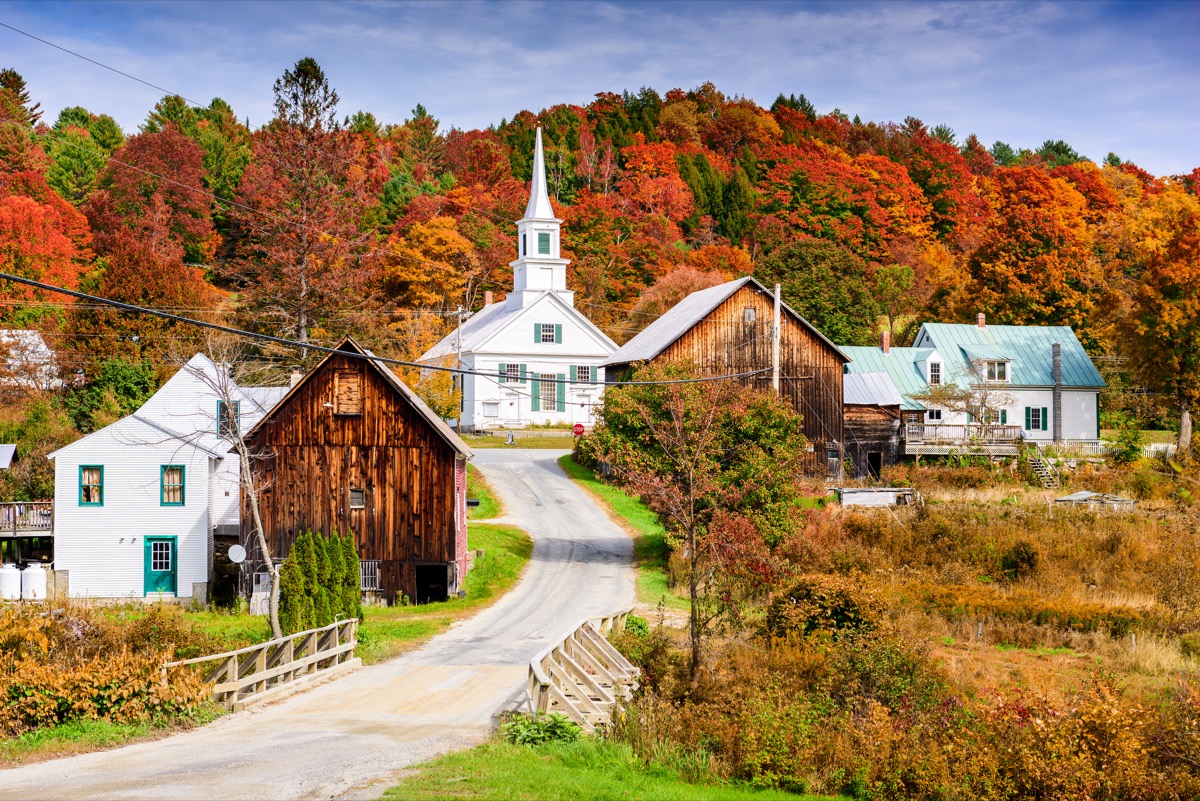
36
New Hampshire

Population change compared to the U.S. average: 0.4 percent
State pride: 67 percent
States that hate it: None
Population of states that hate it: N/A
Hatred Index: -7
35
Tennessee
Population change compared to the U.S. average: 1.2 percent
State pride: 47 percent
States that hate it: Kentucky
Population of states that hate it: 4,467,673
Hatred Index: 22
34
Virginia
Population change compared to the U.S. average: 0.6 percent
State pride: 47 percent
States that hate it: West Virginia
Population of states that hate it: 1,792,147
Hatred Index: 29
33
Alaska
Population change compared to the U.S. average: -0.14 percent
State pride: 77 percent
States that hate it: None
Population of states that hate it: N/A
Hatred Index: 37
32
Arkansas

Population change compared to the U.S. average: 0.23 percent
State pride: 37 percent
States that hate it: None
Population of states that hate it: N/A
Hatred Index: 40
31
Hawaii

Population change compared to the U.S. average: -0.1 percent
State pride: 68 percent
States that hate it: None
Population of states that hate it: N/A
Hatred Index: 42
30
Nebraska

Population change compared to the U.S. average: 0.6 percent
State pride: 52 percent
States that hate it: Iowa
Population of states that hate it: 3,155,070
Hatred Index: 51
29
Maine

Population change compared to the U.S. average: -0.1 percent
State pride: 57 percent
States that hate it: None
Population of states that hate it: N/A
Hatred Index: 53
28
Maryland
Population change compared to the U.S. average: 0 percent
State pride: 29 percent
States that hate it: None
Population of states that hate it: N/A
Hatred Index: 71
27
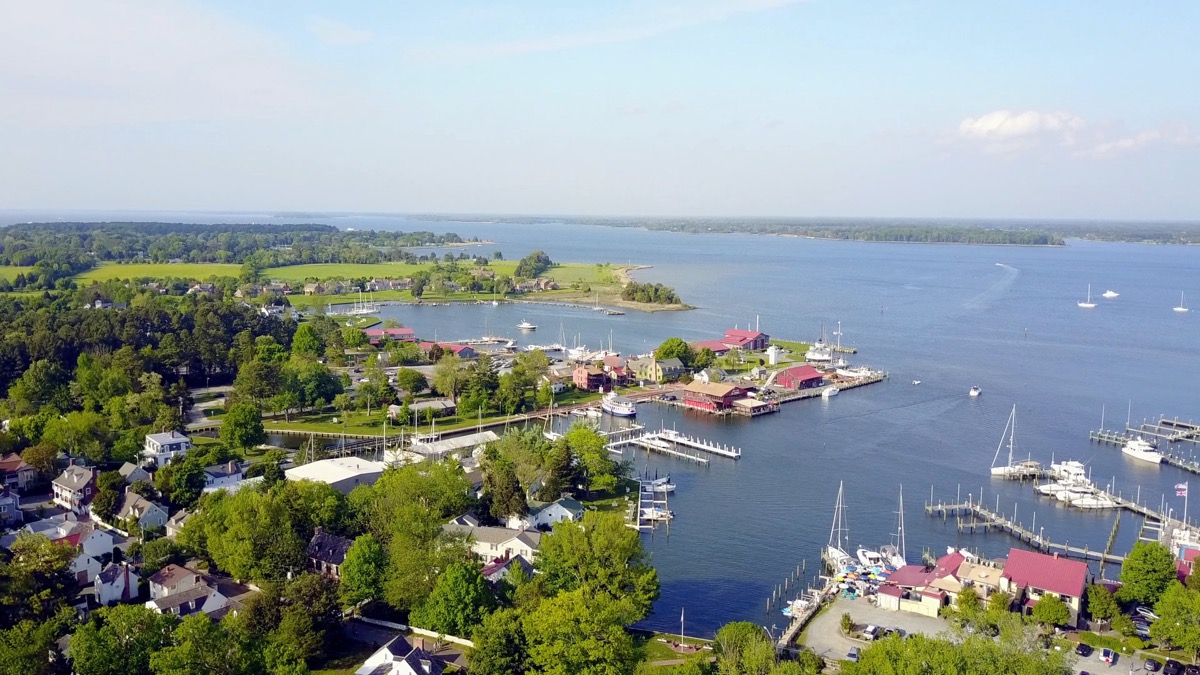
Iowa
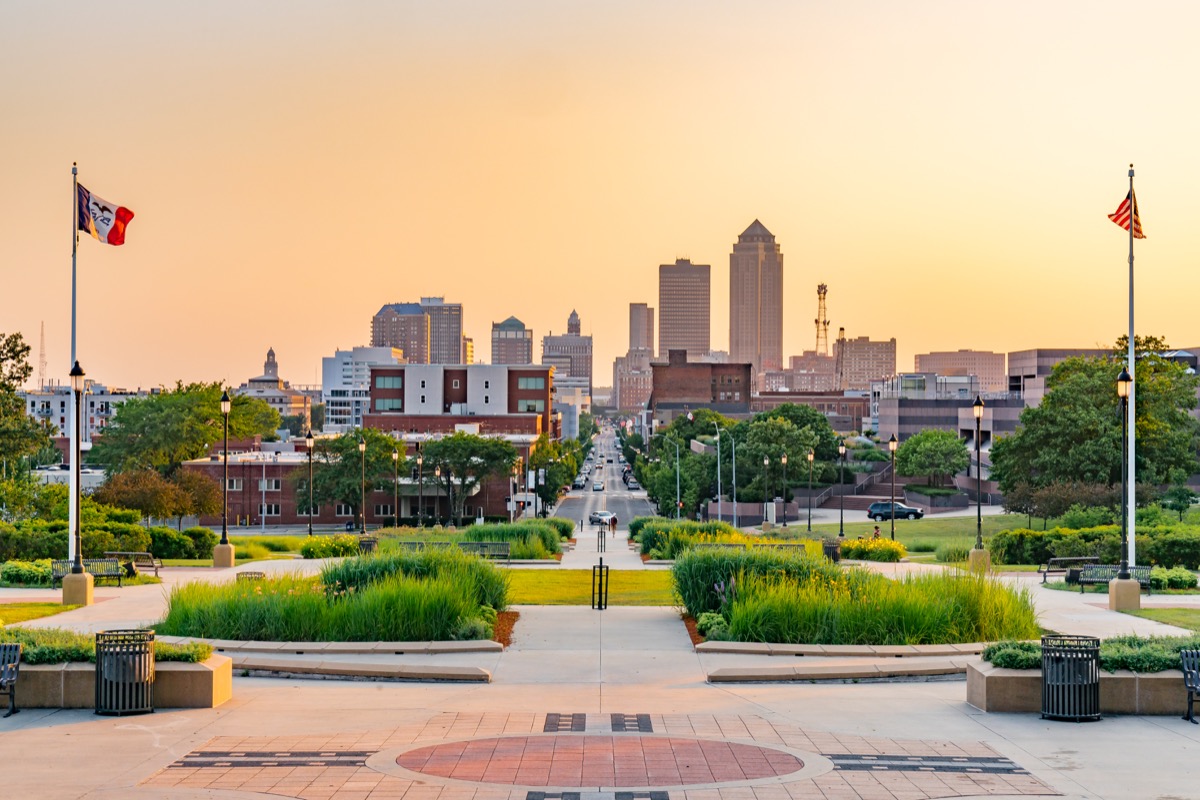
Population change compared to the U.S. average: 0.1 percent
State pride: 56 percent
States that hate it: Nebraska
Population of states that hate it: 1,934,408
Hatred Index: 73
26
Vermont
Population change compared to the U.S. average: -0.4 percent
State pride: 61 percent
States that hate it: None
Population of states that hate it: N/A
Hatred Index: 79
25
Massachusetts

Population change compared to the U.S. average: 0.4 percent
State pride: 46 percent
States that hate it: Maine, New Hampshire, Vermont
Population of states that hate it: 3,327,912
Hatred Index: 81
24
South Carolina
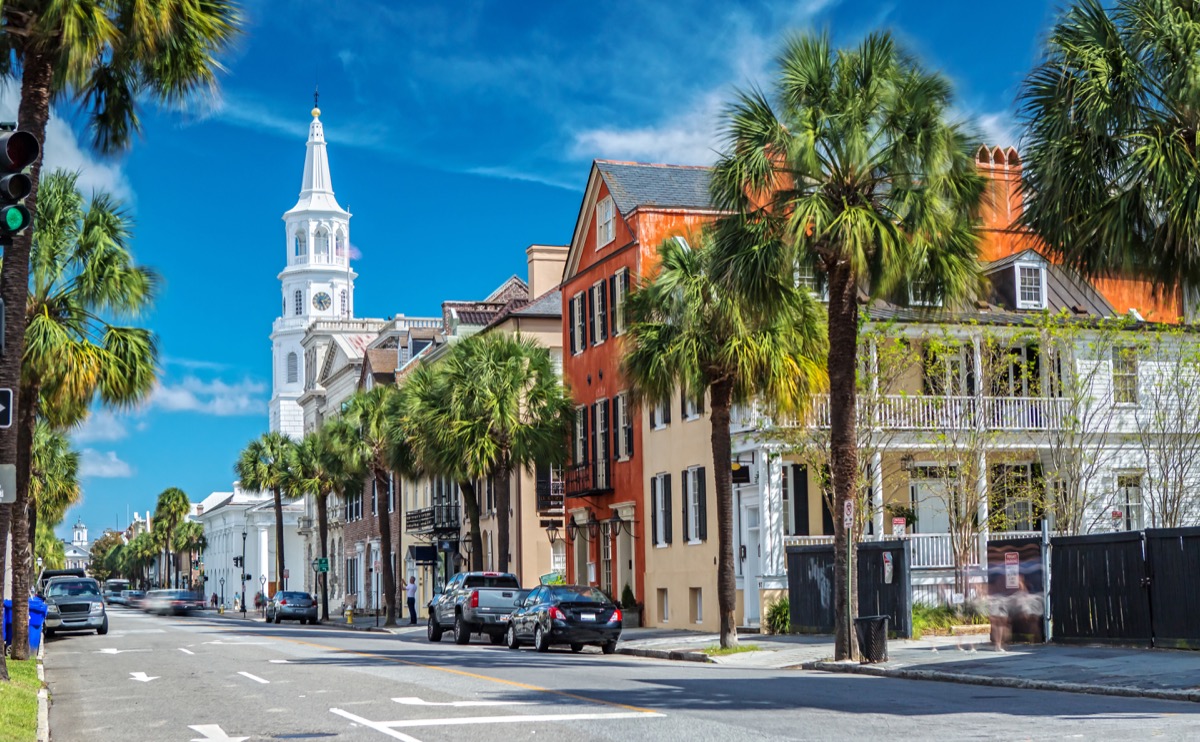
Population change compared to the U.S. average: 1.8 percent
State pride: 39 percent
States that hate it: North Carolina
Population of states that hate it: 10,488,084
Hatred Index: 91
23
North Dakota
Population change compared to the U.S. average: -0.4 percent
State pride: 66 percent
States that hate it: South Dakota
Population of states that hate it: 884,659
Hatred Index: 92
22
Connecticut

Population change compared to the U.S. average: -0.34 percent
State pride: 31 percent
States that hate it: None
Population of states that hate it: N/A
Hatred Index: 103
21
Louisiana

Population change compared to the U.S. average: -0.3 percent
State pride: 27 percent
States that hate it: None
Population of states that hate it: N/A
Hatred Index: 103
20
Pennsylvania
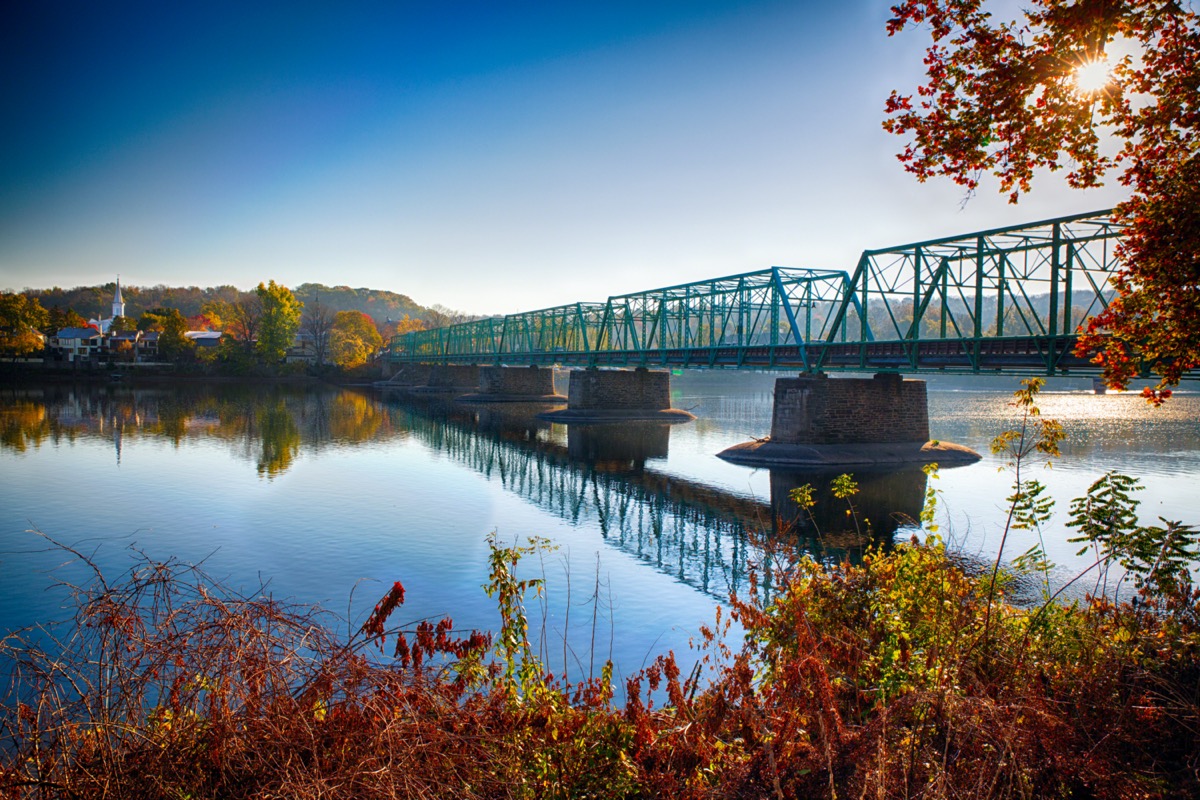
Population change compared to the U.S. average: -0.5 percent
State pride: 34 percent
States that hate it: None
Population of states that hate it: N/A
Hatred Index: 116
19
Mississippi

Population change compared to the U.S. average: -0.51 percent
State pride: 26 percent
States that hate it: None
Population of states that hate it: N/A
Hatred Index: 125
18
New Mexico
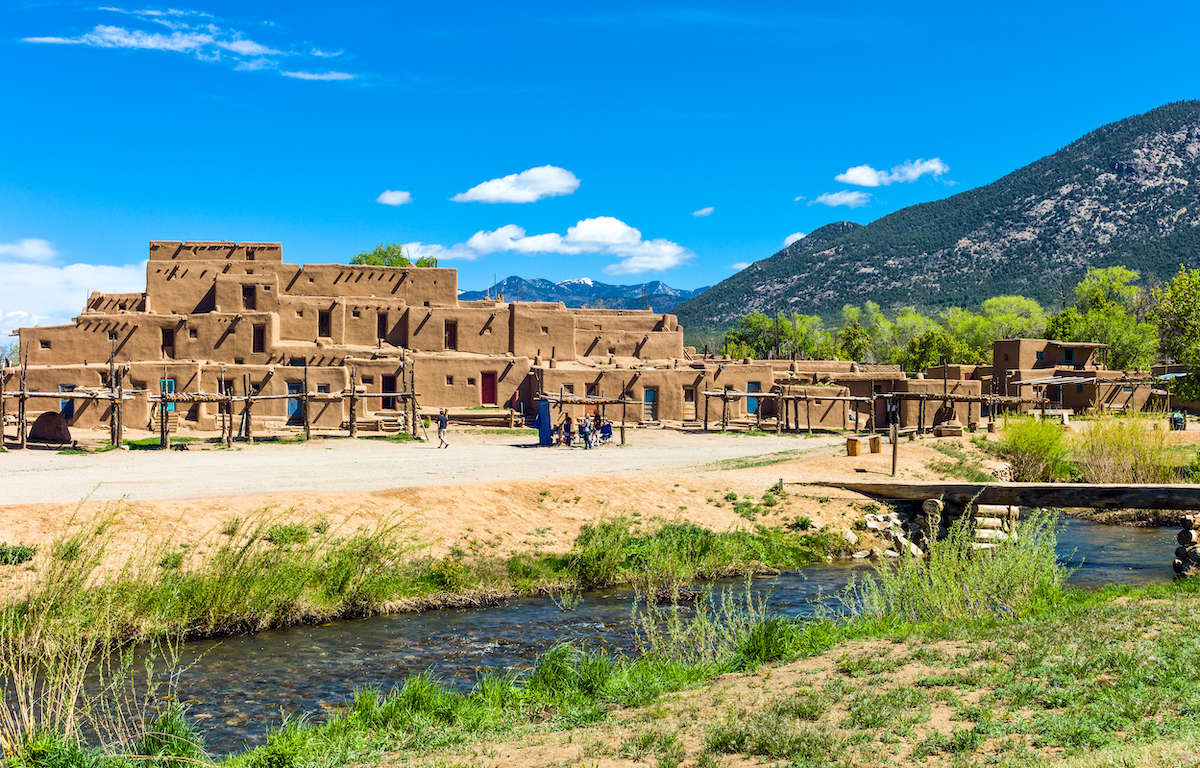
Population change compared to the U.S. average: -0.55 percent
State pride: 28 percent
States that hate it: None
Population of states that hate it: N/A
Hatred Index: 127
17
Missouri
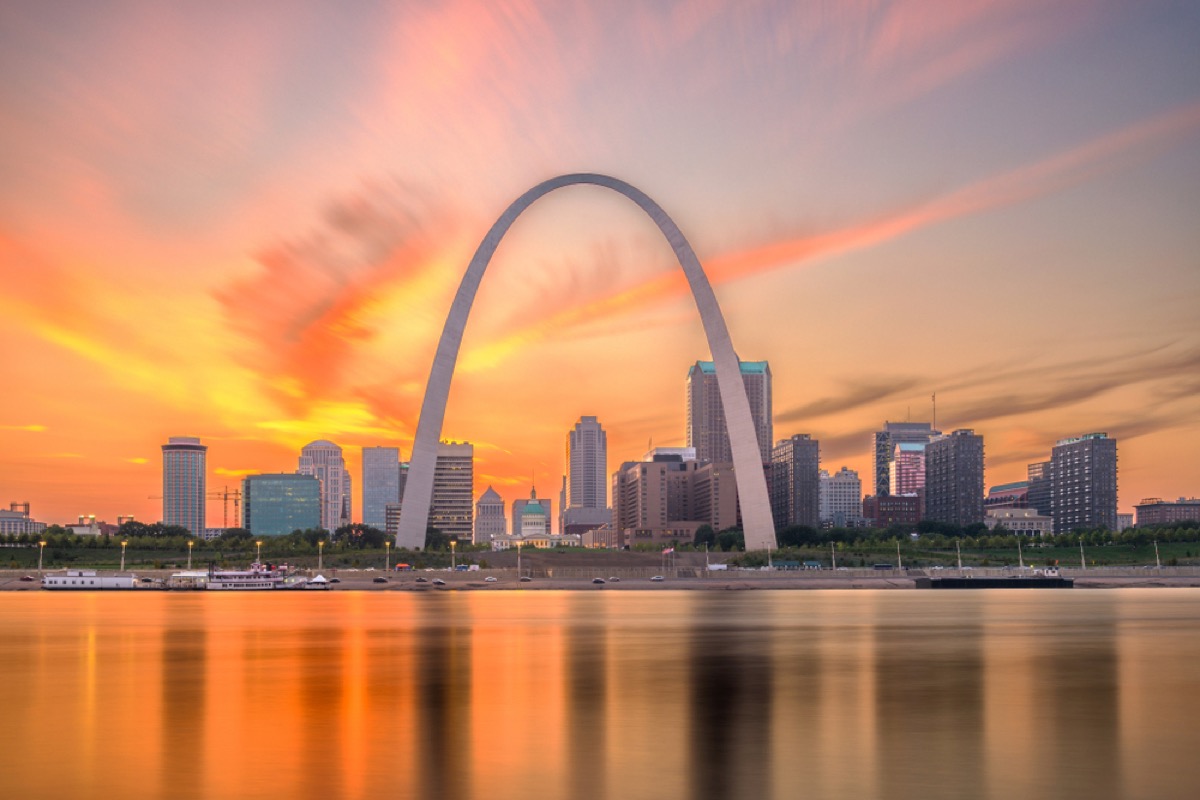
Population change compared to the U.S. average: 0 percent
State pride: 29 percent
States that hate it: Kansas
Population of states that hate it: 2,913,314
Hatred Index: 129
16
Rhode Island
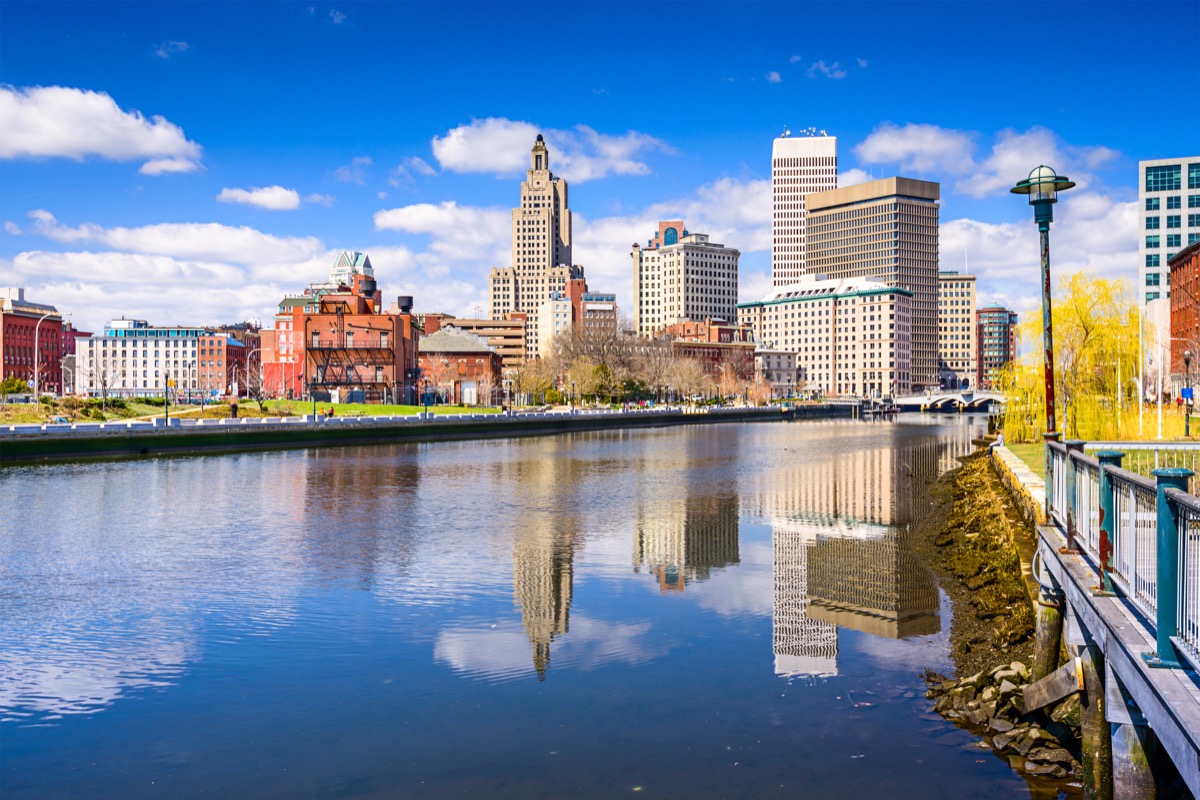
Population change compared to the U.S. average: -0.5 percent
State pride: 18 percent
States that hate it: None
Population of states that hate it: N/A
Hatred Index: 132
15
West Virginia

Population change compared to the U.S. average: 0.9 percent
State pride: 36 percent
States that hate it: Virginia
Population of states that hate it: 8,535,519
Hatred Index: 145
14
Wisconsin
Population change compared to the U.S. average: 0 percent
State pride: 49 percent
States that hate it: Minnesota
Population of states that hate it: 5,639,632
Hatred Index: 164
13
Ohio
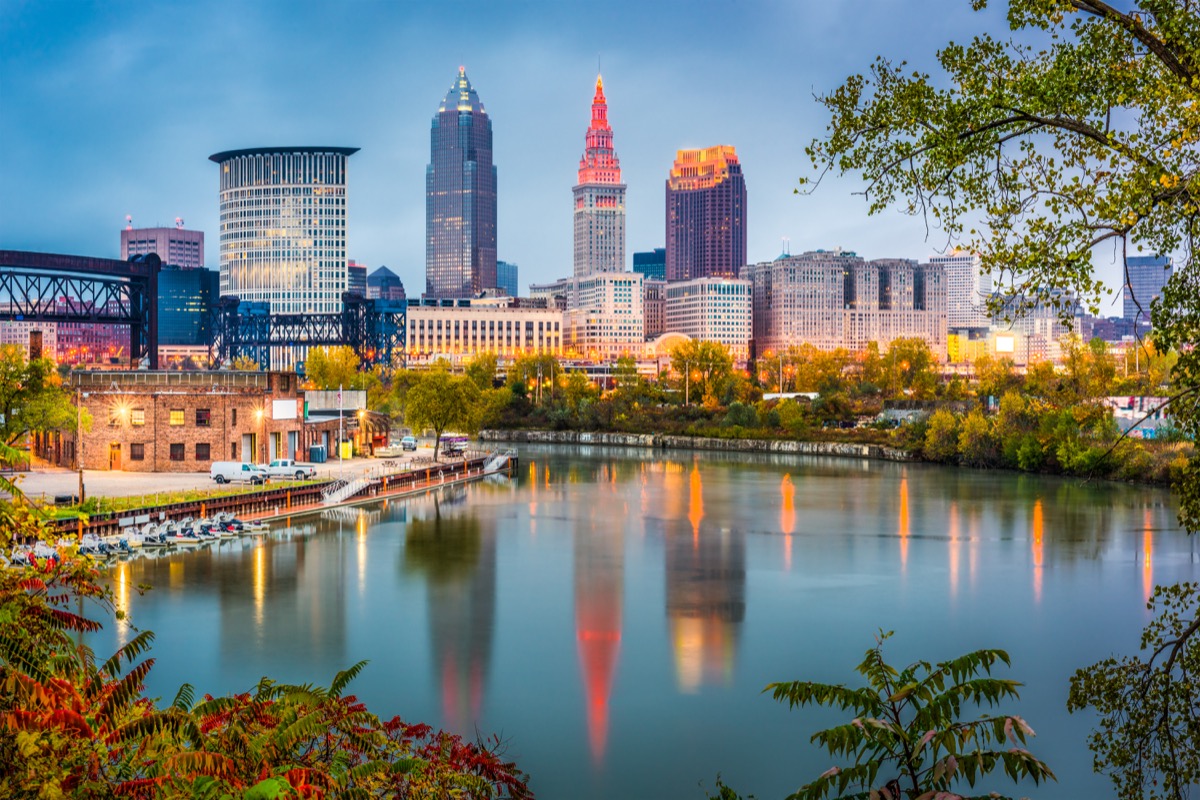
Population change compared to the U.S. average: -0.2 percent
State pride: 32 percent
States that hate it: South Carolina
Population of states that hate it: 5,148,714
Hatred Index: 191
12
Illinois

Population change compared to the U.S. average: 0 percent
State pride: 19 percent
States that hate it: Wisconsin
Population of states that hate it: 5,822,434
Hatred Index: 197
11
New York

Population change compared to the U.S. average: -0.1 percent
State pride: 41 percent
States that hate it: Massachusetts
Population of states that hate it: 6,892,503
Hatred Index: 207
10
Kansas

Population change compared to the U.S. average: -0.57 percent
State pride: 34 percent
States that hate it: Missouri
Population of states that hate it: 6,137,428
Hatred Index: 246
9
Alabama

Population change compared to the U.S. average: -0.18 percent
State pride: 39 percent
States that hate it: Louisiana, Arkansas, Mississippi
Population of states that hate it: 10,642,747
Hatred Index: 292
8
Indiana
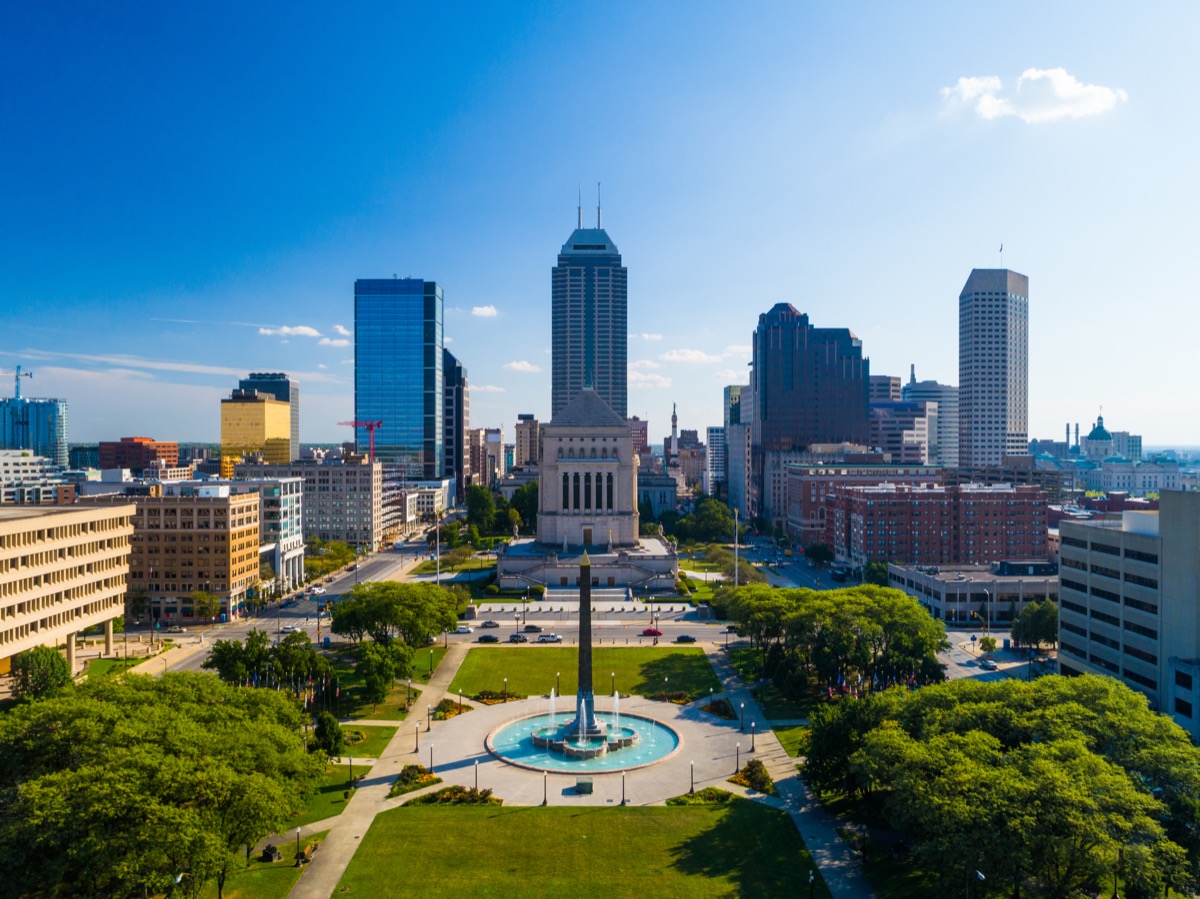
Population change compared to the U.S. average: 0.1 percent
State pride: 34 percent
States that hate it: Illinois
Population of states that hate it: 12,671,821
Hatred Index: 309
7
Kentucky

Population change compared to the U.S. average: 0.1 percent
State pride: 38 percent
States that hate it: Indiana, Tennessee
Population of states that hate it: 13,561,393
Hatred Index: 323
6
Michigan
Population change compared to the U.S. average: -0.2 percent
State pride: 28 percent
States that hate it: Ohio
Population of states that hate it: 11,689,100
Hatred Index: 326
5
Florida
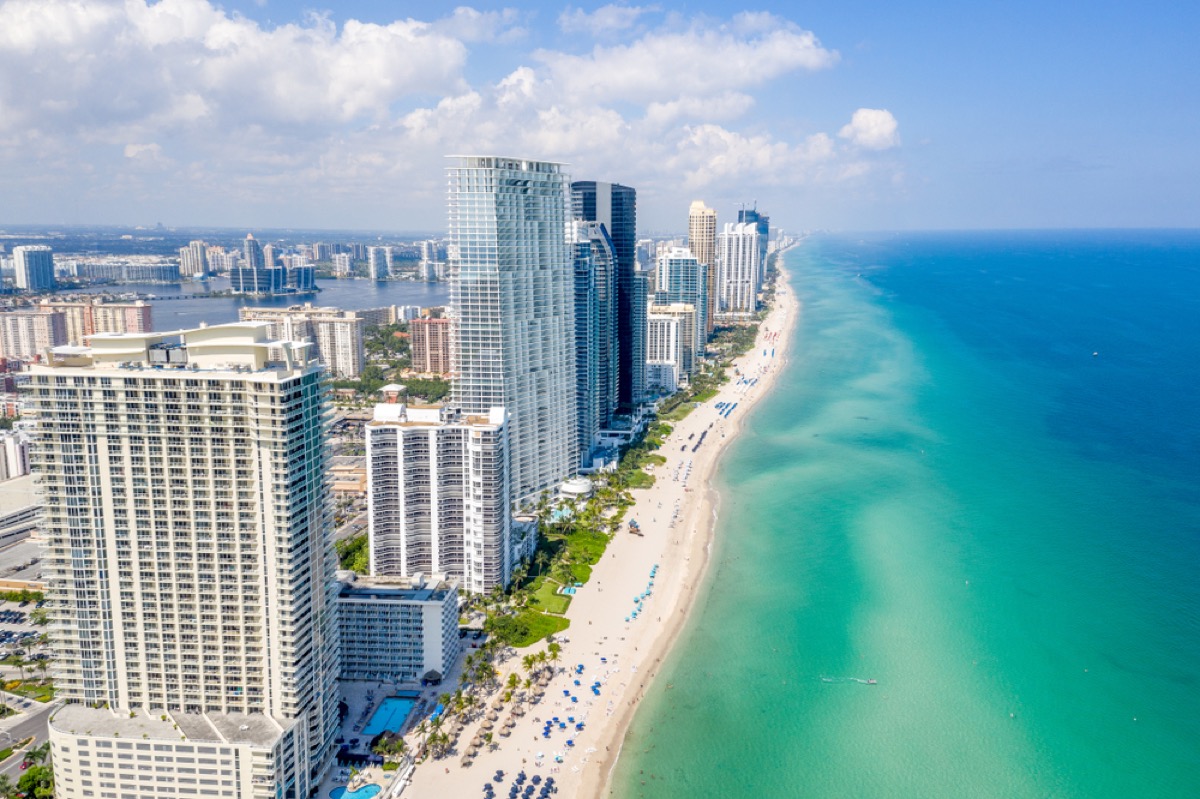
Population change compared to the U.S. average: -0.28 percent
State pride: 46 percent
States that hate it: Georgia, Alabama
Population of states that hate it: 15,520,608
Hatred Index: 392
4
Oklahoma
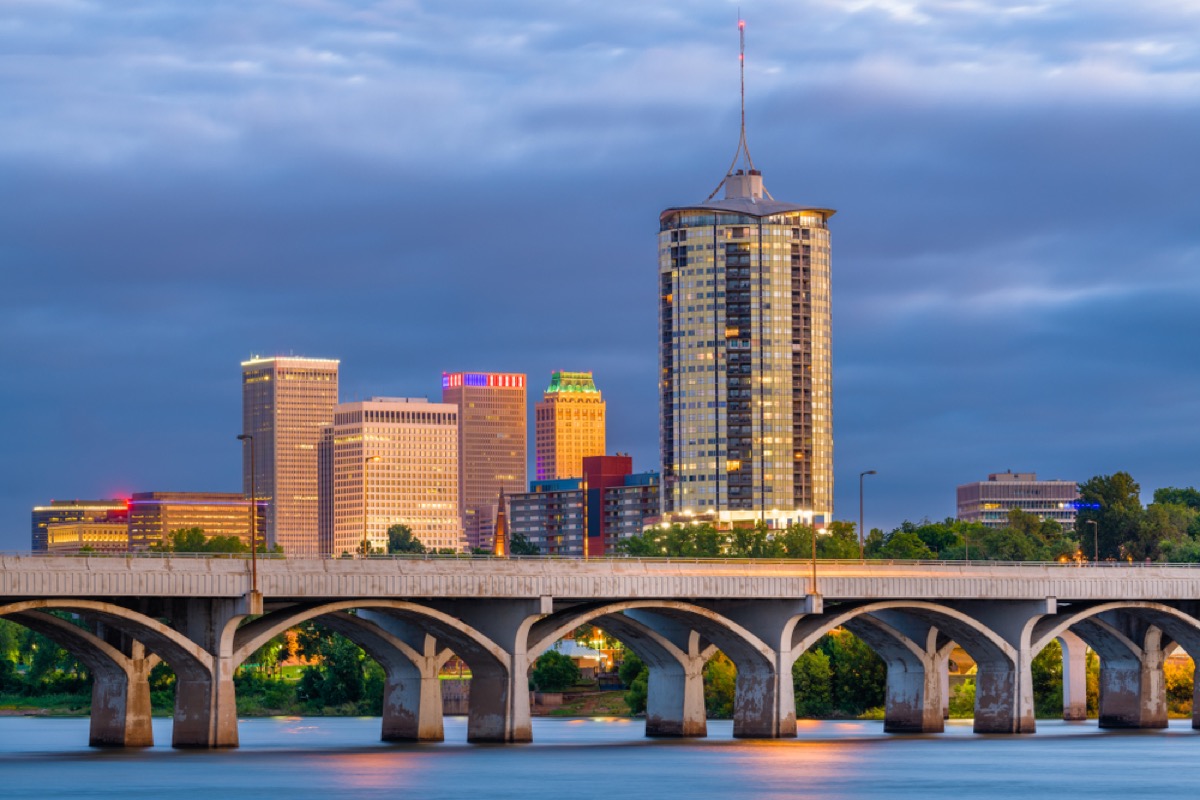
Population change compared to the U.S. average: -0.4 percent
State pride: 39 percent
States that hate it: Texas
Population of states that hate it: 28,995,881
Hatred Index: 681
3
California

Population change compared to the U.S. average: 0.36 percent
State pride: 51 percent
States that hate it: Washington, Oregon, Idaho, Montana, Wyoming, Nevada, Utah, Arizona, Colorado
Population of states that hate it: 34,590,799
Hatred Index: 705
2
Texas

Population change compared to the U.S. average: 2 percent
State pride: 68 percent
States that hate it: Alaska, California, New Mexico, Oklahoma
Population of states that hate it: 46,297,568
Hatred Index: 758
1
New Jersey

Population change compared to the U.S. average: -0.3 percent
State pride: 28 percent
States that hate it: New York, Pennsylvania, Connecticut
Population of states that hate it: 35,820,837
Hatred Index: 818
Can’t get enough state guides? Check out This State Has the Rudest Drivers in the U.S.