The 100 Most Dangerous Cities in America

Many of us consider our hometowns to be our safety nets. But the truth is, the town you grew up in or live in now might not be so safe after all. There are plenty of dangerous parts of the U.S. In fact, security systems company Alarms.org analyzed data about gun violence, crime rates, and police force adequacy to find out which major metropolitan areas (with populations over 100,000) were the most dangerous. Based on the weighted value of these metrics, each city was given a total crime score. The metropolises with the highest scores are all over the map, from the South to the Pacific Northwest. Here, we’ve ranked the 100 most dangerous cities in America. And to see how where you live affects your life-span, Here’s How Long You’re Likely to Live in Every State.
100
Miami Gardens, Florida
Crime score: 0.576
99
Clovis, California
Crime score: 0.576
And for more dismal spots in America, These Are the Saddest States in the U.S.
98
Fort Lauderdale, Florida
Crime score: 0.578
97
Hayward, California
Crime score: 0.578
And for regions in America where you’re likely to enjoy life, These Are the Happiest States in the U.S.
96
St. Petersburg, Florida
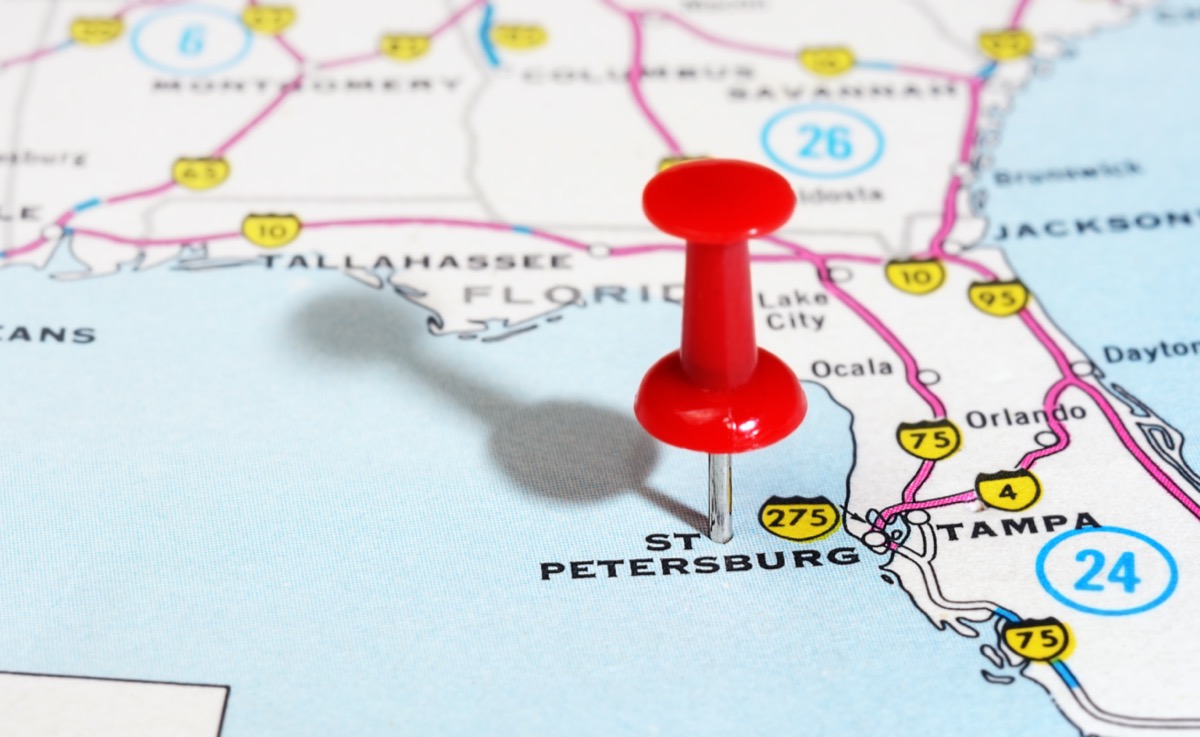
Crime score: 0.578
95
Murfreesboro, Tennessee
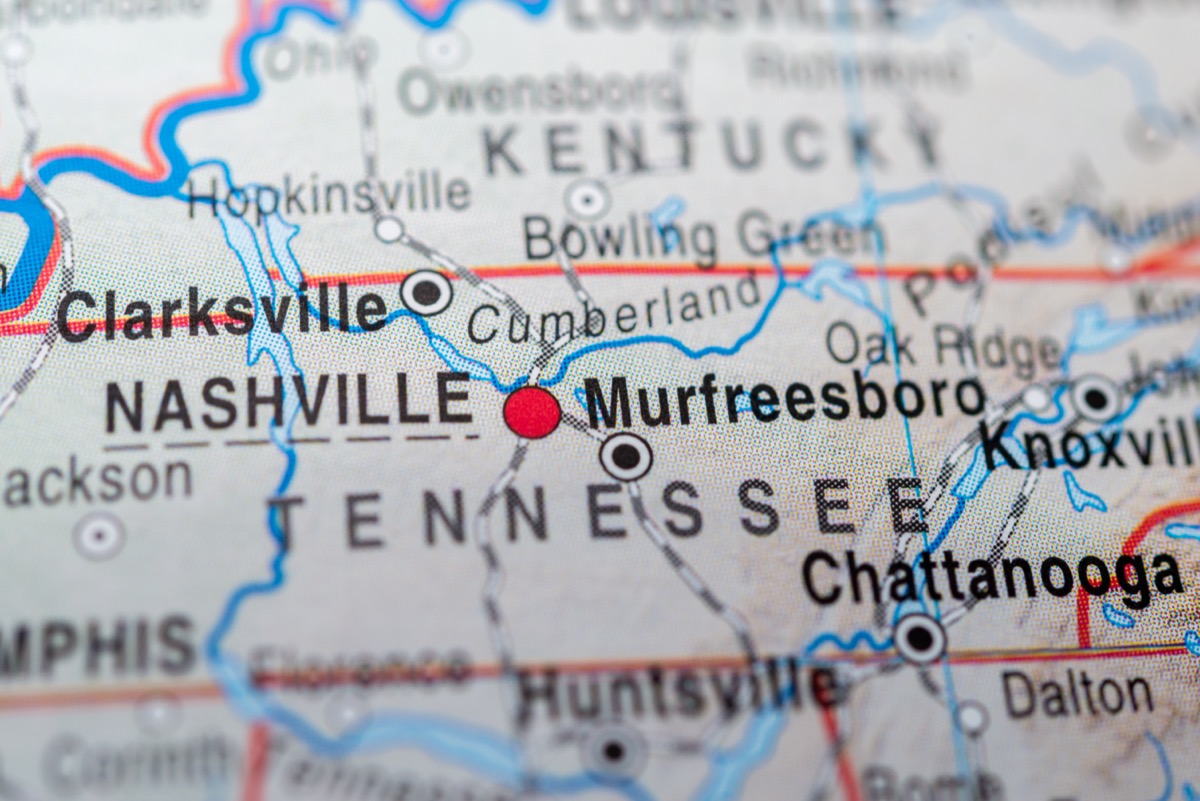
Crime score: 0.579
94
West Palm Beach, Florida
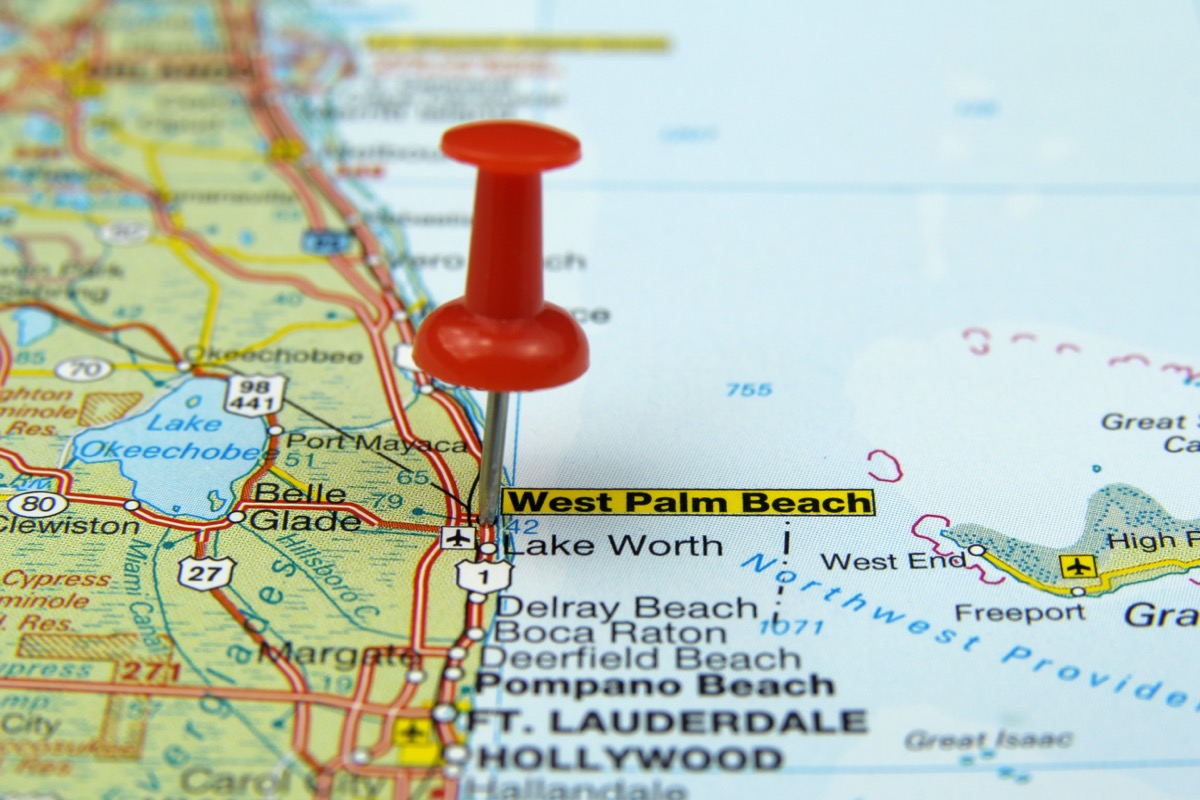
Crime score: 0.581
And for more on how your state stacks up in terms of residents’ well-being, check out Every U.S. State Ranked From Healthiest to Unhealthiest.
93
St. Louis, Missouri
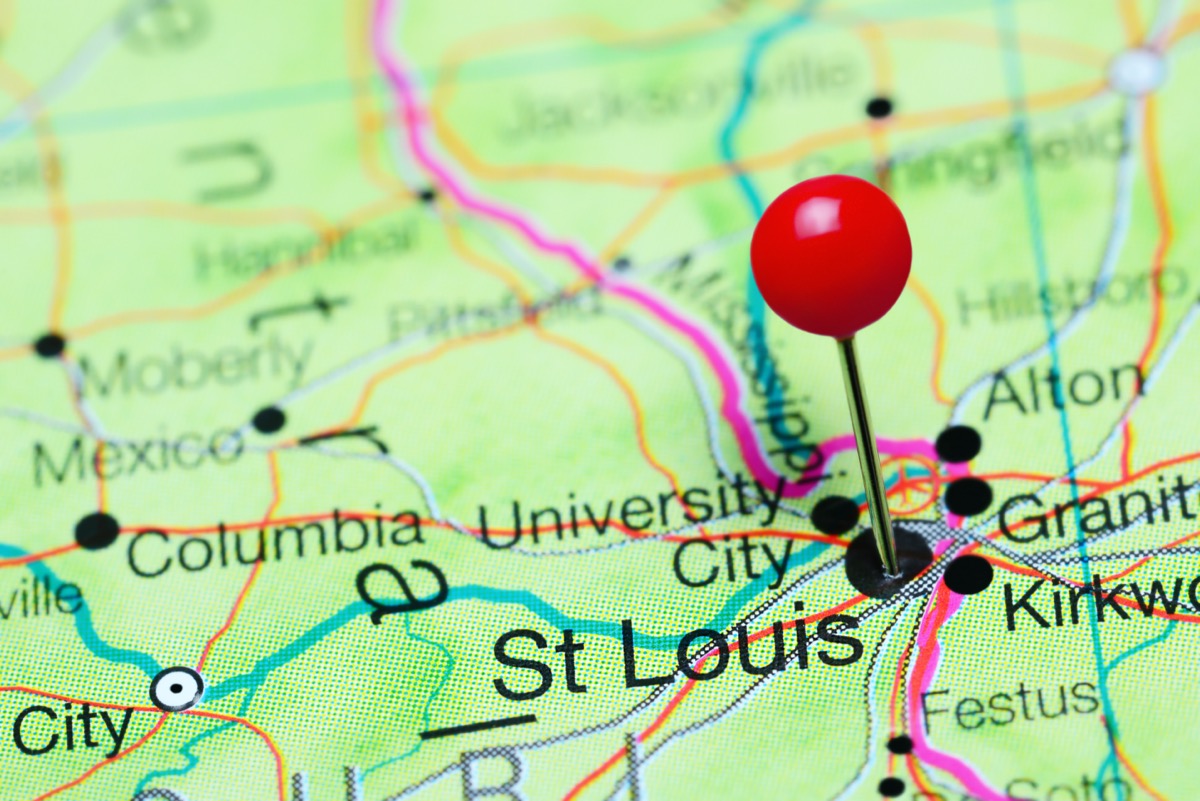
Crime score: 0.582
92
Fremont, California

Crime score: 0.582
91
Kansas City, Missouri
Crime score: 0.583
And for more helpful information delivered straight to your inbox, sign up for our daily newsletter.
90
West Covina, California
Crime score: 0.585
89
Durham, North Carolina

Crime score: 0.585
88
El Monte, California
Crime score: 0.587
And for the states that are slacking, These Are the Laziest States in the U.S.
87
Fullerton, California
Crime score: 0.587
86
Mesquite, Texas
Crime score: 0.587
85
Cedar Rapids, Iowa
Crime score: 0.589
84
Sacramento, California
Crime score: 0.590
83
Odessa, Texas
Crime score: 0.590
82
Bellevue, Washington
Crime score: 0.590
81
Phoenix, Arizona
Crime score: 0.591
80
North Charleston, South Carolina
Crime score: 0.591
79
Sioux Falls, South Dakota

Crime score: 0.592
78
North Las Vegas, Nevada
Crime score: 0.595
77
Columbus, Ohio
Crime score: 0.598
76
Nashville, Tennessee
Crime score: 0.599
75
Houston, Texas
Crime score: 0.599
74
Baton Rouge, Louisiana
Crime score: 0.599
73
Orlando, Florida
Crime score: 0.600
72
Pomona, California
Crime score: 0.602
71
Lakewood, Colorado
Crime score: 0.604
70
San Jose, California
Crime score: 0.604
69
Beaumont, Texas
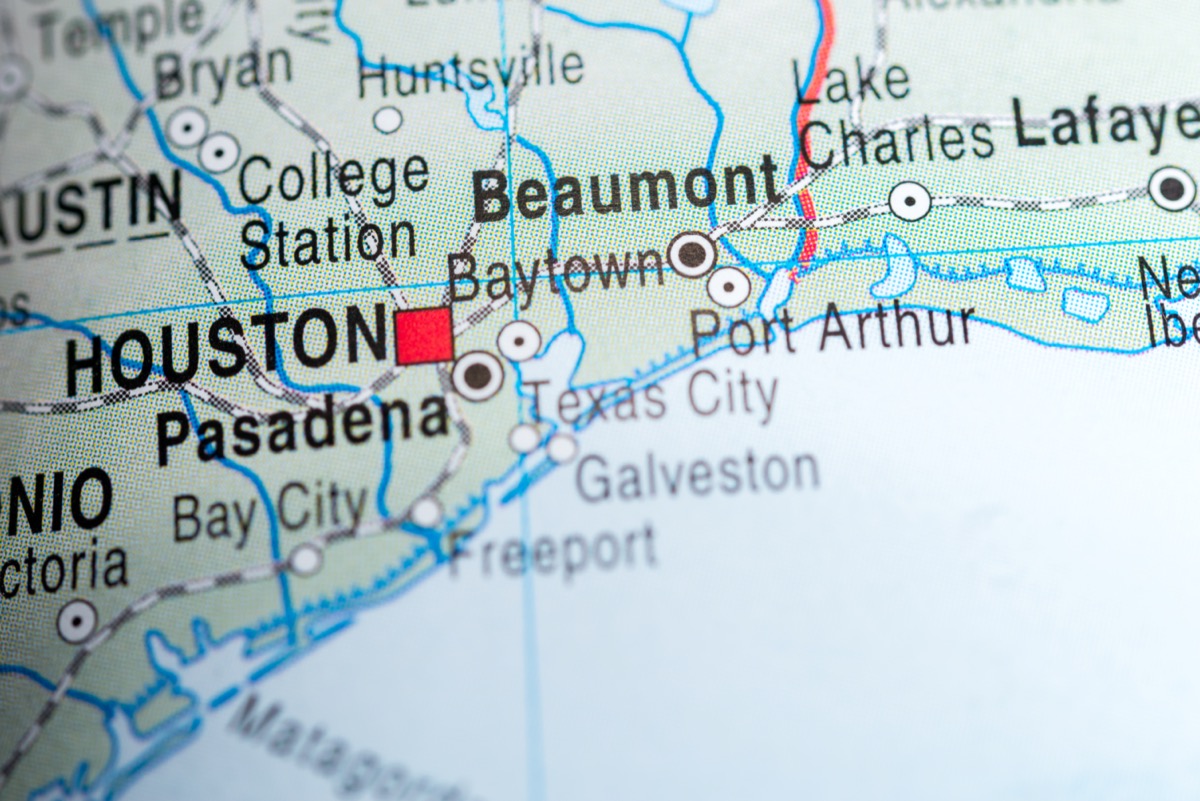
Crime score: 0.606
68
Lafayette, Louisiana
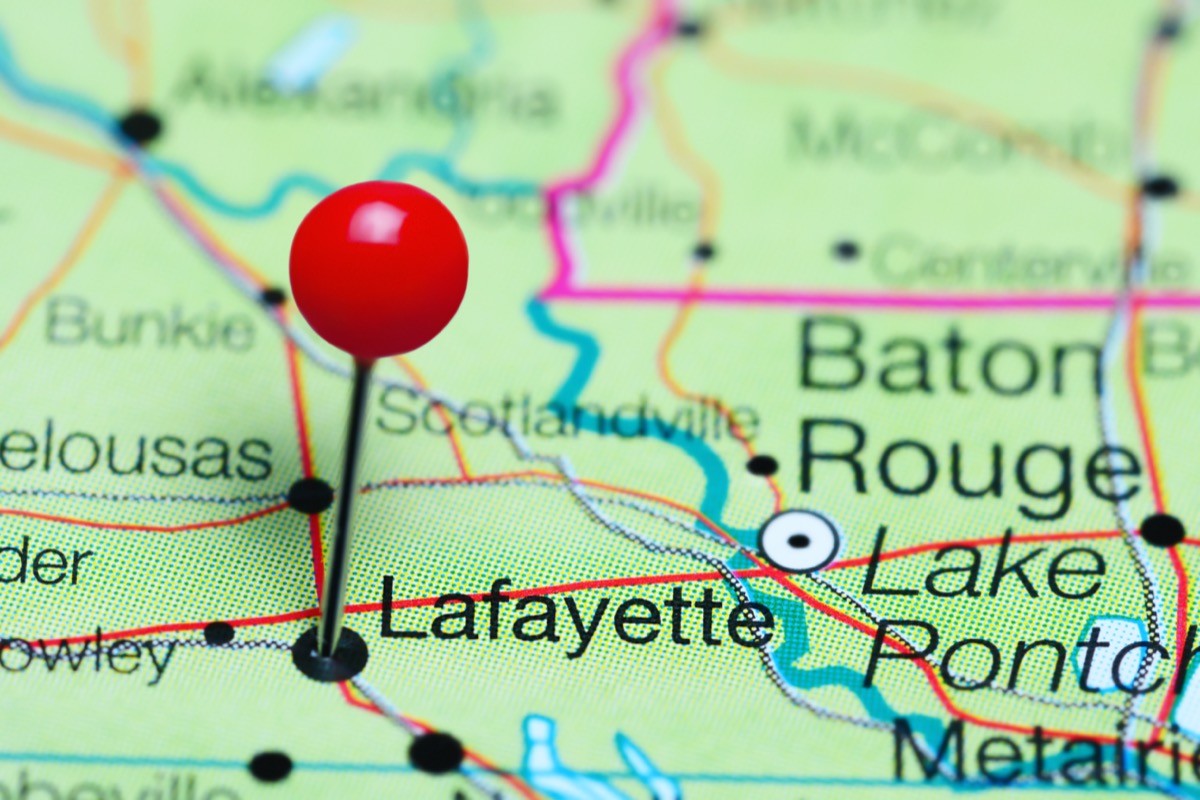
Crime score: 0.606
67
Garden Grove, California
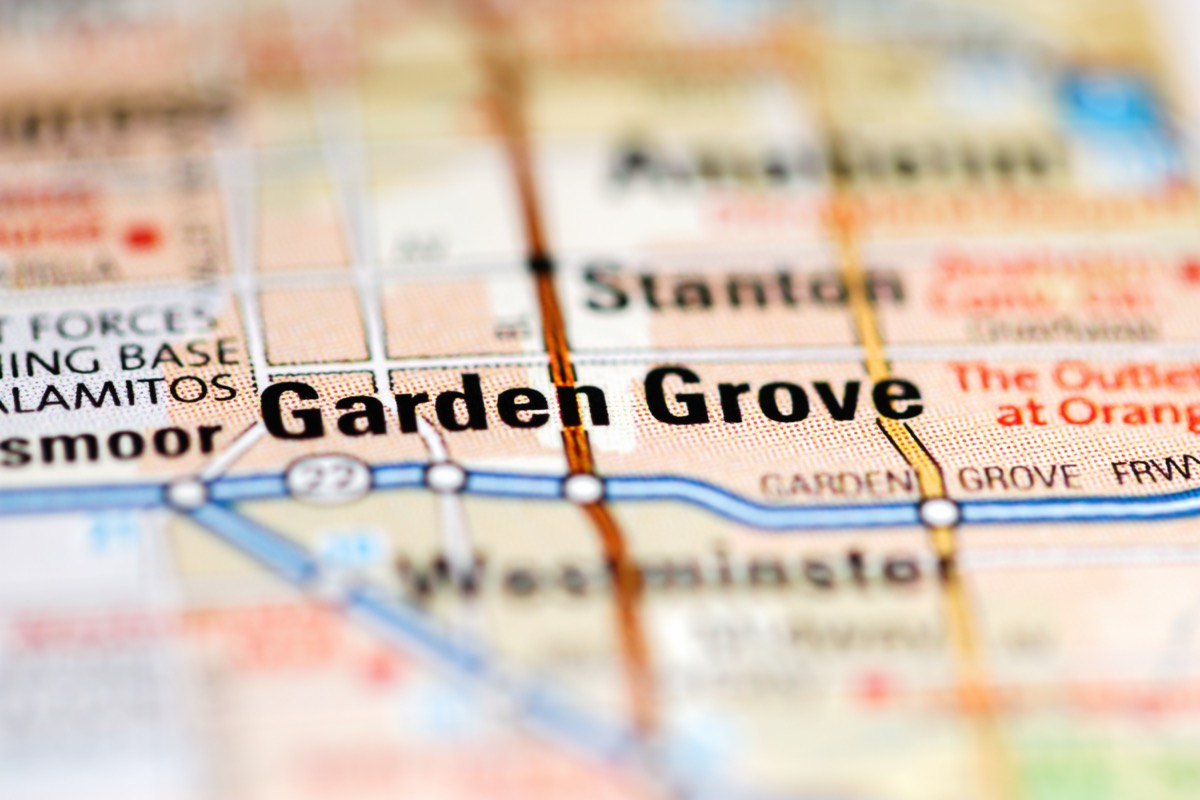
Crime score: 0.607
66
Akron, Ohio
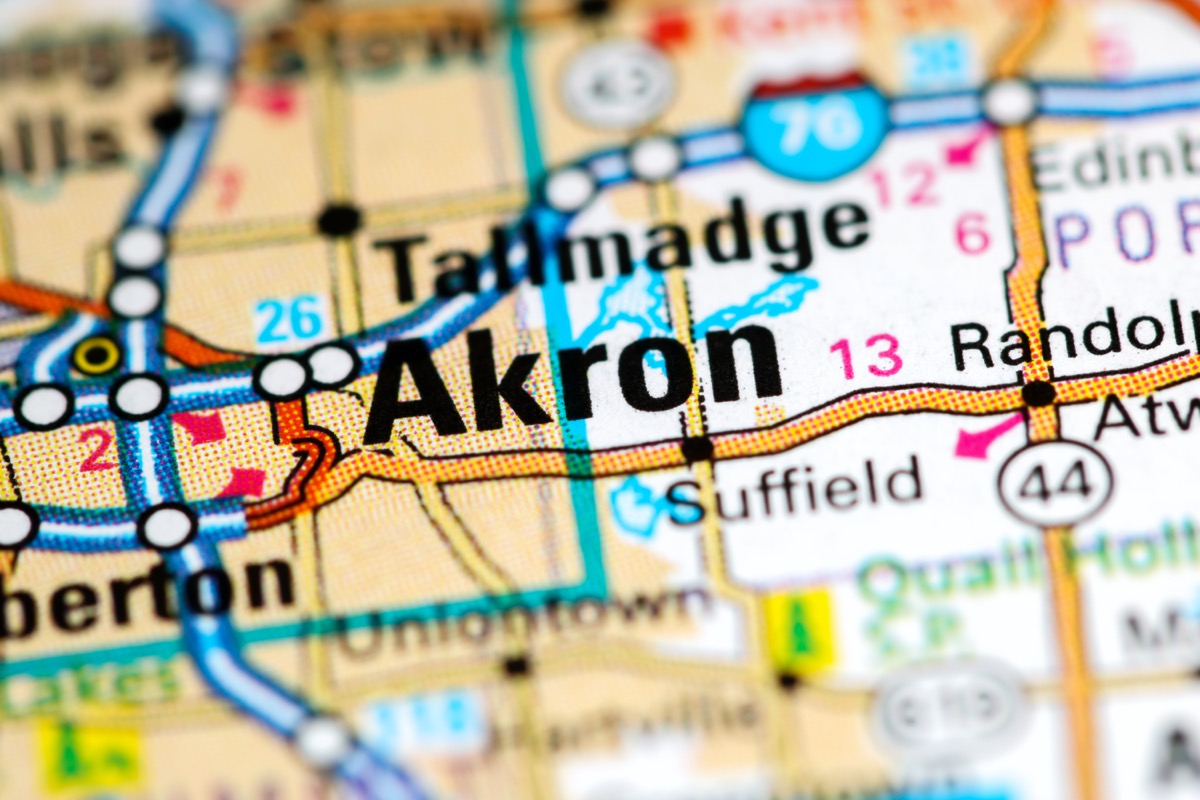
Crime score: 0.608
65
Omaha, Nebraska
Crime score: 0.609
64
Columbia, Missouri
Crime score: 0.609
63
Fargo, North Dakota
Crime score: 0.610
62
Richmond, California
Crime score: 0.610
61
Oklahoma City, Oklahoma
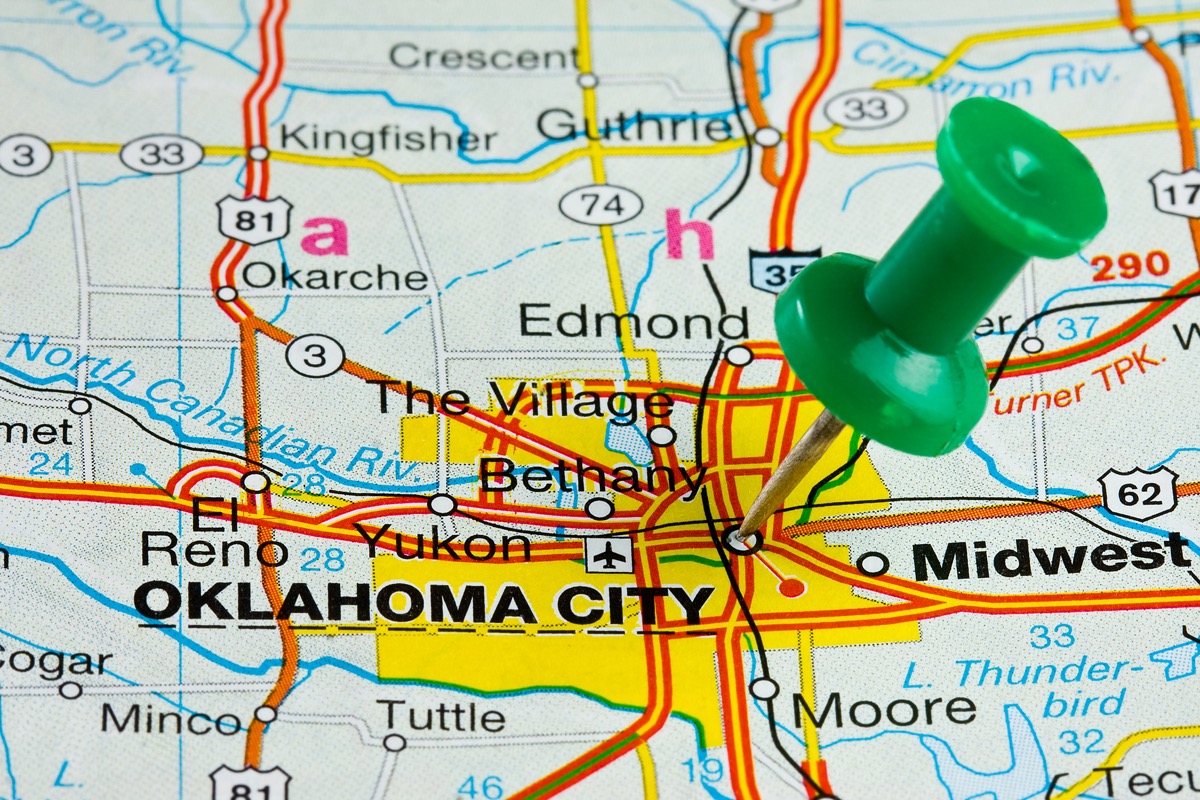
Crime score: 0.613
60
Fairfield, California

Crime score: 0.614
59
Fresno, California

Crime score: 0.614
58
Eugene, Oregon
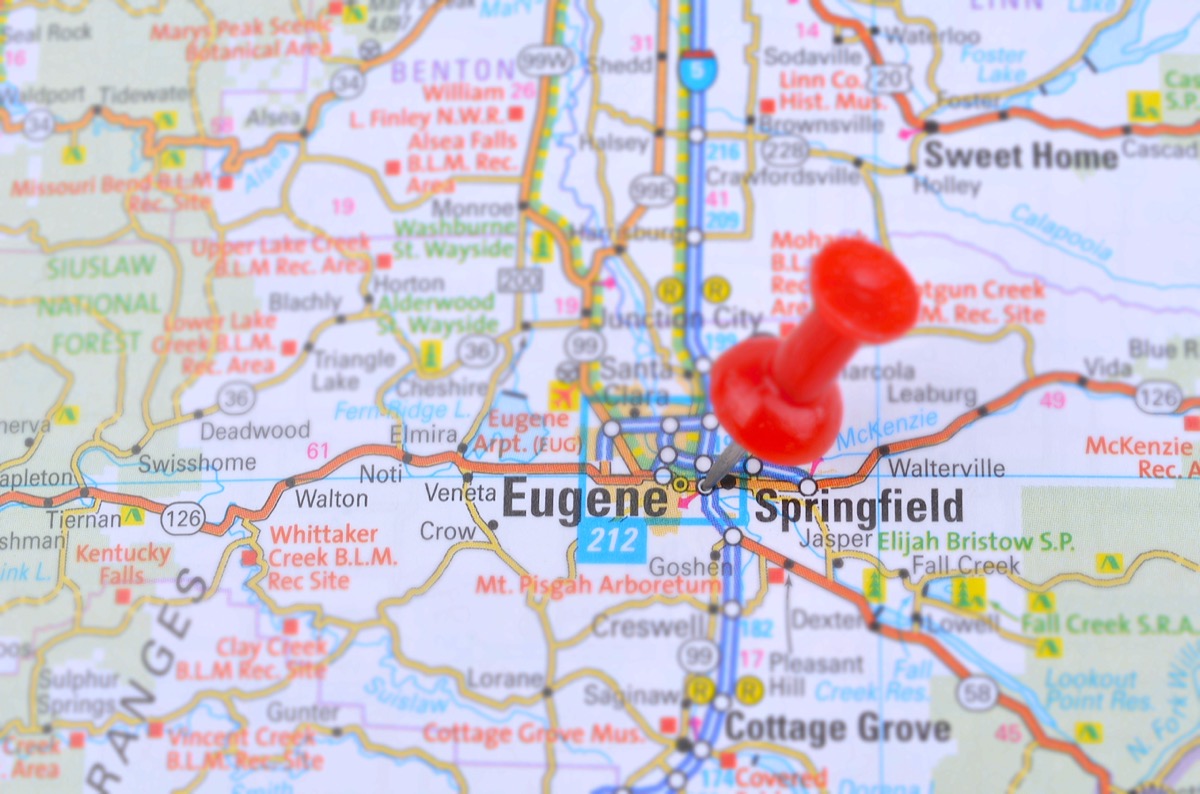
Crime score: 0.617
57
Columbia, South Carolina
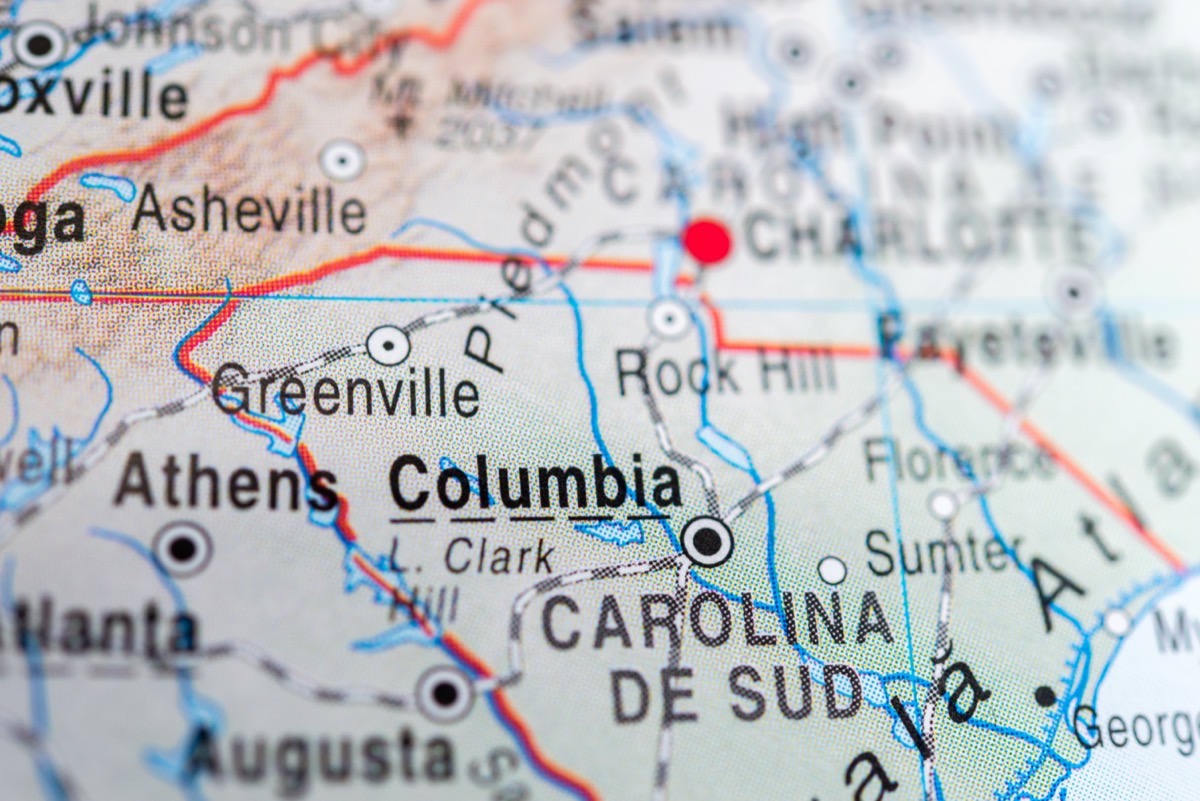
Crime score: 0.617
56
Downey, California
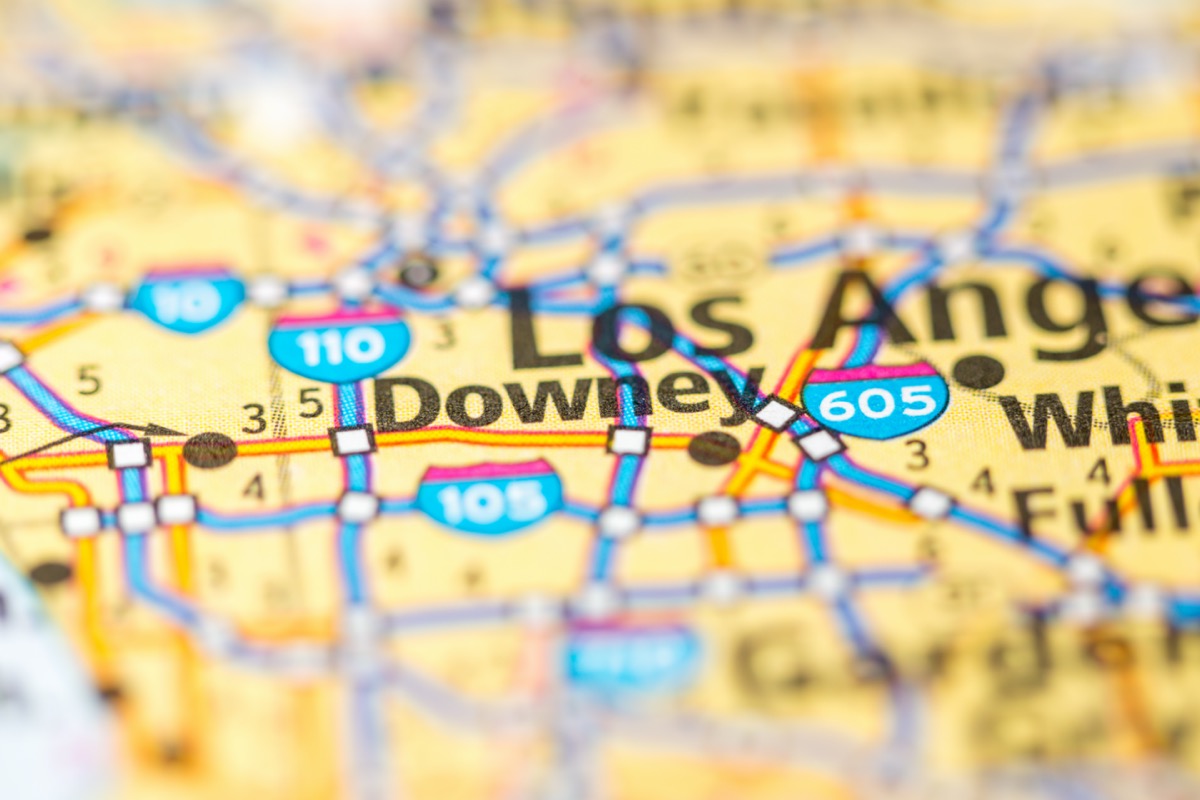
Crime score: 0.617
55
San Francisco, California
Crime score: 0.618
54
Shreveport, Louisiana
Crime score: 0.619
53
Ventura, California
Crime score: 0.619
52
Lexington, Kentucky
Crime score: 0.619
51
Seattle, Washington
Crime score: 0.621
50
Visalia, California

Crime score: 0.621
49
South Bend, Indiana
Crime score: 0.621
48
Riverside, California

Crime score: 0.622
47
Glendale, Arizona

Crime score: 0.623
46
Lansing, Michigan
Crime score: 0.624
45
Topeka, Kansas
Crime score: 0.624
44
Concord, California
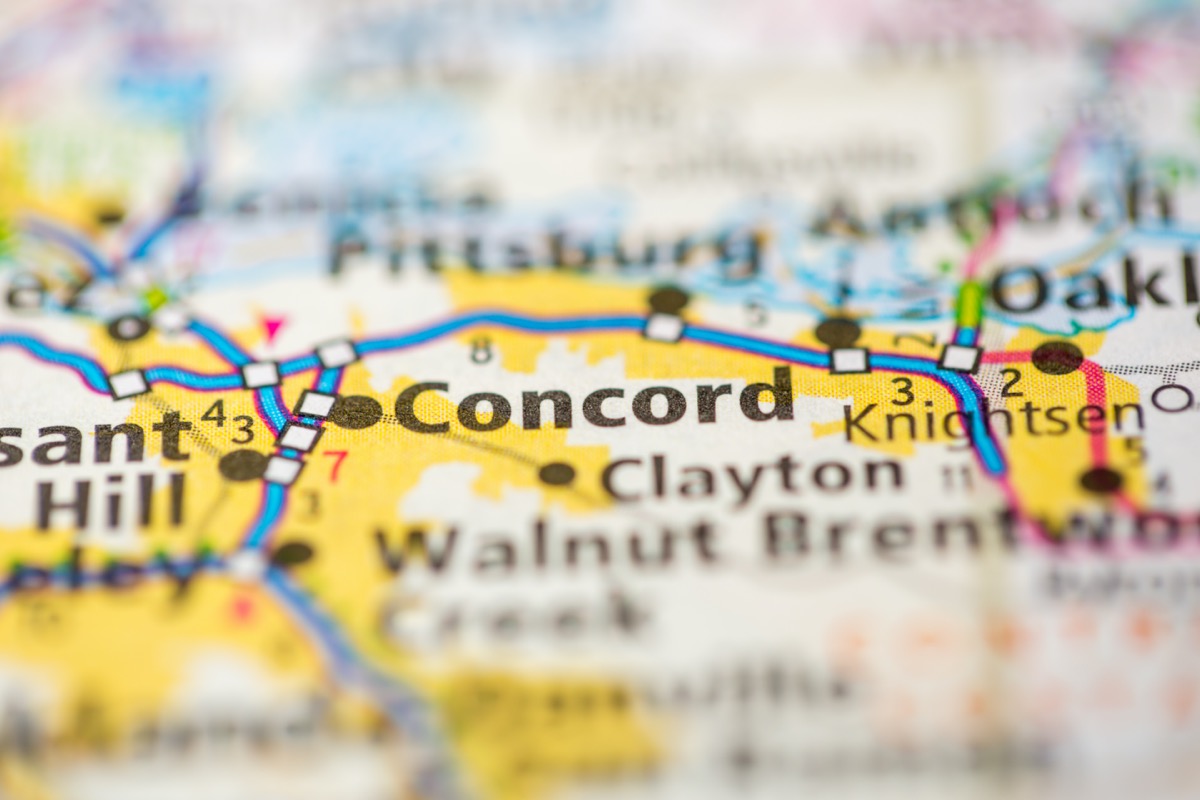
Crime score: 0.624
43
Vancouver, Washington

Crime score: 0.625
42
Corpus Christi, Texas
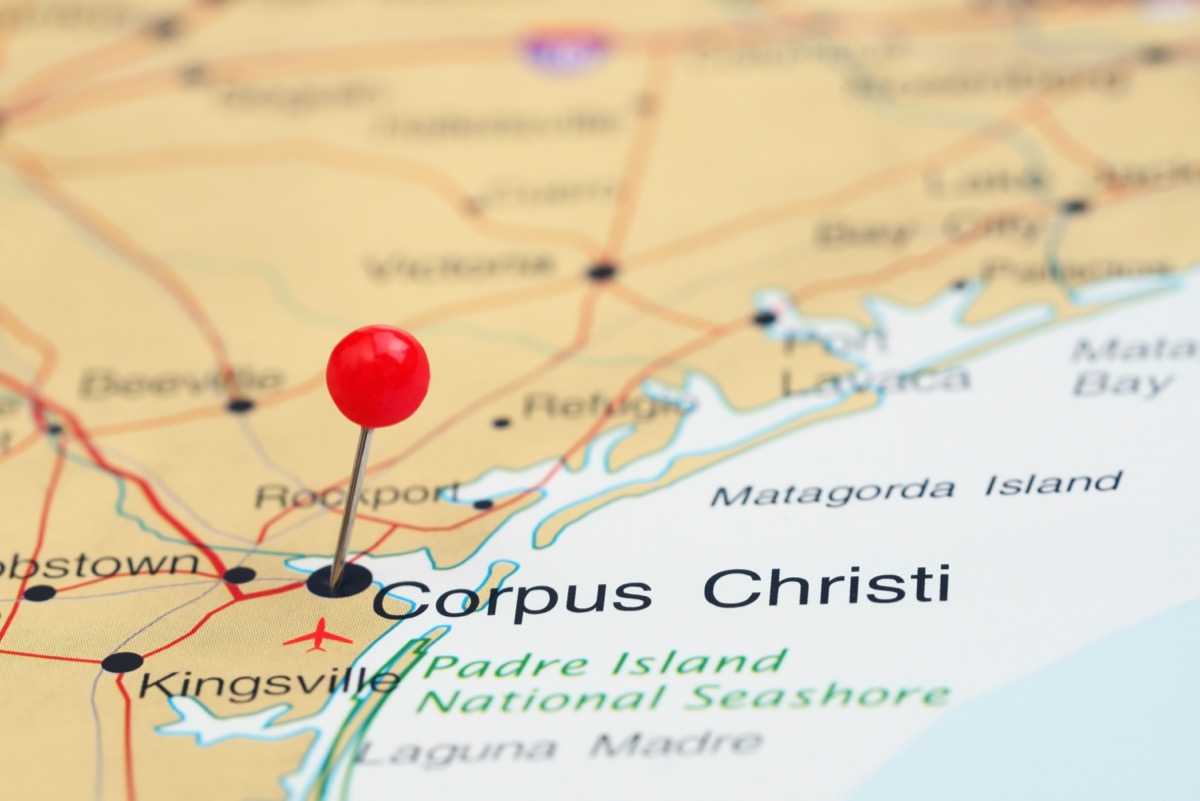
Crime score: 0.625
41
Salem, Oregon

Crime score: 0.625
40
Evansville, Indiana

Crime score: 0.626
39
San Angelo, Texas
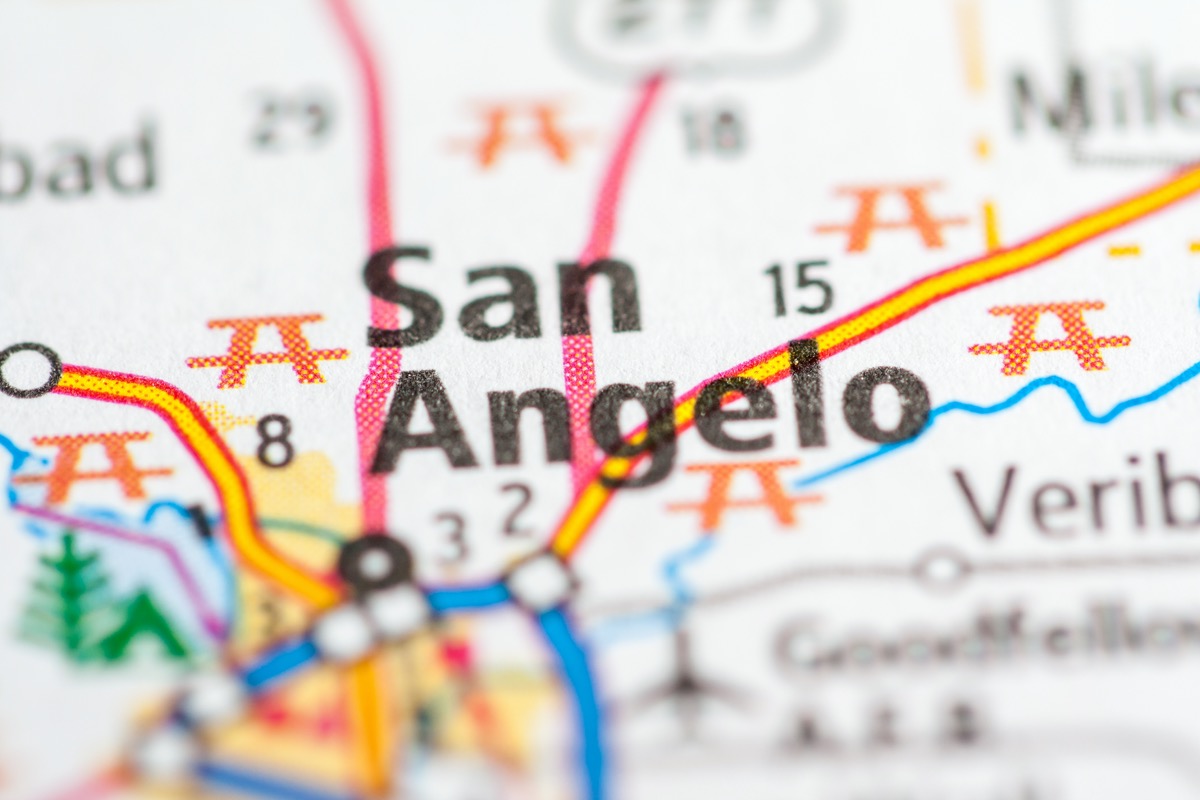
Crime score: 0.629
38
Reno, Nevada

Crime score: 0.629
37
Everett, Washington

Crime score: 0.635
36
Minneapolis, Minnesota
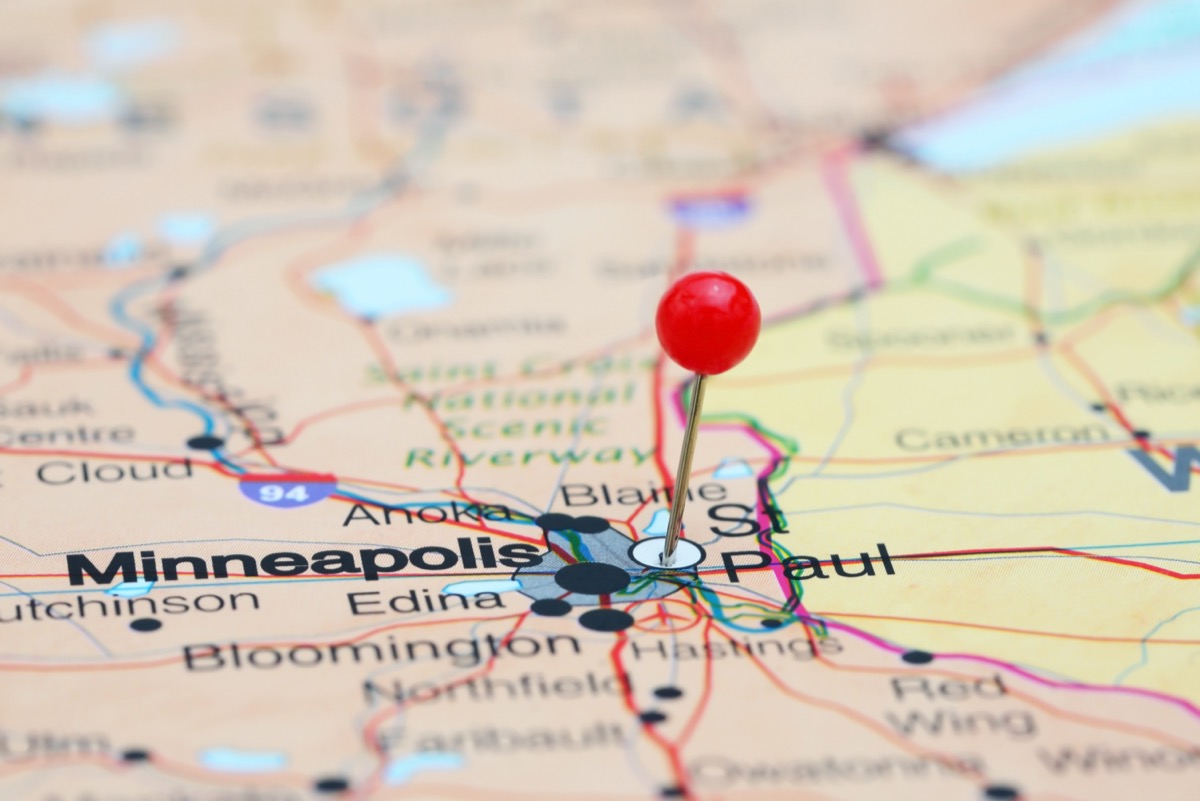
Crime score: 0.635
35
Rockford, Illinois
Crime score: 0.636
34
Des Moines, Iowa

Crime score: 0.637
33
Chattanooga, Tennessee
Crime score: 0.637
32
Costa Mesa, California
Crime score: 0.638
31
Memphis, Tennessee
Crime score: 0.641
30
Gresham, Oregon

Crime score: 0.642
29
Tallahassee, Florida
Crime score: 0.642
28
Knoxville, Tennessee
Crime score: 0.646
27
Springfield, Illinois
Crime score: 0.649
26
Salinas, California
Crime score: 0.652
25
Berkeley, California
Crime score: 0.658
24
Pompano Beach, Florida
Crime score: 0.659
23
Tucson, Arizona
Crime score: 0.665
22
Indianapolis, Indiana
Crime score: 0.665
21
Independence, Missouri
Crime score: 0.670
20
San Antonio, Texas
Crime score: 0.671
19
Tulsa, Oklahoma
Crime score: 0.671
18
San Bernardino, California
Crime score: 0.677
17
Little Rock, Arkansas
Crime score: 0.682
16
Antioch, California

Crime score: 0.689
15
Oakland, California
Crime score: 0.690
14
Bakersfield, California
Crime score: 0.692
13
Wichita, Kansas
Crime score: 0.693
12
Modesto, California
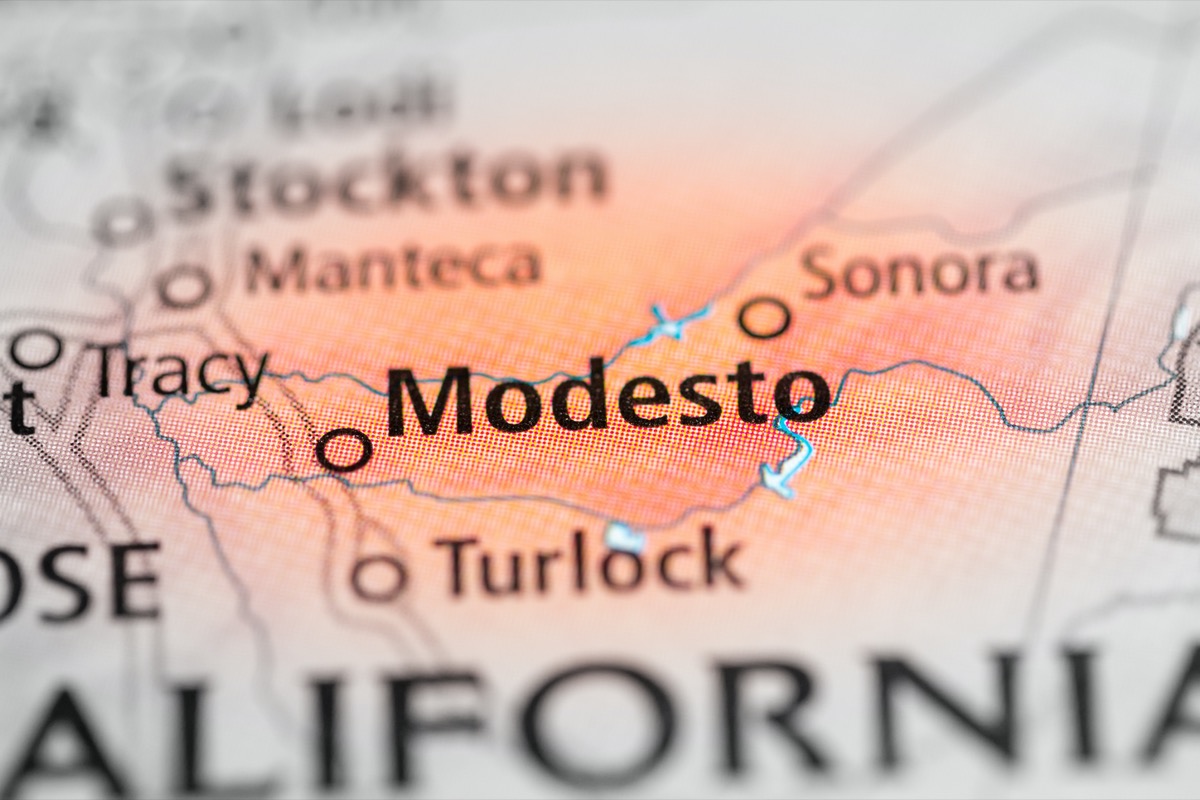
Crime score: 0.698
11
Pueblo, Colorado
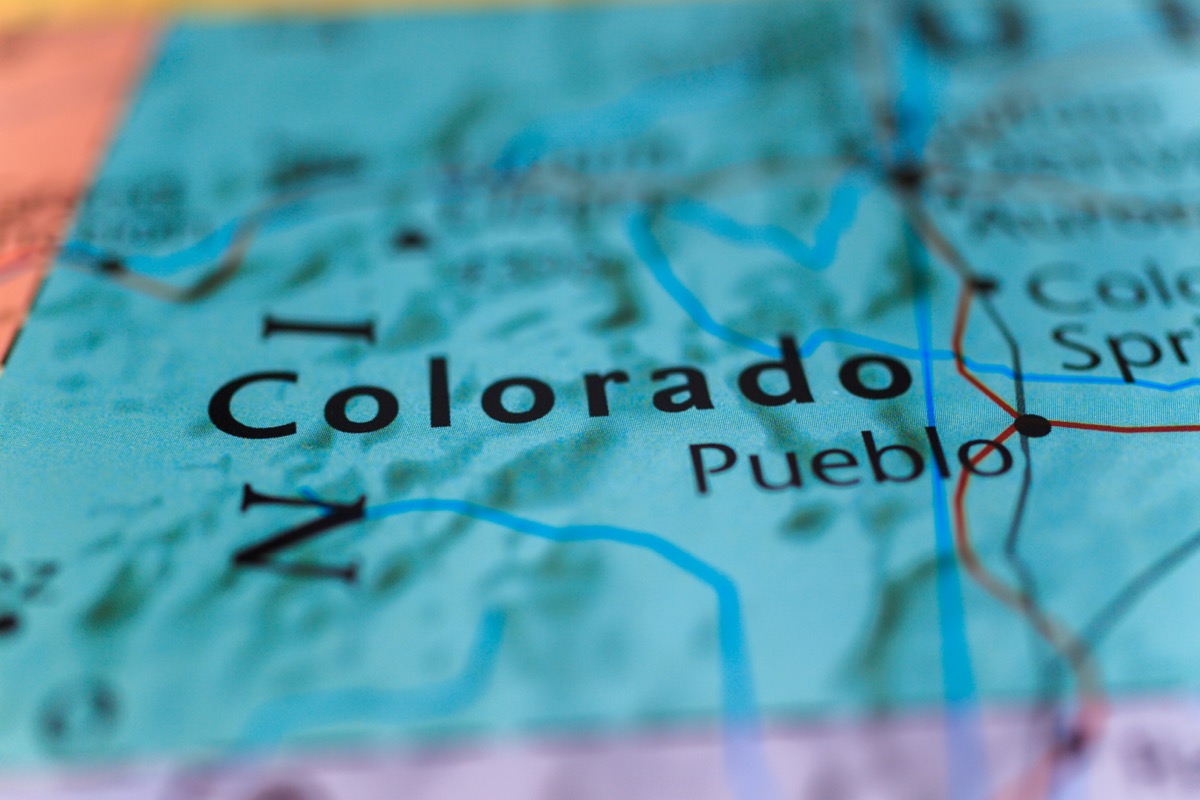
Crime score: 0.699
10
Davenport, Iowa
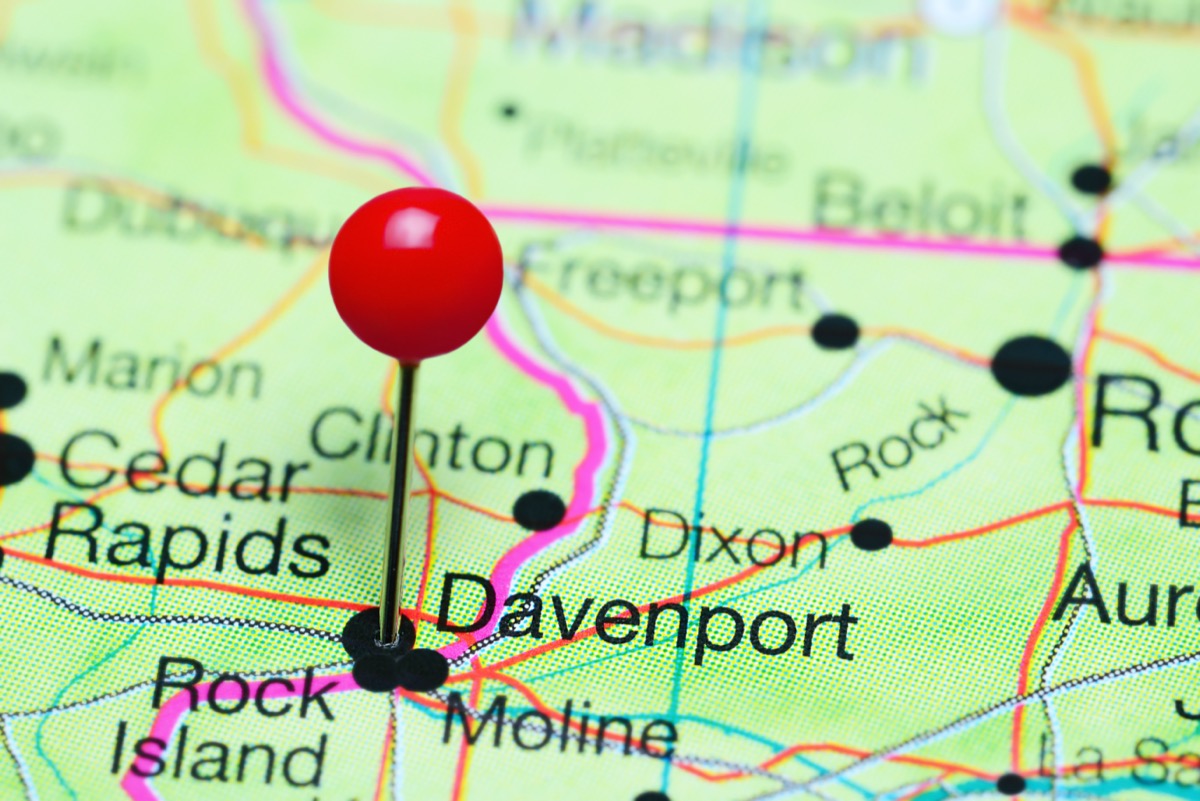
Crime score: 0.699
9
Portland, Oregon
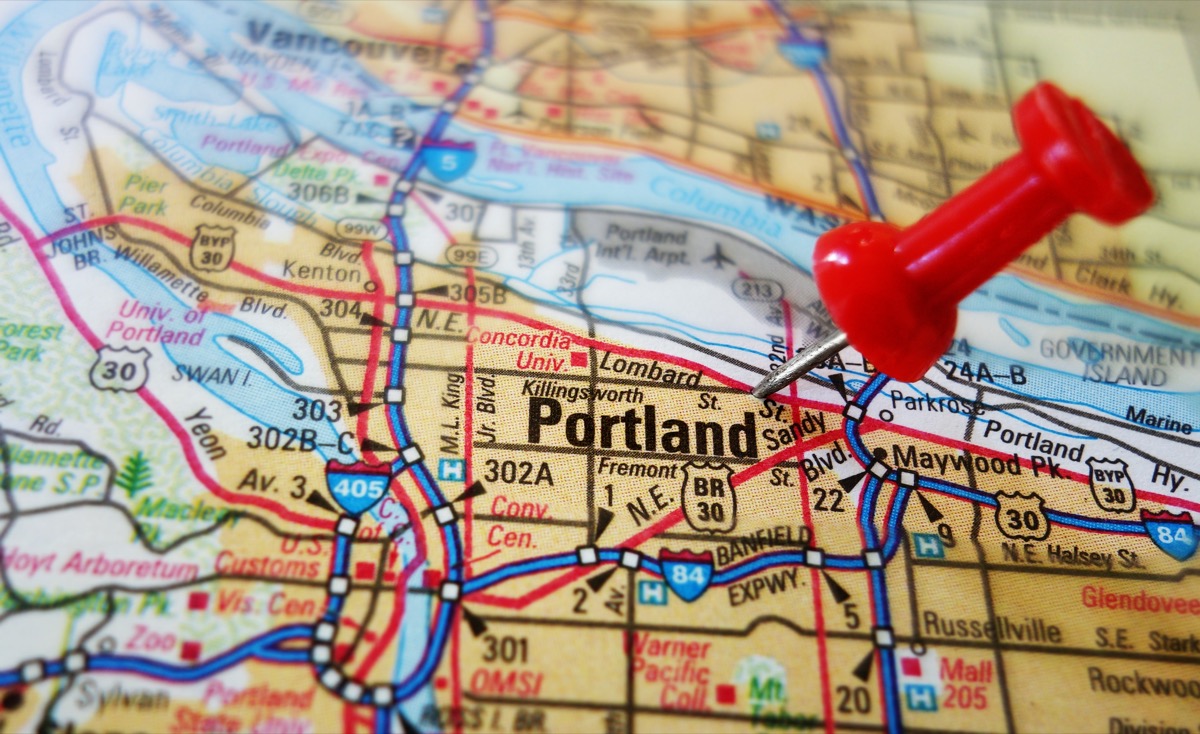
Crime score: 0.704
8
Renton, Washington
Crime score: 0.708
7
Kent, Washington
Crime score: 0.714
6
Anchorage, Alaska
Crime score: 0.716
5
Vallejo, California
Crime score: 0.717
4
Tacoma, Washington
Crime score: 0.719
3
Billings, Montana
Crime score: 0.723
2
Spokane, Washington
Crime score: 0.750
1
Springfield, Missouri
Crime score: 0.768
And for more on the dangers lurking in Missouri, here are These 4 States Are Now Seeing the Worst COVID Spikes in the U.S.