This Is the Least Successful State in the U.S.

Success—or a lack thereof—can often be in the eye of the beholder. While some people see money and material wealth as the basic definition of success, others might point to more intangible things, like one’s happiness or sense of fulfillment. But when it comes to determining whether a state as a whole is more or less successful than others, it’s important to use the most recent and measurable data points available. To start, we looked at the ratio of millionaires to total households in the state, compiled by Phoenix Marketing International, as well as the median household income, according to the U.S. Census (the lower these numbers, the less successful the state was considered). We combined these metrics with those that indicated economic challenges, including which states had the highest poverty rate, per the U.S. Census, and highest unemployment rate, according to the Bureau of Labor Statistics. Taking all of these numbers into account, we came up with a final “Unsuccessful Score” for each state.
In the end, the state that’s struggling the most may surprise you. Though it is known for its glitz and glamour, this western state has seen many setbacks, especially in 2020. It has an extremely high poverty rate and one of the worst unemployment rates in the country. Additionally, the median household income is only around $63,000, which is a staggering $23,000 less than the most successful state. To find out which state fared the worst, scroll through our ranking from the most successful to the least successful states. And for more state rivalries, This Is the Most Hated State in America.
50
Maryland

Percentage of millionaires in the state: 8.85 percent
Poverty rate: 9 percent
Median household income: $86,738
Unemployment rate: 7.2 percent
Unsuccessful Score: 0.26
And for more places that are struggling this year, This Is the Worst State to Live in Right Now.
49
Utah

Percentage of millionaires in the state: 6.39 percent
Poverty rate: 8.9 percent
Median household income: $75,780
Unemployment rate: 5 percent
Unsuccessful Score: 1.89
48
Colorado

Percentage of millionaires in the state: 7.48 percent
Poverty rate: 9.3 percent
Median household income: $77,127
Unemployment rate: 6.4 percent
Unsuccessful Score: 8.24
And for more states that could look better, This Is the Ugliest State in the U.S.
47
New Hampshire

Percentage of millionaires in the state: 6.06 percent
Poverty rate: 7.3 percent
Median household income: $77,933
Unemployment rate: 6 percent
Unsuccessful Score: 8.48
46
Nebraska

Percentage of millionaires in the state: 4.74 percent
Poverty rate: 9.9 percent
Median household income: $63,229
Unemployment rate: 3.5 percent
Unsuccessful Score: 8.54
45
Vermont

Percentage of millionaires in the state: 5.79 percent
Poverty rate: 10.2 percent
Median household income: $63,001
Unemployment rate: 4.2 percent
Unsuccessful Score: 8.67
44
New Jersey

Percentage of millionaires in the state: 6.69 percent
Poverty rate: 9.2 percent
Median household income: $85,751
Unemployment rate: 6.7 percent
Unsuccessful Score: 12.55
And if you want more state guides to read, sign up for our daily newsletter.
43
Connecticut

Percentage of millionaires in the state: 8.89 percent
Poverty rate: 10 percent
Median household income: $78,833
Unemployment rate: 7.8 percent
Unsuccessful Score: 12.91
42
Alaska

Percentage of millionaires in the state: 8.18 percent
Poverty rate: 10.1 percent
Median household income: $75,463
Unemployment rate: 7.2 percent
Unsuccessful Score: 14.22
41
Minnesota

Percentage of millionaires in the state: 6.00 percent
Poverty rate: 9 percent
Median household income: $74,593
Unemployment rate: 6 percent
Unsuccessful Score: 15.70
40
Wisconsin

Percentage of millionaires in the state: 5.83 percent
Poverty rate: 10.4 percent
Median household income: $64,168
Unemployment rate: 5.4 percent
Unsuccessful Score: 20.39
39
Virginia

Percentage of millionaires in the state: 5.45 percent
Poverty rate: 9.9 percent
Median household income: $76,456
Unemployment rate: 6.2 percent
Unsuccessful Score: 23.6
38
North Dakota
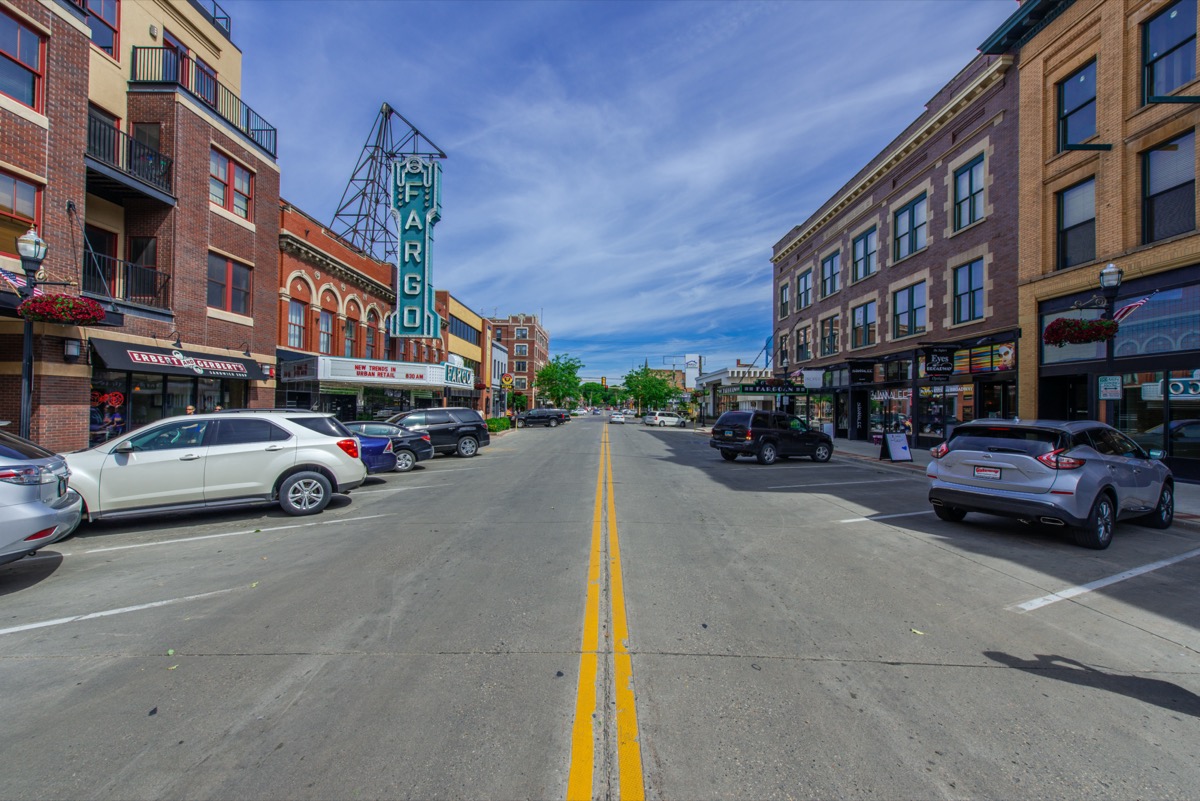
Percentage of millionaires in the state: 3.73 percent
Poverty rate: 10.6 percent
Median household income: $64,577
Unemployment rate: 4.4 percent
Unsuccessful Score: 26.54
37
Massachusetts

Percentage of millionaires in the state: 8.60 percent
Poverty rate: 9.4 percent
Median household income: $85,843
Unemployment rate: 9.6 percent
Unsuccessful Score: 27.78
36
South Dakota

Percentage of millionaires in the state: 3.89 percent
Poverty rate: 11.9 percent
Median household income: $59,533
Unemployment rate: 4.1 percent
Unsuccessful Score: 28.76
35
Wyoming

Percentage of millionaires in the state: 5.45 percent
Poverty rate: 10.1 percent
Median household income: $65,003
Unemployment rate: 6.1 percent
Unsuccessful Score: 28.92
34
Iowa

Percentage of millionaires in the state: 4.10 percent
Poverty rate: 11.2 percent
Median household income: $61,691
Unemployment rate: 4.7 percent
Unsuccessful Score: 30
33
Maine

Percentage of millionaires in the state: 5.60 percent
Poverty rate: 10.9 percent
Median household income: $58,924
Unemployment rate: 6.1 percent
Unsuccessful Score: 33.24
32
Missouri

Percentage of millionaires in the state: 4.43 percent
Poverty rate: 12.9 percent
Median household income: $57,409
Unemployment rate: 4.9 percent
Unsuccessful Score: 36.77
31
Kansas

Percentage of millionaires in the state: 4.48 percent
Poverty rate: 11.4 percent
Median household income: $62,087
Unemployment rate: 5.9 percent
Unsuccessful Score: 39.56
30
Montana

Percentage of millionaires in the state: 4.30 percent
Poverty rate: 12.6 percent
Median household income: $57,153
Unemployment rate: 5.3 percent
Unsuccessful Score: 40.97
29
Delaware

Percentage of millionaires in the state: 6.70 percent
Poverty rate: 11.3 percent
Median household income: $70,176
Unemployment rate: 8.2 percent
Unsuccessful Score: 41.56
28
Washington

Percentage of millionaires in the state: 4.86 percent
Poverty rate: 9.8 percent
Median household income: $78,687
Unemployment rate: 7.8 percent
Unsuccessful Score: 42.61
27
South Carolina

Percentage of millionaires in the state: 4.08 percent
Poverty rate: 13.8 percent
Median household income: $56,227
Unemployment rate: 5.1 percent
Unsuccessful Score: 44.69
26
Idaho

Percentage of millionaires in the state: 3.76 percent
Poverty rate: 11.2 percent
Median household income: $60,999
Unemployment rate: 6.1 percent
Unsuccessful Score: 46.9
25
Indiana

Percentage of millionaires in the state: 4.23 percent
Poverty rate: 11.9 percent
Median household income: $57,603
Unemployment rate: 6.2 percent
Unsuccessful Score: 48.17
24
Tennessee

Percentage of millionaires in the state: 5.21 percent
Poverty rate: 13.9 percent
Median household income: $56,071
Unemployment rate: 6.3 percent
Unsuccessful Score: 48.59
23
Georgia

Percentage of millionaires in the state: 4.67 percent
Poverty rate: 13.3 percent
Median household income: $61,980
Unemployment rate: 6.4 percent
Unsuccessful Score: 48.89
22
Arizona
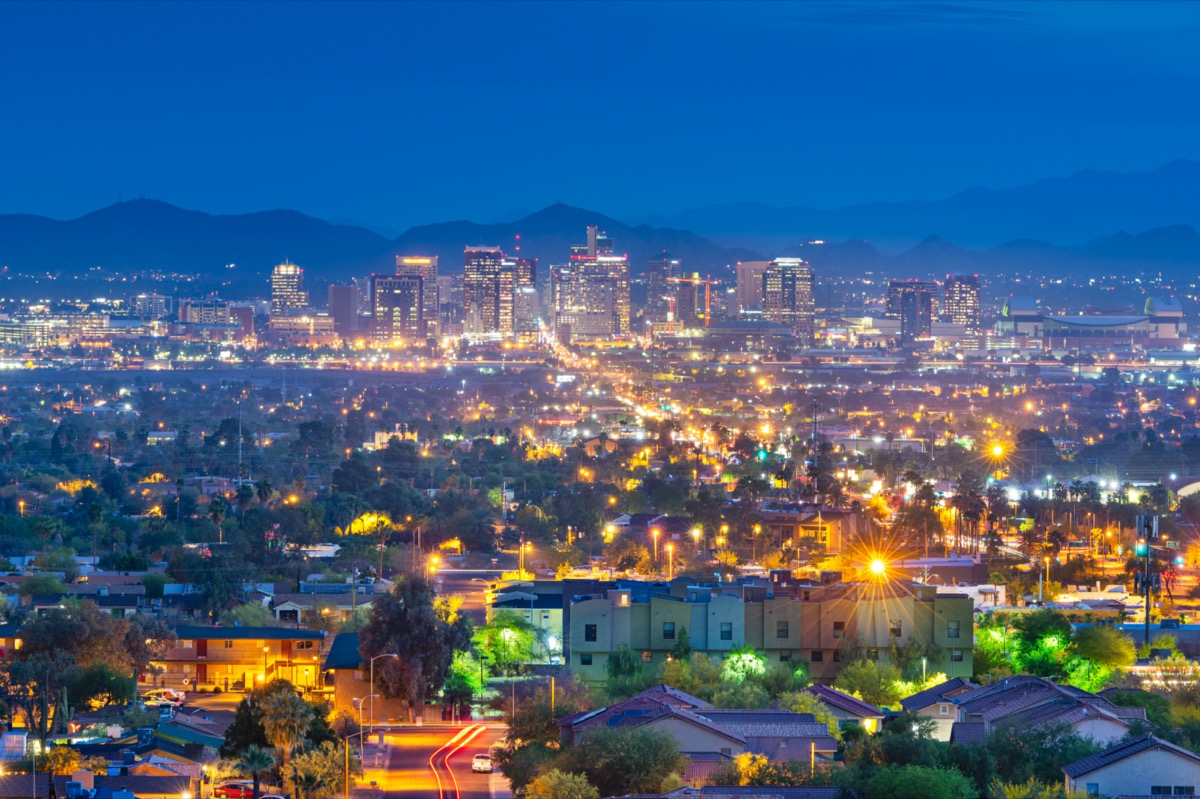
Percentage of millionaires in the state: 4.78 percent
Poverty rate: 13.5 percent
Median household income: $62,055
Unemployment rate: 6.7 percent
Unsuccessful Score: 51.62
21
California

Percentage of millionaires in the state: 8.51 percent
Poverty rate: 11.8 percent
Median household income: $80,440
Unemployment rate: 11 percent
Unsuccessful Score: 52.36
20
Florida
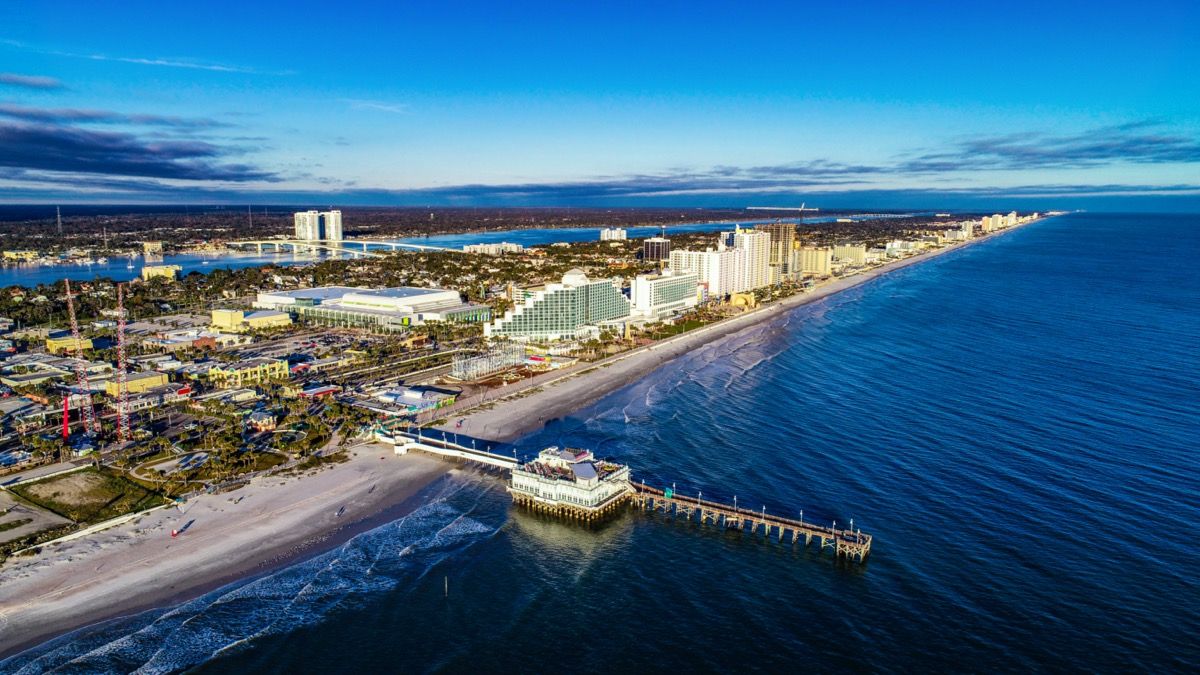
Percentage of millionaires in the state: 5.47 percent
Poverty rate: 12.7 percent
Median household income: $59,227
Unemployment rate: 7.6 percent
Unsuccessful Score: 54.46
19
Texas

Percentage of millionaires in the state: 6.32 percent
Poverty rate: 13.6 percent
Median household income: $64,034
Unemployment rate: 8.3 percent
Unsuccessful Score: 55.38
18
Oklahoma

Percentage of millionaires in the state: 3.51 percent
Poverty rate: 15.2 percent
Median household income: $54,449
Unemployment rate: 5.3 percent
Unsuccessful Score: 56.05
17
Pennsylvania

Percentage of millionaires in the state: 4.75 percent
Poverty rate: 12 percent
Median household income: $63,463
Unemployment rate: 8.1 percent
Unsuccessful Score: 60.64
16
Oregon

Percentage of millionaires in the state: 4.12 percent
Poverty rate: 11.4 percent
Median household income: $67,058
Unemployment rate: 8 percent
Unsuccessful Score: 60.77
15
Alabama
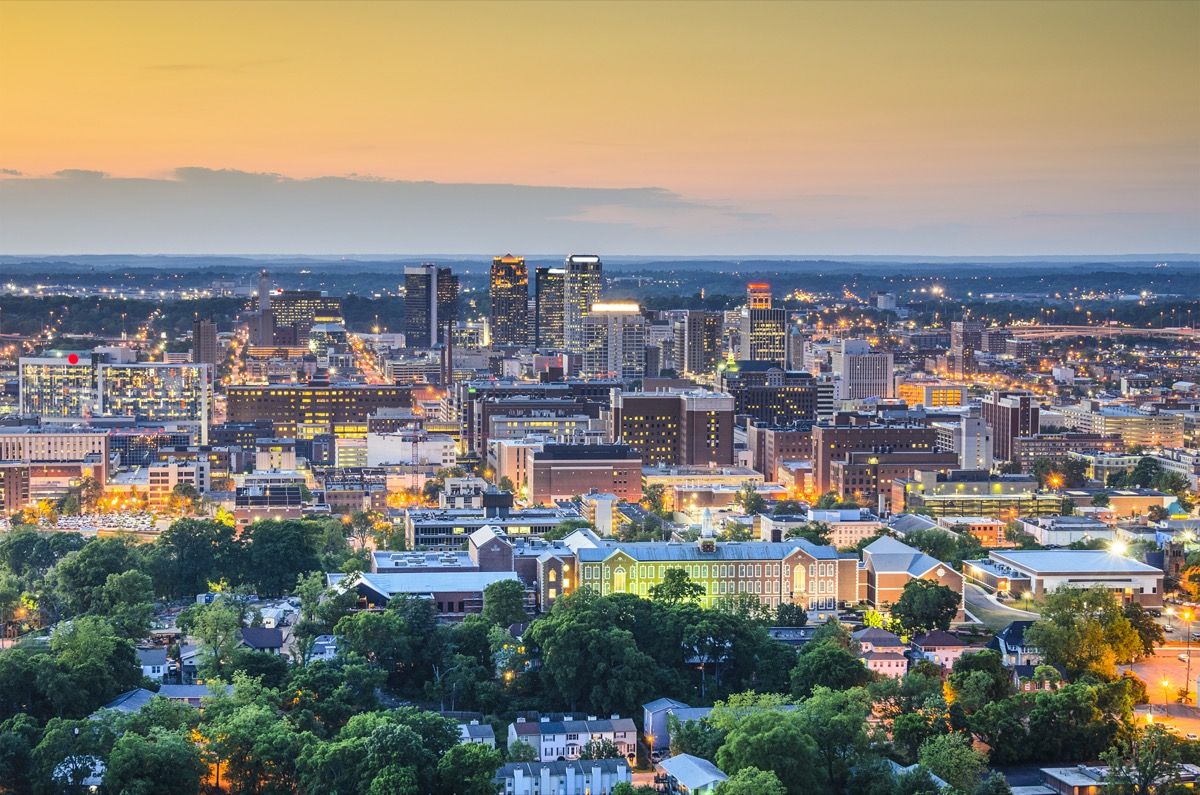
Percentage of millionaires in the state: 4.87 percent
Poverty rate: 15.5 percent
Median household income: $51,734
Unemployment rate: 6.6 percent
Unsuccessful Score: 61.11
14
Kentucky

Percentage of millionaires in the state: 3.71 percent
Poverty rate: 16.3 percent
Median household income: $52,295
Unemployment rate: 5.6 percent
Unsuccessful Score: 61.93
13
North Carolina

Percentage of millionaires in the state: 3.87 percent
Poverty rate: 13.6 percent
Median household income: $57,341
Unemployment rate: 7.3 percent
Unsuccessful Score: 67.1
12
Michigan

Percentage of millionaires in the state: 4.82 percent
Poverty rate: 13 percent
Median household income: $59,584
Unemployment rate: 8.5 percent
Unsuccessful Score: 69.06
11
New York

Percentage of millionaires in the state: 5.25 percent
Poverty rate: 13 percent
Median household income: $72,108
Unemployment rate: 9.7 percent
Unsuccessful Score: 71.57
10
Illinois

Percentage of millionaires in the state: 5.50 percent
Poverty rate: 11.5 percent
Median household income: $69,187
Unemployment rate: 10.2 percent
Unsuccessful Score: 71.66
9
Rhode Island

Percentage of millionaires in the state: 5.32 percent
Poverty rate: 10.8 percent
Median household income: $71,169
Unemployment rate: 10.5 percent
Unsuccessful Score: 72.92
8
Ohio

Percentage of millionaires in the state: 3.89 percent
Poverty rate: 13.1 percent
Median household income: $58,642
Unemployment rate: 8.4 percent
Unsuccessful Score: 75.80
7
Hawaii

Percentage of millionaires in the state: 9.20 percent
Poverty rate: 9.3 percent
Median household income: $83,102
Unemployment rate: 15.1 percent
Unsuccessful Score: 79.35
6
Arkansas

Percentage of millionaires in the state: 3.71 percent
Poverty rate: 16.2 percent
Median household income: $48,952
Unemployment rate: 7.3 percent
Unsuccessful Score: 80.3
5
Mississippi

Percentage of millionaires in the state: 3.94 percent
Poverty rate: 19.6 percent
Median household income: $45,792
Unemployment rate: 7.1 percent
Unsuccessful Score: 88.35
4
West Virginia

Percentage of millionaires in the state: 3.60 percent
Poverty rate: 16 percent
Median household income: $48,850
Unemployment rate: 8.6 percent
Unsuccessful Score: 93.58
3
Louisiana

Percentage of millionaires in the state: 3.79 percent
Poverty rate: 19 percent
Median household income: $51,073
Unemployment rate: 8.1 percent
Unsuccessful Score: 95.04
2
New Mexico

Percentage of millionaires in the state: 4.07 percent
Poverty rate: 18.2 percent
Median household income: $51,945
Unemployment rate: 9.4 percent
Unsuccessful Score: 103.1
1
Nevada

Percentage of millionaires in the state: 5.13 percent
Poverty rate: 12.5 percent
Median household income: $63,276
Unemployment rate: 12.6 percent
Unsuccessful Score: 104.39