This State Has the Worst Drivers in America

Country roads, city streets, or suburban lanes—no matter where you find yourself behind the wheel in the United States, you’ve likely encountered drivers who probably would be better off riding in the passenger’s seat. But when you look deeper, it’s clear certain regions have worse drivers than others. There are a lot of qualities that define a bad driver, but we’ve honed in on four key metrics to determine the state with the worst drivers in America.
First, we found the number of car accident fatalities per capita (100,000 people) using data from the U.S. Department of Transportation’s Fatality Analysis Reporting System and state population numbers from the U.S. Census Bureau. Next, we looked at the Insurance Research Council’s study of uninsured drivers to tell us what percentage of residents drive without insurance in each state. After that, we factored in Background Checks’ research on driving under the influence (DUI) of alcohol to show which states have the most DUI arrests per capita. Finally, we used data collected by, oddly enough, a Honda dealership in Yonkers, New York to tell us how many speeding tickets each state issued. This data originally covered six years, so we averaged it and divided it by each state’s population to tell us roughly how many speeding tickets each state issued per capita per year. (There was missing legible data for 11 states, which we’ve indicated with “N/A”.)
We then gave each of the four metrics a weighted value before running them through our exclusive algorithm to see how each state scored on our 100-point scale Bad Driver Index.
Out of all regions of the country, northeastern states seem to have the best drivers: New York had the fewest fatalities per capita, Maine the fewest uninsured drivers, and Delaware the fewest DUI arrests per capita, with only the fewest speeding tickets per capita (Alaska) bucking the trend. Curious to know who’s worst behind the wheel? Read on to discover the state with the worst drivers in America and to see how your state scored in comparison. And for a ranking that could contribute to dangerous driving, This Is the Angriest State in America.
50
Massachusetts

Car accident fatalities per capita: 5.22
Portion of uninsured drivers: 6.2 percent
DUI arrests per capita: 140.71
Speeding tickets per capita: N/A
Bad Driver Index Score: 0.00
49
Illinois
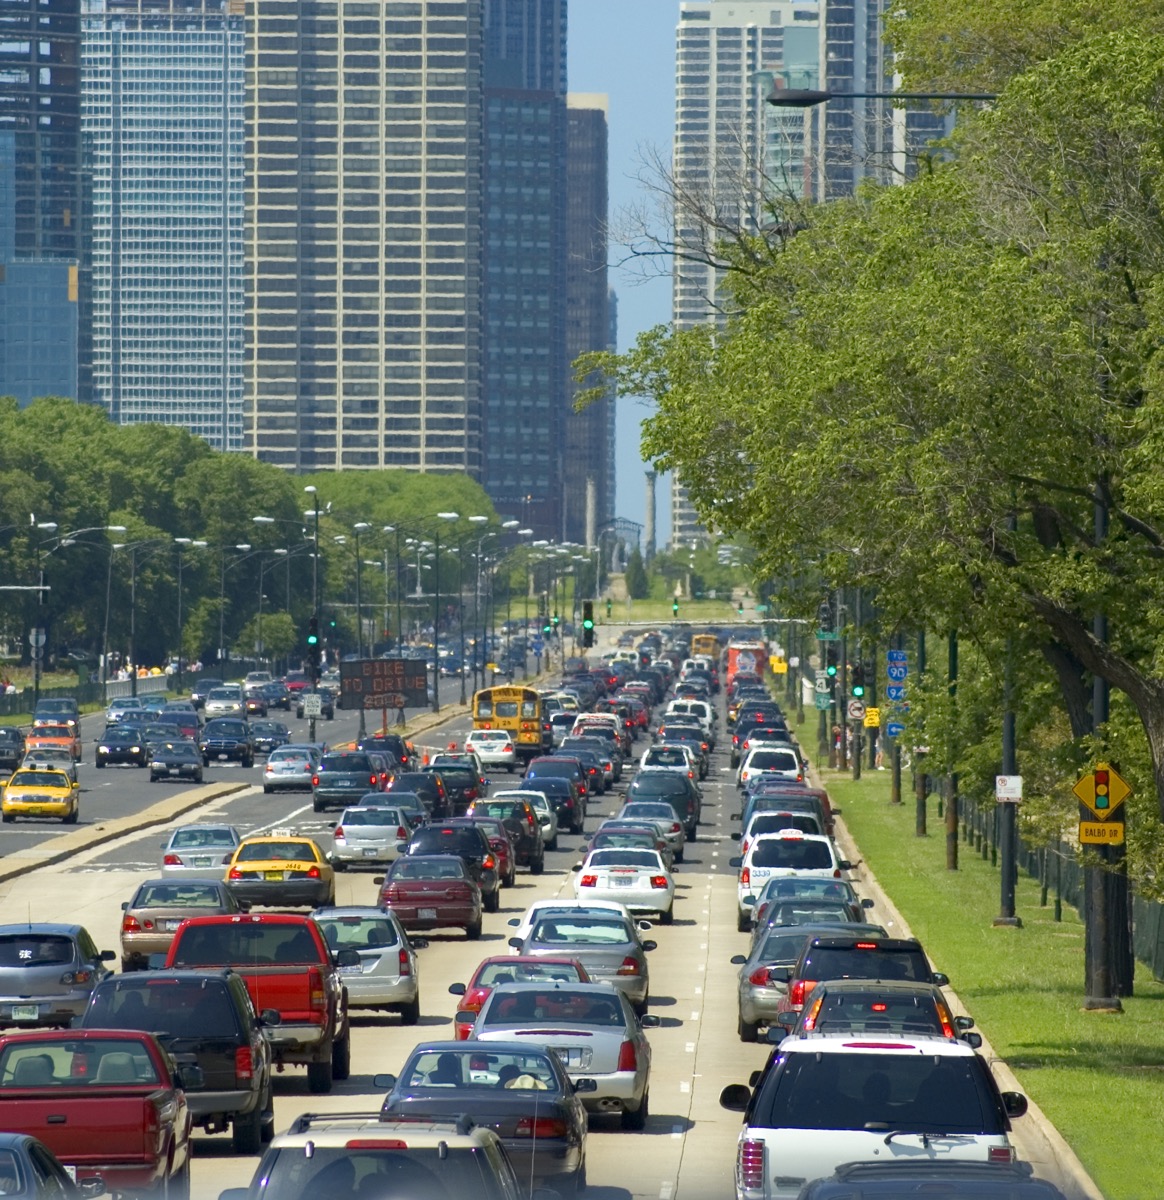
Car accident fatalities per capita: 8.09
Portion of uninsured drivers: 13.7 percent
DUI arrests per capita: 98.59
Speeding tickets per capita: 83.21
Bad Driver Index Score: 8.66
48
New York

Car accident fatalities per capita: 4.83
Portion of uninsured drivers: 6.1 percent
DUI arrests per capita: 262.18
Speeding tickets per capita: 519.47
Bad Driver Index Score: 16.52
47
Delaware

Car accident fatalities per capita: 11.48
Portion of uninsured drivers: 11.4 percent
DUI arrests per capita: 44.29
Speeding tickets per capita: N/A
Bad Driver Index Score: 19.20
46
Pennsylvania

Car accident fatalities per capita: 9.29
Portion of uninsured drivers: 7.6 percent
DUI arrests per capita: 346.79
Speeding tickets per capita: 199.32
Bad Driver Index Score: 20.16
45
Connecticut

Car accident fatalities per capita: 8.23
Portion of uninsured drivers: 9.4 percent
DUI arrests per capita: 216.44
Speeding tickets per capita: N/A
Bad Driver Index Score: 20.18
44
Virginia
Car accident fatalities per capita: 9.63
Portion of uninsured drivers: 9.9 percent
DUI arrests per capita: 253.45
Speeding tickets per capita: 245.38
Bad Driver Index Score: 20.72
43
Ohio
Car accident fatalities per capita: 9.14
Portion of uninsured drivers: 12.4 percent
DUI arrests per capita: 152.28
Speeding tickets per capita: 466.07
Bad Driver Index Score: 26.17
42
Rhode Island
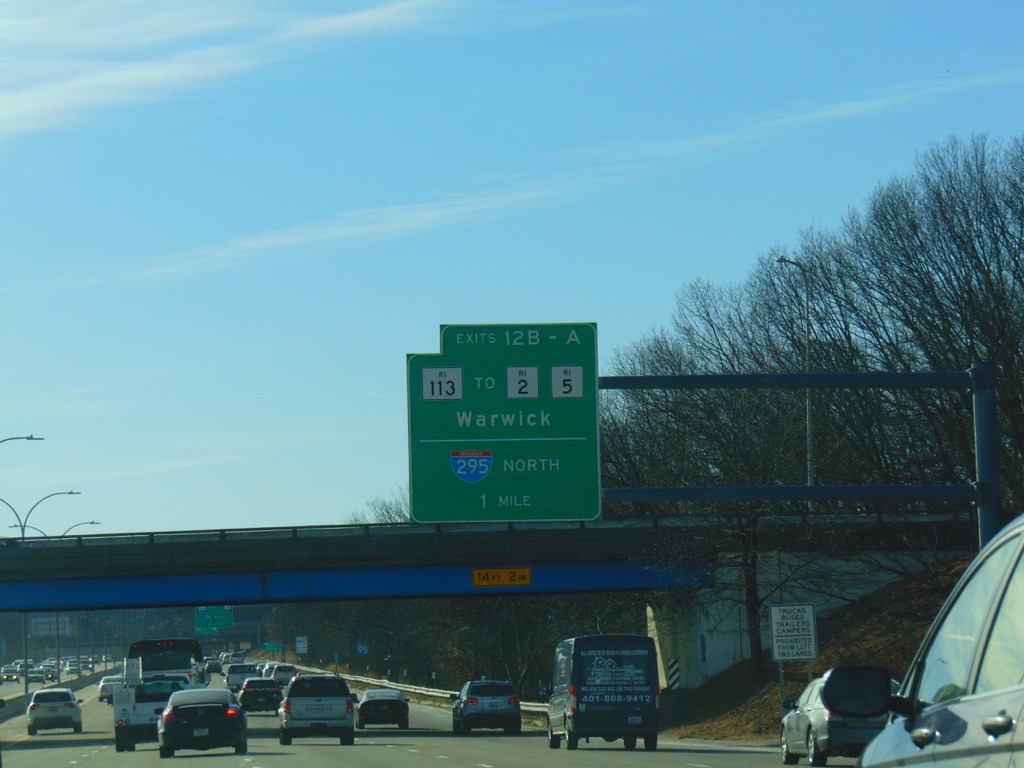
Car accident fatalities per capita: 5.58
Portion of uninsured drivers: 15.2 percent
DUI arrests per capita: 228.17
Speeding tickets per capita: N/A
Bad Driver Index Score: 26.66
41
New Jersey
Car accident fatalities per capita: 6.33
Portion of uninsured drivers: 14.9 percent
DUI arrests per capita: 219.64
Speeding tickets per capita: N/A
Bad Driver Index Score: 27.18
40
Texas
Car accident fatalities per capita: 12.69
Portion of uninsured drivers: 14.1 percent
DUI arrests per capita: 259.58
Speeding tickets per capita: 159.26
Bad Driver Index Score: 30.22
And for the place that is least hesitant to bend the rules, This Is the Most Corrupt State in America.
39
West Virginia

Car accident fatalities per capita: 16.28
Portion of uninsured drivers: 10.1 percent
DUI arrests per capita: 298.54
Speeding tickets per capita: 101.55
Bad Driver Index Score: 30.80
38
Maine

Car accident fatalities per capita: 10.24
Portion of uninsured drivers: 4.5 percent
DUI arrests per capita: 434.17
Speeding tickets per capita: 429.40
Bad Driver Index Score: 30.84
37
Utah
Car accident fatalities per capita: 8.22
Portion of uninsured drivers: 8.2 percent
DUI arrests per capita: 266.53
Speeding tickets per capita: 645.19
Bad Driver Index Score: 31.25
36
Nebraska

Car accident fatalities per capita: 11.92
Portion of uninsured drivers: 6.8 percent
DUI arrests per capita: 305.38
Speeding tickets per capita: 460.60
Bad Driver Index Score: 31.33
35
Michigan
Car accident fatalities per capita: 9.74
Portion of uninsured drivers: 20.3 percent
DUI arrests per capita: 265.07
Speeding tickets per capita: 99.29
Bad Driver Index Score: 32.46
34
Colorado
Car accident fatalities per capita: 11.10
Portion of uninsured drivers: 13.3 percent
DUI arrests per capita: 410.96
Speeding tickets per capita: 106.96
Bad Driver Index Score: 32.78
33
Alaska

Car accident fatalities per capita: 10.85
Portion of uninsured drivers: 15.4 percent
DUI arrests per capita: 429.03
Speeding tickets per capita: 4.94
Bad Driver Index Score: 32.81
32
Minnesota

Car accident fatalities per capita: 6.79
Portion of uninsured drivers: 11.5 percent
DUI arrests per capita: 362.35
Speeding tickets per capita: 487.04
Bad Driver Index Score: 33.34
31
Maryland
Car accident fatalities per capita: 8.29
Portion of uninsured drivers: 12.4 percent
DUI arrests per capita: 308.71
Speeding tickets per capita: N/A
Bad Driver Index Score: 33.79
30
Oklahoma
Car accident fatalities per capita: 16.61
Portion of uninsured drivers: 10.5 percent
DUI arrests per capita: 225.07
Speeding tickets per capita: 265.44
Bad Driver Index Score: 33.97
29
Hawaii

Car accident fatalities per capita: 8.24
Portion of uninsured drivers: 10.6 percent
DUI arrests per capita: 373.48
Speeding tickets per capita: N/A
Bad Driver Index Score: 34.90
28
Kansas
Car accident fatalities per capita: 13.88
Portion of uninsured drivers: 7.2 percent
DUI arrests per capita: 347.94
Speeding tickets per capita: 388.53
Bad Driver Index Score: 35.40
27
Vermont
Car accident fatalities per capita: 10.86
Portion of uninsured drivers: 6.8 percent
DUI arrests per capita: 418.37
Speeding tickets per capita: N/A
Bad Driver Index Score: 37.14
26
California
Car accident fatalities per capita: 9.01
Portion of uninsured drivers: 15.2 percent
DUI arrests per capita: 322.71
Speeding tickets per capita: 382.14
Bad Driver Index Score: 37.08
And for the place where people are least inhibited in the bedroom, This Is the Freakiest State in America.
25
Missouri
Car accident fatalities per capita: 15.03
Portion of uninsured drivers: 14 percent
DUI arrests per capita: 219.61
Speeding tickets per capita: 291.12
Bad Driver Index Score: 37.14
24
Nevada

Car accident fatalities per capita: 10.88
Portion of uninsured drivers: 10.6 percent
DUI arrests per capita: 364.51
Speeding tickets per capita: 430.13
Bad Driver Index Score: 37.62
23
New Hampshire

Car accident fatalities per capita: 10.84
Portion of uninsured drivers: 9.9 percent
DUI arrests per capita: 383.60
Speeding tickets per capita: N/A
Bad Driver Index Score: 40.77
22
Idaho

Car accident fatalities per capita: 13.17
Portion of uninsured drivers: 8.2 percent
DUI arrests per capita: 365.86
Speeding tickets per capita: 512.39
Bad Driver Index Score: 41.36
21
Montana

Car accident fatalities per capita: 17.13
Portion of uninsured drivers: 9.9 percent
DUI arrests per capita: 381.24
Speeding tickets per capita: 222.35
Bad Driver Index Score: 41.47
20
North Dakota
Car accident fatalities per capita: 13.81
Portion of uninsured drivers: 6.8 percent
DUI arrests per capita: 678.35
Speeding tickets per capita: 85.35
Bad Driver Index Score: 42.43
19
Louisiana

Car accident fatalities per capita: 16.48
Portion of uninsured drivers: 13.0 percent
DUI arrests per capita: 142.88
Speeding tickets per capita: N/A
Bad Driver Index Score: 42.82
18
Iowa

Car accident fatalities per capita: 10.08
Portion of uninsured drivers: 8.7 percent
DUI arrests per capita: 375.23
Speeding tickets per capita: 675.99
Bad Driver Index Score: 43.02
17
Wisconsin
Car accident fatalities per capita: 10.11
Portion of uninsured drivers: 14.3 percent
DUI arrests per capita: 425.26
Speeding tickets per capita: 394.30
Bad Driver Index Score: 44.18
16
Alabama
Car accident fatalities per capita: 19.50
Portion of uninsured drivers: 18.4 percent
DUI arrests per capita: 208.12
Speeding tickets per capita: 105.57
Bad Driver Index Score: 44.82
15
Arizona

Car accident fatalities per capita: 14.08
Portion of uninsured drivers: 12.0 percent
DUI arrests per capita: 291.52
Speeding tickets per capita: 536.00
Bad Driver Index Score: 45.63
And for more exclusive state guides delivered straight to your inbox, sign up for our daily newsletter.
14
Kentucky

Car accident fatalities per capita: 16.20
Portion of uninsured drivers: 11.5 percent
DUI arrests per capita: 423.13
Speeding tickets per capita: 268.83
Bad Driver Index Score: 46.42
13
Indiana

Car accident fatalities per capita: 12.82
Portion of uninsured drivers: 16.7 percent
DUI arrests per capita: 295.37
Speeding tickets per capita: 435.72
Bad Driver Index Score: 47.08
12
Tennessee

Car accident fatalities per capita: 15.38
Portion of uninsured drivers: 20.0 percent
DUI arrests per capita: 300.28
Speeding tickets per capita: 332.71
Bad Driver Index Score: 53.50
11
North Carolina

Car accident fatalities per capita: 13.84
Portion of uninsured drivers: 6.5 percent
DUI arrests per capita: 518.82
Speeding tickets per capita: 734.48
Bad Driver Index Score: 57.24
10
Arkansas
Car accident fatalities per capita: 17.12
Portion of uninsured drivers: 16.6 percent
DUI arrests per capita: 218.21
Speeding tickets per capita: N/A
Bad Driver Index Score: 57.82
9
Washington

Car accident fatalities per capita: 7.25
Portion of uninsured drivers: 17.4 percent
DUI arrests per capita: 430.19
Speeding tickets per capita: 801.68
Bad Driver Index Score: 59.31
8
Florida

Car accident fatalities per capita: 14.71
Portion of uninsured drivers: 26.7 percent
DUI arrests per capita: 150.98
Speeding tickets per capita: 479.50
Bad Driver Index Score: 59.63
And for the place where people can never seem to get enough, This Is the Greediest State in America.
7
Georgia

Car accident fatalities per capita: 14.30
Portion of uninsured drivers: 12.0 percent
DUI arrests per capita: 347.79
Speeding tickets per capita: 825.76
Bad Driver Index Score: 60.25
6
Oregon

Car accident fatalities per capita: 12.07
Portion of uninsured drivers: 12.7 percent
DUI arrests per capita: 369.46
Speeding tickets per capita: 1,112.35
Bad Driver Index Score: 69.24
5
New Mexico
Car accident fatalities per capita: 18.66
Portion of uninsured drivers: 20.8 percent
DUI arrests per capita: 459.67
Speeding tickets per capita: 361.28
Bad Driver Index Score: 71.31
4
South Dakota
Car accident fatalities per capita: 14.74
Portion of uninsured drivers: 7.7 percent
DUI arrests per capita: 721.93
Speeding tickets per capita: 811.35
Bad Driver Index Score: 75.54
3
South Carolina
Car accident fatalities per capita: 20.40
Portion of uninsured drivers: 9.4 percent
DUI arrests per capita: 344.48
Speeding tickets per capita: 1,105.68
Bad Driver Index Score: 78.07
2
Wyoming
Car accident fatalities per capita: 19.21
Portion of uninsured drivers: 7.8 percent
DUI arrests per capita: 676.1
Speeding tickets per capita: 1,037.55
Bad Driver Index Score: 90.04
1
Mississippi
Car accident fatalities per capita: 22.23
Portion of uninsured drivers: 23.7 percent
DUI arrests per capita: 462.21
Speeding tickets per capita: 817.44
Bad Driver Index Score: 100.00
And for the place that’s greenest with envy, This Is the Most Jealous State in America.