The 25 U.S. Cities with the Best Drinking Water

Tap water gets a bum rap. Sure, there are some places where maintenance and government failure or negligence has made drinking water dangerous (see: Flint, Michigan), but the tap water in most cities is perfectly fine. In fact, with exacting quality control and state-of-the-art filtration systems, you’ll find that it’s just as good as the stuff you’d normally get in a plastic bottle.
That’s especially the case with the water in these 25 locales. That’s right: we’ve dug into the data and ranked the 25 cities in America (out of the 200 biggest) with the cleanest drinking water. So read on, and stay hydrated! And for a list containing the flip-side, here are the 25 cities in America where you might want to consider drinking bottled water, after all.
Our Methodology: Our data includes areas with the lowest “pollution potential,” provided by the Environmental Protection Agency; the lowest number of contaminants in the local water, according to the Environmental Working Group; and the annual American Water Works Association’s “Best of the Best” drinking water taste tests (determined by water experts and industry leaders). Note: A city doesn’t have to source its water from a natural spring or pristine river to have great drinking water, but it does have to have to taste good and have low levels of contaminants.
25
Macon, GA

Best of the Best Wins in Last Five Years: 1
Number of Contaminants: 7
Other Detected Contaminants: 10
EPA Rank of Number of Manufacturing Establishments/Sq. Mile: 19
EPA Rank of the Total Farm Ag. Chemical Expenses: 19
Clean Water Score: 85.62
24
Pembroke Pines, FL
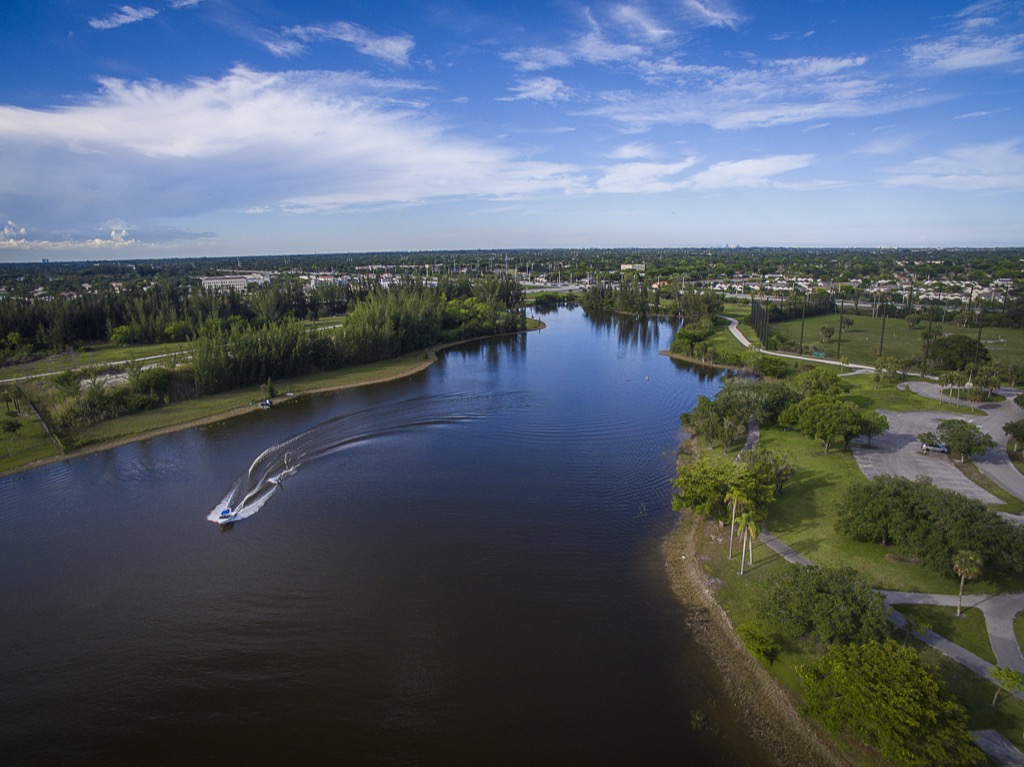
Best of the Best Wins in Last Five Years: 0
Number of Contaminants: 3
Other Detected Contaminants: 8
EPA Rank of Number of Manufacturing Establishments/Sq. Mile: 12
EPA Rank of the Total Farm Ag. Chemical Expenses: 4
Clean Water Score: 85.84
23
Salem, OR

Number of Contaminants: 3
Other Detected Contaminants: 7
EPA Rank of Number of Manufacturing Establishments/Sq. Mile: 34
EPA Rank of the Total Farm Ag. Chemical Expenses: 22
Clean Water Score: 86.44
22
Memphis, TN

Number of Contaminants: 2
Other Detected Contaminants: 9
EPA Rank of Number of Manufacturing Establishments/Sq. Mile: 18
EPA Rank of the Total Farm Ag. Chemical Expenses: 24
Clean Water Score: 86.58
21
Philadelphia, PA

Best of the Best Wins in Last Five Years: 1
Number of Contaminants: 7
Other Detected Contaminants: 9
EPA Rank of Number of Manufacturing Establishments/Sq. Mile: 8
EPA Rank of the Total Farm Ag. Chemical Expenses: 29
Clean Water Score: 86.63
20
Cape Coral, FL
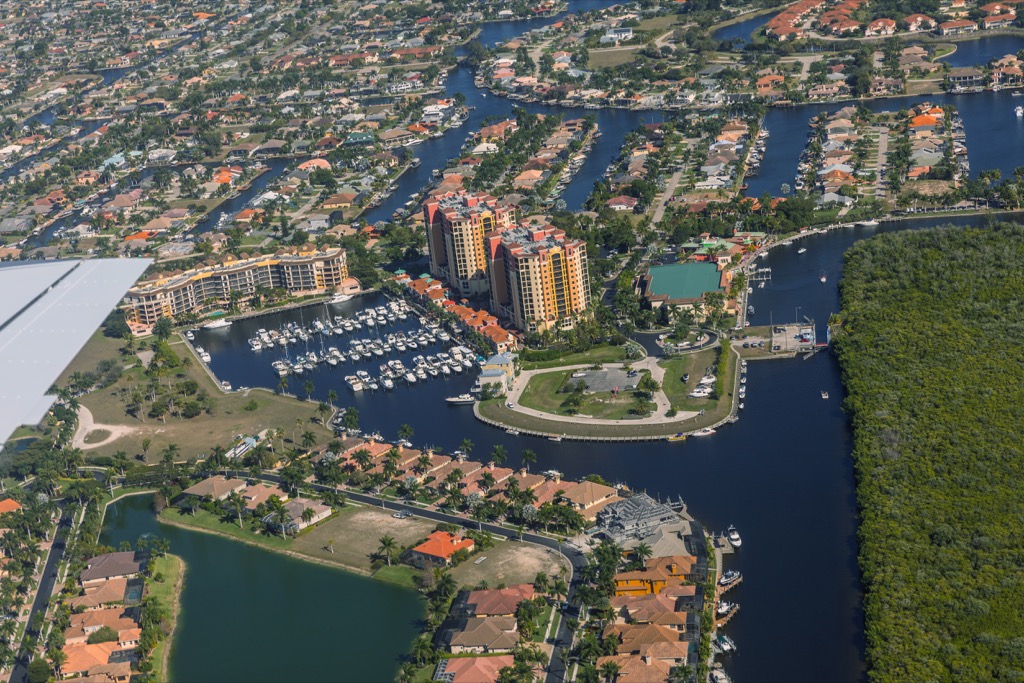
Number of Contaminants: 5
Other Detected Contaminants: 3
EPA Rank of Number of Manufacturing Establishments/Sq. Mile: 12
EPA Rank of the Total Farm Ag. Chemical Expenses: 4
Clean Water Score: 86.84
19
Oakland, CA

Number of Contaminants: 2
Other Detected Contaminants: 9
EPA Rank of Number of Manufacturing Establishments/Sq. Mile: 11
EPA Rank of the Total Farm Ag. Chemical Expenses: 1
Clean Water Score: 86.88
18
Boisie, ID

Best of the Best Wins in Last Five Years: 1
Number of Contaminants: 5
Other Detected Contaminants: 12
EPA Rank of Number of Manufacturing Establishments/Sq. Mile: 43
EPA Rank of the Total Farm Ag. Chemical Expenses: 23
Clean Water Score: 87.34
17
Olathe, KS

Best of the Best Wins in Last Five Years: 1
Number of Contaminants: 5
Other Detected Contaminants: 12
EPA Rank of Number of Manufacturing Establishments/Sq. Mile: 39
EPA Rank of the Total Farm Ag. Chemical Expenses: 16
Clean Water Score: 87.45
16
New Orleans, LA
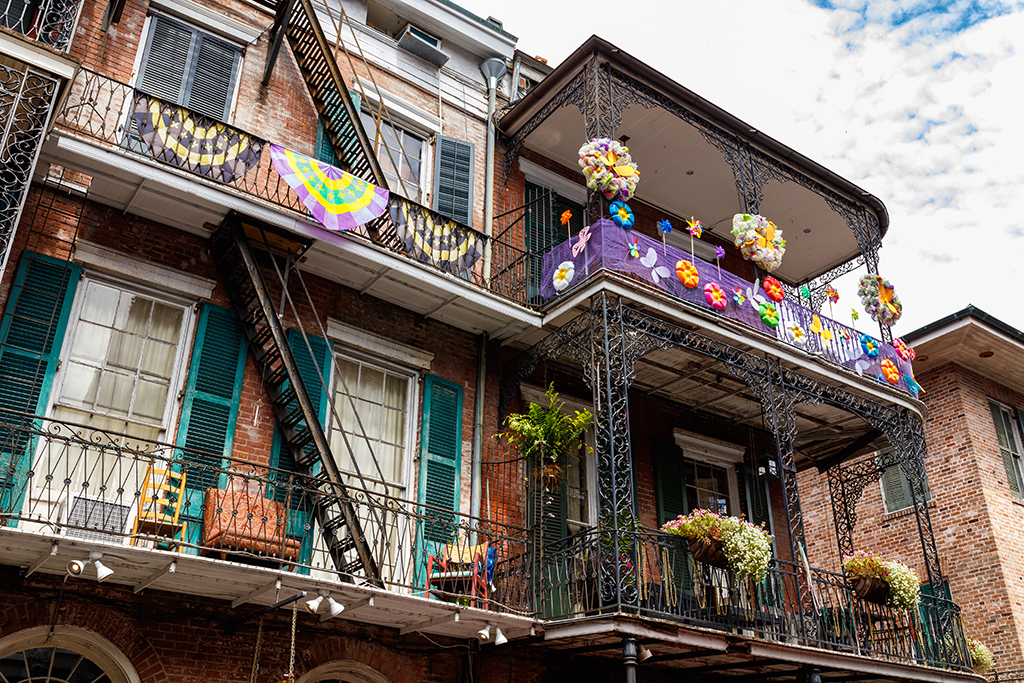
Number of Contaminants: 3
Other Detected Contaminants: 6
EPA Rank of Number of Manufacturing Establishments/Sq. Mile: 29
EPA Rank of the Total Farm Ag. Chemical Expenses: 13
Clean Water Score: 87.58
15
Augusta, GA
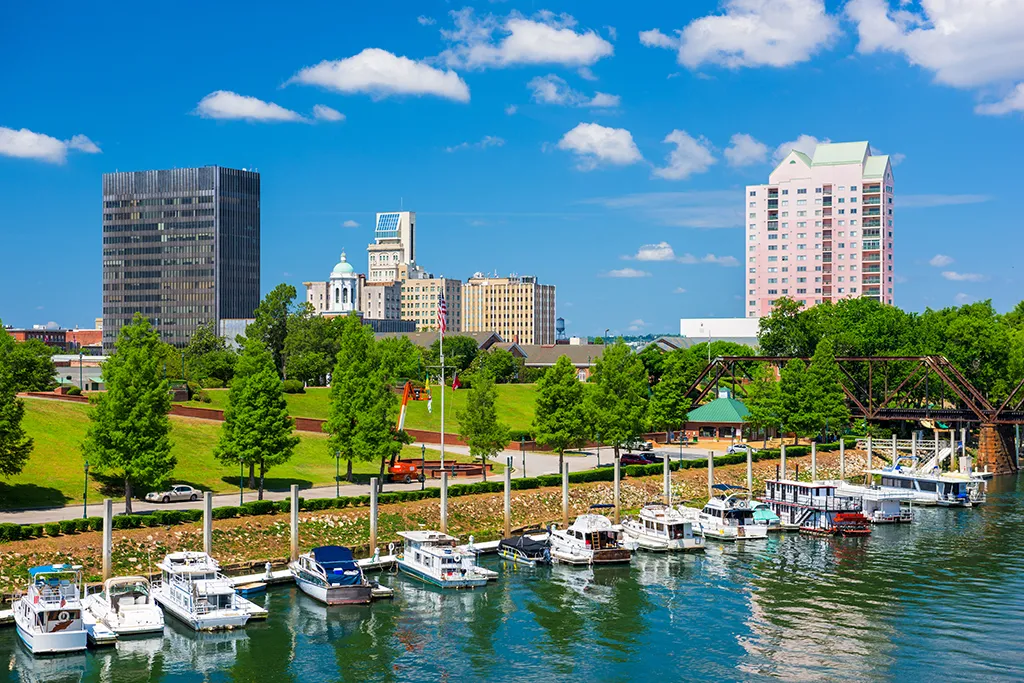
Best of the Best Wins in Last Five Years: 1
Number of Contaminants: 7
Other Detected Contaminants: 8
EPA Rank of Number of Manufacturing Establishments/Sq. Mile: 19
EPA Rank of the Total Farm Ag. Chemical Expenses: 19
Clean Water Score: 87.62
14
Orlando, FL

Number of Contaminants: 3
Other Detected Contaminants: 6
EPA Rank of Number of Manufacturing Establishments /Sq. Mile: 12
EPA Rank of the Total Farm Ag. Chemical Expenses: 4
Clean Water Score: 87.84
13
Hayward, CA

Number of Contaminants: 3
Other Detected Contaminants: 5
EPA Rank of Number of Manufacturing Establishments /Sq. Mile: 11
EPA Rank of the Total Farm Ag. Chemical Expenses: 1
Clean Water Score: 89
12
Joliet, IL
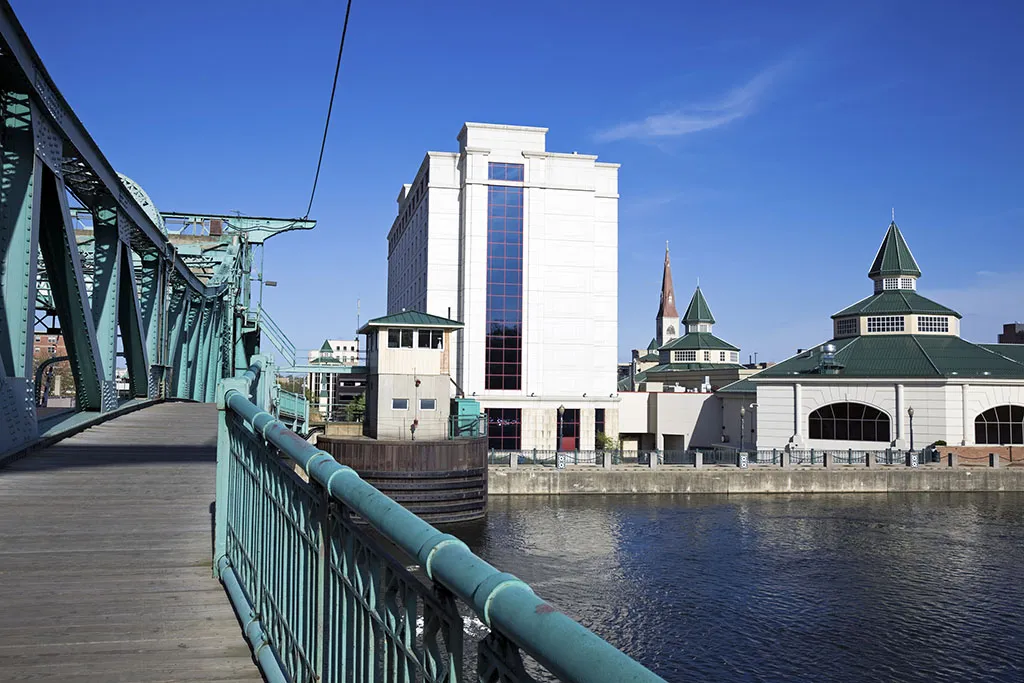
Number of Contaminants: 2
Other Detected Contaminants: 7
EPA Rank of Number of Manufacturing Establishments /Sq. Mile: 10
EPA Rank of the Total Farm Ag. Chemical Expenses: 2
Clean Water Score: 89
11
Aurora, CO

Best of the Best Wins in Last Five Years: 1
Number of Contaminants: 4
Other Detected Contaminants: 11
EPA Rank of Number of Manufacturing Establishments /Sq. Mile: 38
EPA Rank of the Total Farm Ag. Chemical Expenses: 31
Clean Water Score: 90.31
10
Baltimore, MD

Best of the Best Wins in Last Five Years: 1
Number of Contaminants: 3
Other Detected Contaminants: 13
EPA Rank of Number of Manufacturing Establishments /Sq. Mile: 7
EPA Rank of the Total Farm Ag. Chemical Expenses: 35
Clean Water Score: 90.58
9
Warren, MI

Number of Contaminants: 3
Other Detected Contaminants: 3
EPA Rank of Number of Manufacturing Establishments /Sq. Mile: 13
EPA Rank of the Total Farm Ag. Chemical Expenses: 18
Clean Water Score: 90.69
8
Cincinnati, OH

Number of Contaminants: 2
Other Detected Contaminants: 5
EPA Rank of Number of Manufacturing Establishments /Sq. Mile: 6
EPA Rank of the Total Farm Ag. Chemical Expenses: 11
Clean Water Score: 90.83
7
Miami, FL
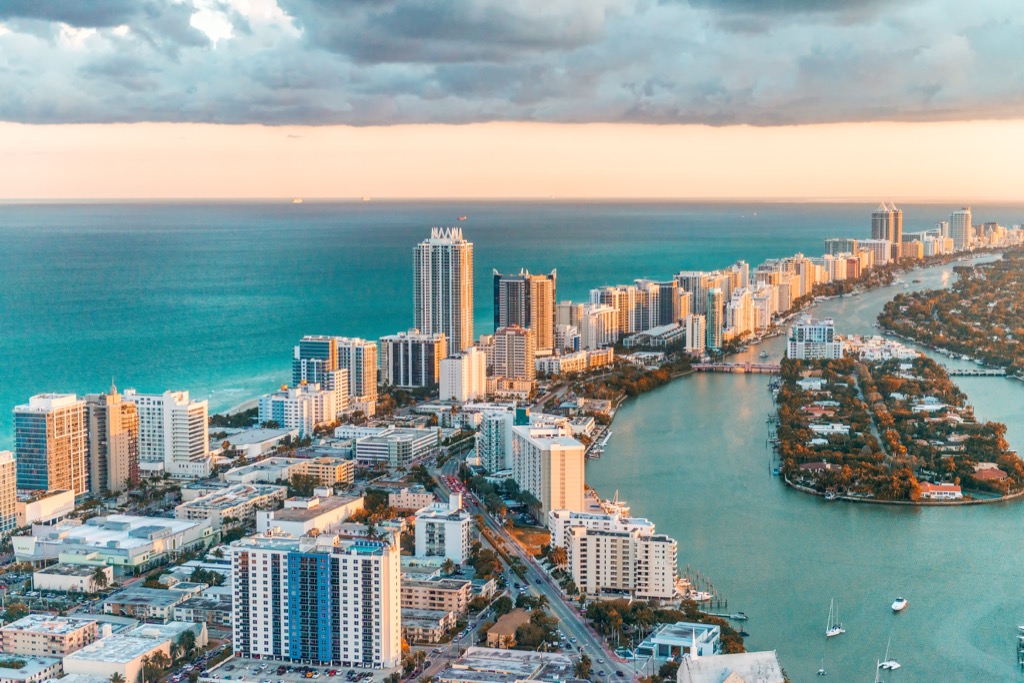
Best of the Best Wins in Last Five Years: 1
Number of Contaminants: 4
Other Detected Contaminants: 11
EPA Rank of Number of Manufacturing Establishments /Sq. Mile: 12
EPA Rank of the Total Farm Ag. Chemical Expenses: 4
Clean Water Score: 90.84
6
Port St. Lucie, FL

Best of the Best Wins in Last Five Years: 0
Number of Contaminants: 2
Other Detected Contaminants: 4
EPA Rank of Number of Manufacturing Establishments /Sq. Mile: 12
EPA Rank of the Total Farm Ag. Chemical Expenses: 4
Clean Water Score: 92
5
Savannah, GA

Best of the Best Wins in Last Five Years: 1
Number of Contaminants: 5
Other Detected Contaminants: 7
EPA Rank of Number of Manufacturing Establishments /Sq. Mile: 19
EPA Rank of the Total Farm Ag. Chemical Expenses: 19
Clean Water Score: 93
4
Charleston, SC
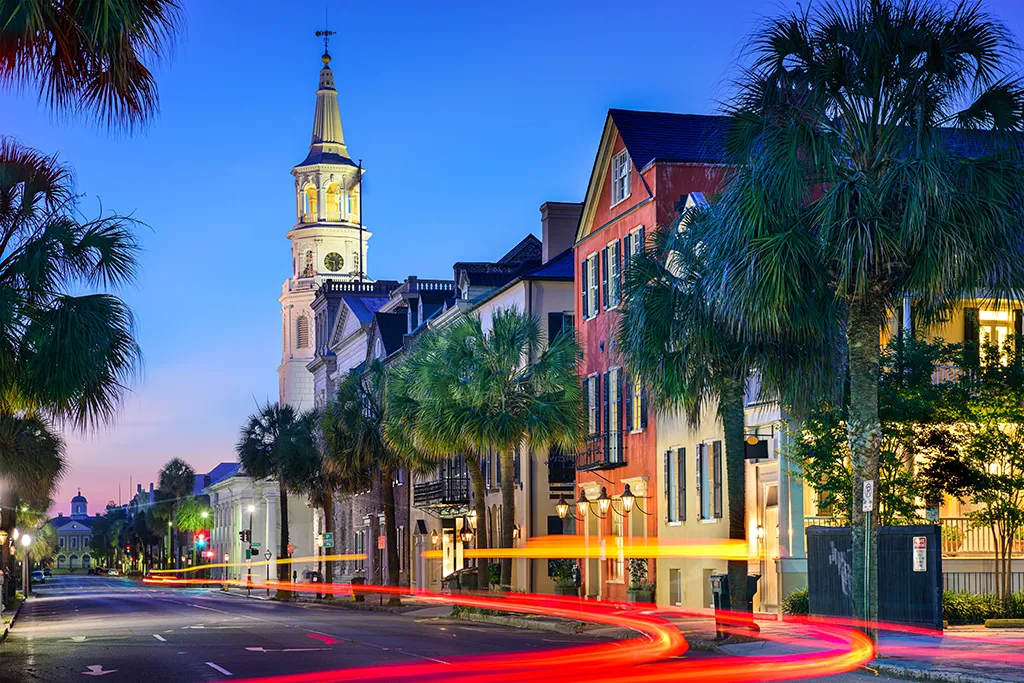
Best of the Best Wins in Last Five Years: 2
Number of Contaminants: 7
Other Detected Contaminants: 10
EPA Rank of Number of Manufacturing Establishments /Sq. Mile: 21
EPA Rank of the Total Farm Ag. Chemical Expenses: 32
Clean Water Score: 96
3
Louisville, KY

Best of the Best Wins in Last Five Years: 2
Number of Contaminants: 6
Other Detected Contaminants: 10
EPA Rank of Number of Manufacturing Establishments /Sq. Mile: 27
EPA Rank of the Total Farm Ag. Chemical Expenses: 27
Clean Water Score: 98
2
Tallahassee, FL

Best of the Best Wins in Last Five Years: 2
Number of Contaminants: 4
Other Detected Contaminants: 9
EPA Rank of Number of Manufacturing Establishments /Sq. Mile: 12
EPA Rank of the Total Farm Ag. Chemical Expenses: 4
Clean Water Score: 103
1
Sioux Falls, SD
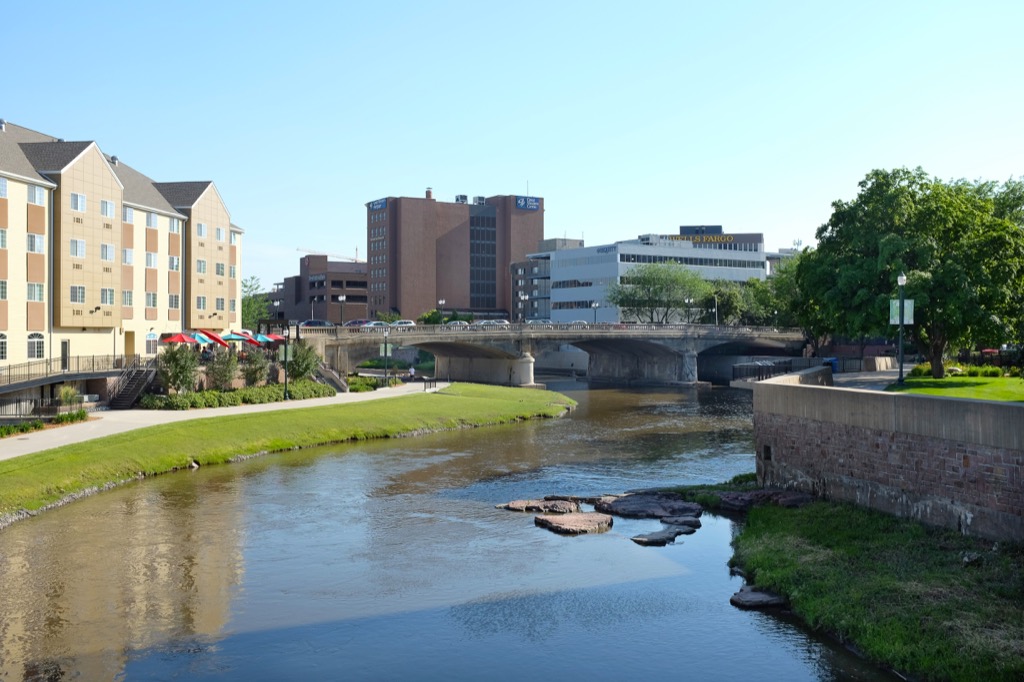
Best of the Best Wins in Last Five Years: 2
Number of Contaminants: 2
Other Detected Contaminants: 6
EPA Rank of Number of Manufacturing Establishments /Sq. Mile: 45
EPA Rank of the Total Farm Ag. Chemical Expenses: 21
Clean Water Score: 110
For more advice on living your best life, follow us on Facebook and sign up for our newsletter now!