20 Effects of Divorce That People Don't Talk About, According to Experts
Therapists and divorce lawyers share what it's really like when a marriage dissolves.

When you hear the word "divorce," there are a handful of images that probably come to mind—two adults arguing, a sad child stuck in the middle, and maybe even a contentious courtroom battle. But when a marriage ends, it's far more complex than that. For one, you may never even be in a courtroom with your ex, and secondly, there are some truly positive effects of a divorce that you may not have seen coming. To understand the full spectrum of outcomes, we spoke to therapists, couples counselors, and divorce lawyers to find out what really goes on when a marriage dissolves. Read on for 20 effects of divorce that people don't talk about.
READ THIS NEXT: 7 Things Divorced People Wish They Had Done Differently in Their Marriage.
1
It can be a big relief.

Divorce is a major disruptor in one's life and can bring tons of stress—financial, emotional, and even spiritual. But many people who come out the other end of the process also describe feeling an incredible sense of relief.
"I was terrified that getting a divorce would be devastating," says Sonia M. Frontera, a divorce attorney and author of Divorce Dilemma. "Yet, once I empowered myself to leave my husband, I found much more joy and freedom in being alone. The divorce process and rebuilding my life took over all the fears that stopped me from leaving sooner, and I am grateful for the experience."
Likewise, Charles MacCall, chief operations officer for Rosen Law Firm, which specializes in divorce cases, says his clients are often taken aback at how freeing it is to make decisions on their own. "There is no debate, there is no negotiation; they alone get to decide. And it isn't just the little personal preference parts either—financially, many of my clients feel both a sense of fear and a sense of excitement when they realize that making decisions over large purchases and investment strategies are theirs alone."
2
Your relationship with your ex might improve.

Many divorced couples often describe getting to a better place with their former spouse than when they were married.
"After some time—and we could be talking years—if you begin to co-parent correctly, you'll be surprised to learn that you can be grateful for your ex as a friend and happy for his/her achievements and relationships outside of your own," says Carmel Jones, who writes about sex and relationships for The Big Fling. "This desire for them to be happy might mean your friendship is stronger than it was when you were actually together romantically."
3
But it takes time before you can be friends.

While you can get to a place of civility and even warmth with your ex, you will nonetheless want to proceed with caution before attempting to get chummy with the one who was once the most important person in your life. Trying to shift to "friend mode" too quickly can often backfire.
"Being friends with your ex usually doesn't work out soon after divorce," says Terry Gaspard, MSW, LICSW, author of The Remarriage Manual. "Most of the time, a post-breakup friendship is a setup for further heartbreak, especially for the person who was left and probably feels rejected."
4
It's a grieving process.

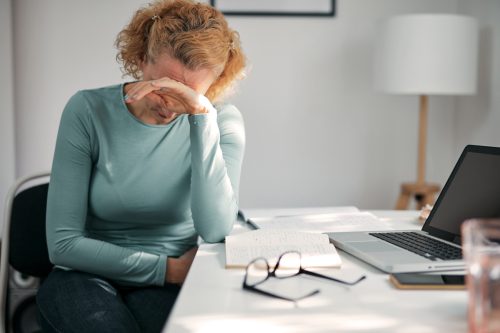
Reality TV and sensational tabloids may give the impression that a divorce is a time of high drama and intense emotions. But in reality, divorce feels less like the latest twist in a soap opera and more like a death.
"There are so many losses inherent in a divorce, and you need to allow yourself time and space to grieve for all those losses," says Susan Trotter, PhD, relationship coach and leader of coaching at Vesta. "The grief process, though, is not linear. Understanding that will help to normalize your emotions and can motivate you to get the support you need."
She urges anyone going through divorce to seek the professional help they need and to pay attention to the people they surround themselves with. "Find people who are positive and have good energy, and that will help you to stay focused… Mindset is critical in the divorce process."
5
But it's also a business transaction.

But just as it's an emotionally fraught time of grieving, divorce is above all a business transaction. And what surprises many newly divorced people is just how much paperwork (and money) is involved in the process. Keeping one's attention on these mundane aspects of the split can often be the healthiest approach to getting through it.
"Learning how to take the emotions out of the settlement process, and instead focus on the division of assets as a 'business transaction' will help you to make better decisions in that regard for you and your family," suggests Trotter. "It will also help you decide what is worth fighting for and what is not."
READ THIS NEXT: 5 Signs Your Relationship Is Headed for a "Gray Divorce," Therapists Say.
6
You may never be in the same room with your ex during the divorce proceedings.

Something that surprises many individuals is how rarely they see their ex-partner as the divorce proceedings unfold.
"Many times your case isn't settled in a courtroom even if you've hired an attorney," explains MacCall. "You may come to the terms of your settlement on a FaceTime call with your attorney while you are rushing between work meetings across the country, or you may figure out who gets the pots and pans while sitting in different rooms at a mediation."
MacCall says that if you do have a mediator, they are the only ones who will see both of you, going from room to room to reach a settlement.
7
"Moving on" is much harder than it sounds.

It's far tougher to extricate yourself from the person to whom you've been married than you might have expected.
"It takes forever to untangle yourself from your spouse—tax documents, car registrations, changing your name," says Jones. "Going through the documents when getting a divorce to put everything you have into your name is going to take a very long time, and you will need to communicate with your spouse often."
8
You may feel sorry for your spouse.

Even in the case of a bitter divorce, those warm feelings you used to have for your ex don't just disappear, particularly since they're going through many of the same difficulties as you.
"Even though my husband was vicious to me, once I decided to leave, he turned to mush," says Frontera. "Although I wasn't going to change my mind, I did feel sorry for him and behaved with compassion throughout the divorce process and beyond."
9
You'll lose some friendships.

You expect to lose one of the most important (if not the most important) relationships in your life during a split. But there's a good chance there will be additional collateral damage as your marriage dissolves.
Many of those who go through a divorce describe how mutual friends are often lost in the process. And it might not be a matter of a friend choosing one member of a couple over another so much as the change in dynamics. If you usually went on double dates, for example, the split can throw off the balance.
"While most people were supportive and were happy to see me end my marriage, some people distanced themselves from me and kept me away from their husbands," says Frontera. "You will become a threat to insecure friends and may need to let them go."
10
But other friendships may grow.

But just as you lose some friendships, you very well might find that you have more time to reconnect with friends and family who you may have lost touch with, says relationship therapist Layla Ashley. This could be especially true for friends who are also single.
For more relationship advice delivered straight to your inbox, sign up for our daily newsletter.
11
You will have more time for self-care.

It turns out, being married is very time-consuming. Even divorced people with children find they have more time on their own as the children split their days and weekends between their parents.
"Many seem to think a divorce means more work in terms of childcare, but in a joint custody situation, you will actually have more time for self-care," says MacCall, adding that this sets a healthy example for your kids.
Ashley describes how that newfound "me" time can lead a divorced person to feel a stronger sense of their own identity, separate from the relationship that was once central to their life. "Married partnerships usually involve merging your practical lives, such as sharing a home and day-to-day activities and decisions. After divorce, the tendency to get 'lost' in another person is now replaced with a newfound freedom to explore and discover your individual self."
12
You'll become a better parent.

"For the first few months, you are going to feel extremely lonely for your children and your family life if you have split custody," says Jones. "It might even make you question whether or not you made the right decision." But eventually, you're likely to find that this arrangement makes you a better parent.
"One of the effects of kids having two separate homes and spending time with each parent, is that you spend more individual time with your child than ever, and your bond can grow much stronger," explains Ashley.
MacCall says the situation can also be practical. "Because you will likely now have a joint custody schedule, you will have time to work late and run errands when your ex has the kids. This means that you will be able to dedicate 100 percent of your attention when it is your time with the kids."
13
Your ex may become a more involved parent.

If during your marriage, you were the more involved parent, this could change for the better post-divorce. As MacCall notes, no one wants to be labeled the "absentee" parent, so your ex may go out of their way to get more active in your child's life. "The good news is, these new habits tend to stick. Your ex will realize how much they have missed out on, and how neat hanging out with their kid can be."
14
You'll need to buy your kids a new set of essentials.

Moving between two houses means going out and getting a whole new set of everything your kids need—whether that's sheets, toys, or pajamas.
"If you get divorced and split custody of your children, you will realize that moving them between houses means that things get lost, damaged, or simply cease to exist," says Jones. "For example, your children will need lunchboxes for each home, toothbrushes, and even sports equipment at times. It will normalize the separation for them while also saving you tons of time dealing with forgotten cleats before soccer practice or a missing pair of glasses."
15
Co-parenting can be exhausting.

Shifting to a co-parenting approach can be a very trying experience. "Put simply, the challenges change as children grow and develop, but it's not easy to have a cooperative relationship with an ex-spouse over many years," says Gaspard.
As a couple, you could divide up duties a bit more easily, so once the divorce has taken effect, each member of the former couple is largely on their own.
READ THIS NEXT: 5 Signs Your Marriage Is Divorce-Proof, According to Therapists.
16
It can be dangerous to jump right back into dating.

The old adage that when you fall off a horse, the best thing to do is jump right back on does not hold true when it comes to post-divorce dating. For one thing, moving too quickly into a new relationship can be a means of avoiding dealing with the issues that led to the marriage's dissolution in the first place.
"The divorce rate goes up for second, third, and fourth marriages, in part because people are repeating patterns that they don't recognize," says Trotter. "It takes time to process everything, and even though you may feel ready to date, you will have more success in future dating and relationships if you take the time to process the divorce [and] learn from your past relationships—what worked and what didn't, what your role was in the dynamic, and what you want and need now, which is likely very different from what you wanted and needed when you got married."
17
You may repeat the same patterns with a new partner.

Many people who go through a divorce expect it to be the turning over of a new leaf and are surprised to find a similar dynamic surfacing with a new partner.
"Divorce is often pursued with the intent of getting rid of major relationship problems, which tend to be tied to core patterns," says Ashley. "So it can be quite surprising when, after the honeymoon phase of the next relationship, you circle back around to the same dynamic with the new partner."
Again, this is why it's important to process and heal before you start dating.
18
Family and friends become more important than material things.

After a divorce, "stuff" usually turns out to be less important than it was when married. That's partly because recently divorced people usually have to move to a smaller place or give up some (or many) of the things they valued during their marriage. It's also the result of gaining clarity about what matters most in life.
"In going through all of your things, dividing them up during the divorce, and scaling down, you'll have a newfound appreciation for the time you spend with the people you love, and less focus on materialistic items," says Jones.
19
Your health takes a hit.
A 2010 study published in the Journal of Marriage and Family found that both middle-aged men and women are at a higher risk of developing cardiovascular disease after going through a divorce, compared with married people of the same age.
But most of the physical ailments associated with divorce are rooted in your mental health—not because you feel sad that things didn't work out with your ex, but because it tends to ratchet up your anxiety levels.
"You don't have a companion in the big, bad world anymore, and the future that you once pictured no longer exists," explains Fran Walfish, PsyD, a Beverly Hills-based family and relationship psychotherapist and author of The Self-Aware Parent. "Plus, there's a ton of uncertainty, which can lead to feeling insecure. Depending on the circumstances, you might suddenly have to move, get a new job, and survive on less money than before."
20
You learn to forgive yourself.

Guilt, self-doubt, and a general sense of harshness toward yourself are often byproducts of a divorce. But just as often, these unpleasant feelings give way to a much healthier understanding of oneself and forgiveness about what you feel you did wrong in the marriage.
"The dumper, or person who leaves or ends the relationship, may experience feelings of guilt," says Gaspard. "[But] an important part of divorce recovery is forgiving yourself."
Additional reporting by Grant Stoddard.