The 50 Cities with the Worst Singles Scenes in America
Our most barren dating deserts, from coast-to-coast.

If your dating life isn't as fulfilling as you'd like it to be, good news: It might not be you. The reason for a bleak dating experience might actually be because you're living in the wrong city. Lame bars and restaurants (or no bars and restaurants), few available single people, and/or crummy entertainment options can make it tough to hit it off with potential dates in your town. To help you figure out which cities to avoid when looking to supercharge your romantic life, we've pulled together the data of which places have the most dismal singles scenes.
We didn't take into account every city or tiny collective of people in the country—we just looked at the 200 biggest metropolises, by population, and figured out from those (using info from the U.S. Census, Bureau of Labor, and other sources) which were the dating deserts. Take a look and see if it's time to plan a move. And when you start thinking about where to go, check out the 50 Cities with the Best Singles Scenes in America.
50
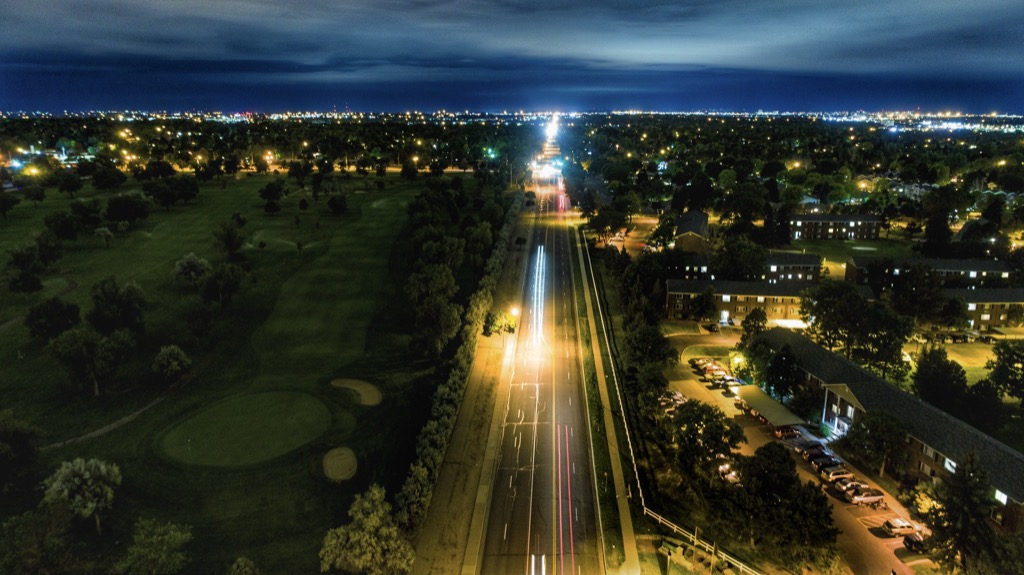
Rancho Cucamonga, CA
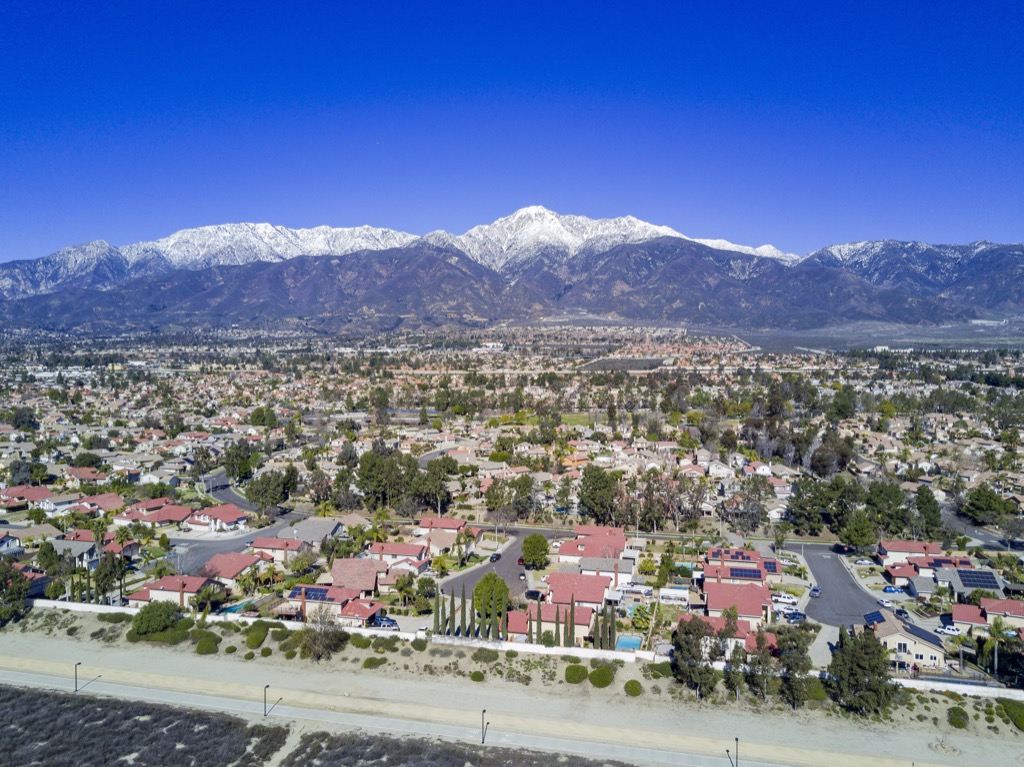
Population: 176,534
Singles (%): 51
Number of bars per 100k people: 4.53
Number of restaurants per 100k people: 60.05
Number of entertainment spots per 100k people: 19.83
Singles Scene Score: 33.85
Also one of The 50 Fittest Cities in America, maybe Rancho Cucamonga isn't so bad after all.
49
Corona, CA
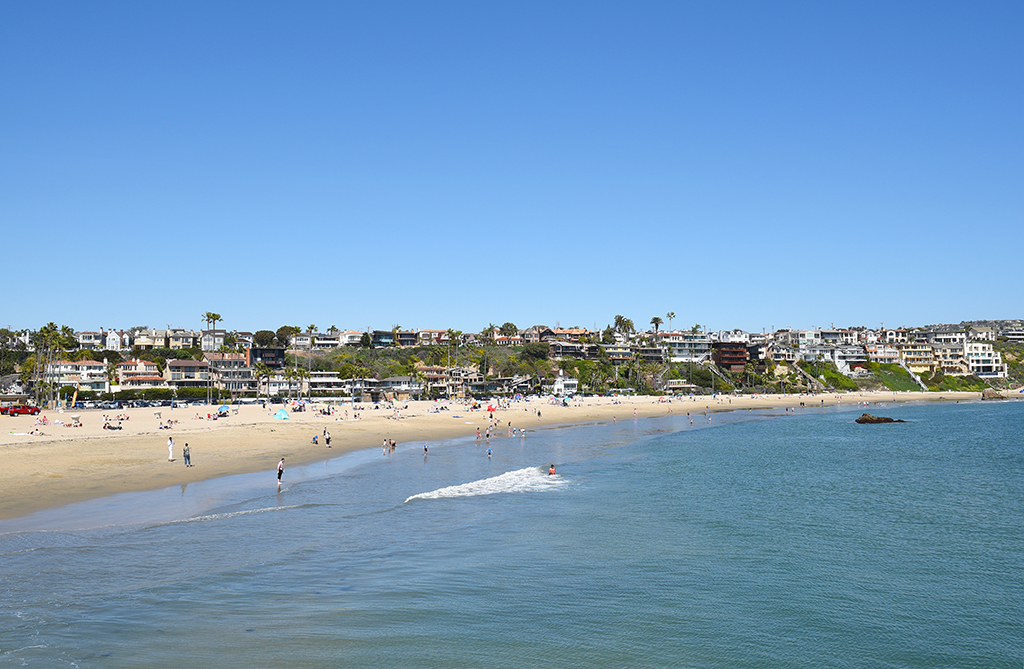
Population: 166,785
Singles (%): 48.3
Number of bars per 100k people: 3.60
Number of restaurants per 100k people: 65.35
Number of entertainment spots per 100k people: 17.99
Singles Scene Score: 33.81
48
Olathe, KS

Population: 135,473
Singles (%): 41.4
Number of bars per 100k people: 4.43
Number of restaurants per 100k people: 59.05
Number of entertainment spots per 100k people: 29.53
Singles Scene Score: 33.60
If you do meet someone, here are the 15 signs your partner is marriage material.
47
Fremont, CA
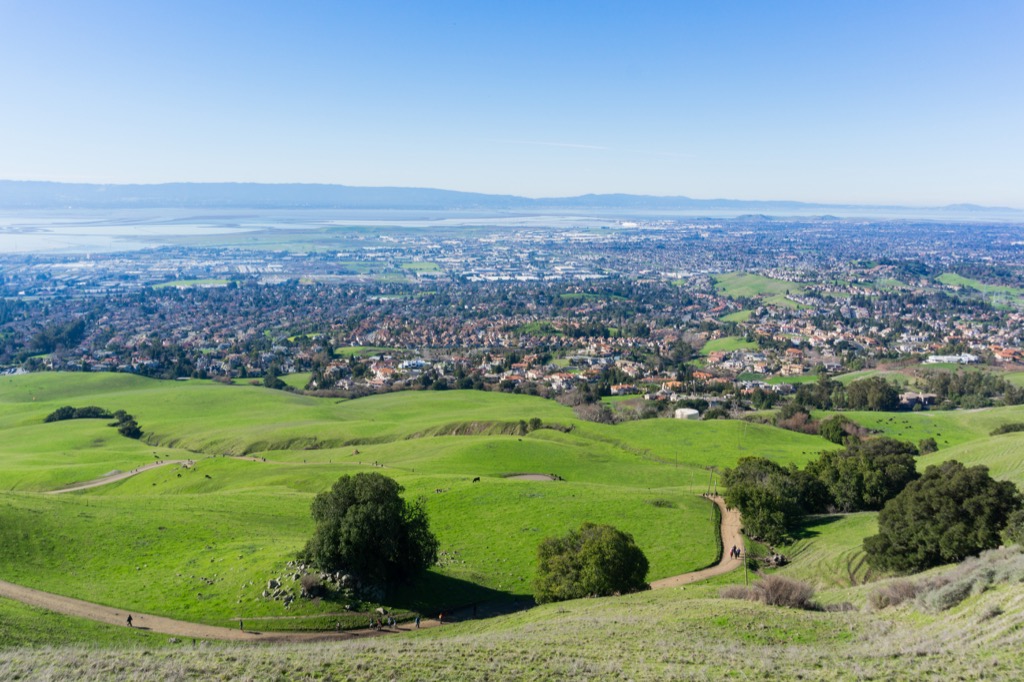
Population: 233,136
Singles (%): 52.2
Number of bars per 100k people: 2.57
Number of restaurants per 100k people: 60.91
Number of entertainment spots per 100k people: 17.59
Singles Scene Score: 33.32
46
Clarksville, TN

Population: 150,287
Singles (%): 48.1
Number of bars per 100k people: 13.97
Number of restaurants per 100k people: 58.55
Number of entertainment spots per 100k people: 11.98
Singles Scene Score: 33.15
And speaking of geography: don't miss The Greatest BBQ Joint in Every U.S. State.
45
Escondido, CA

Population: 151,613
Singles (%): 52.8
Number of bars per 100k people: 5.28
Number of restaurants per 100k people: 54.74
Number of entertainment spots per 100k people: 18.47
Singles Scene Score: 32.82
44
Bakersfield, CA

Population: 376,380
Singles (%): 52.9
Number of bars per 100k people: 6.91
Number of restaurants per 100k people: 51.01
Number of entertainment spots per 100k people: 20.19
Singles Scene Score: 32.75
43
Macon, GA

Population: 152,555
Singles (%): 58
Number of bars per 100k people: 5.24
Number of restaurants per 100k people: 52.44
Number of entertainment spots per 100k people: 14.42
Singles Scene Score: 32.53
Photo via Wikimedia Commons
42
Riverside, CA
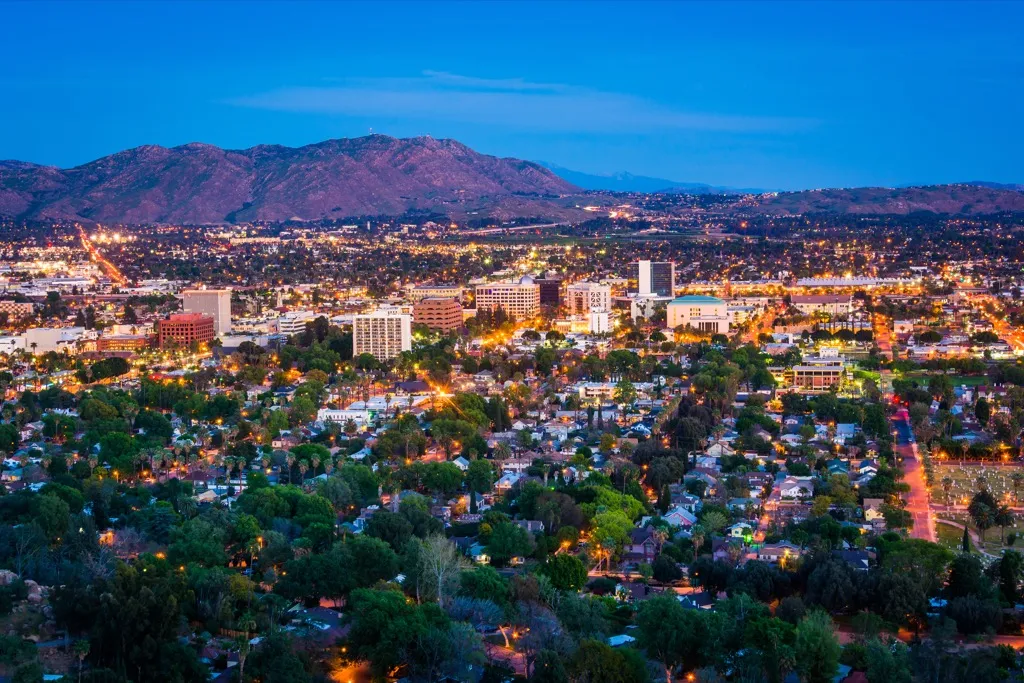
Population: 324,722
Singles (%): 57.7
Number of bars per 100k people: 5.24
Number of restaurants per 100k people: 47.43
Number of entertainment spots per 100k people: 19.40
Singles Scene Score: 32.44
41
Arlington, TX

Population: 392,772
Singles (%): 53.7
Number of bars per 100k people: 7.89
Number of restaurants per 100k people: 47.61
Number of entertainment spots per 100k people: 20.11
Singles Scene Score: 32.33
40
Irving, TX
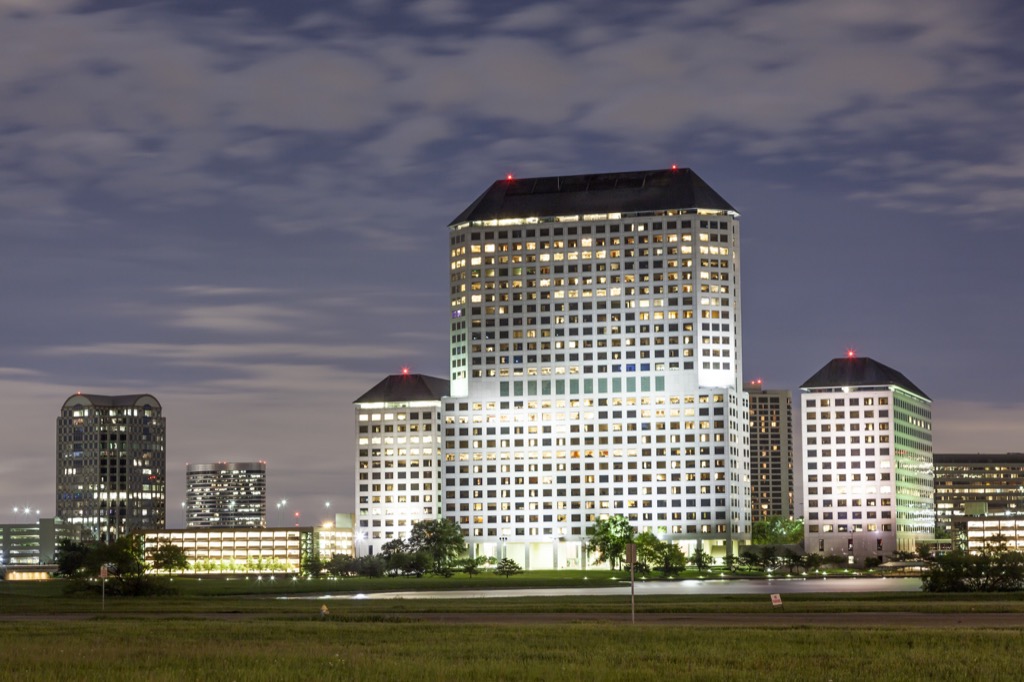
Population: 238,289
Singles (%): 50.4
Number of bars per 100k people: 0.42
Number of restaurants per 100k people: 57.49
Number of entertainment spots per 100k people: 20.98
Singles Scene Score: 32.32
39
Oceanside, CA
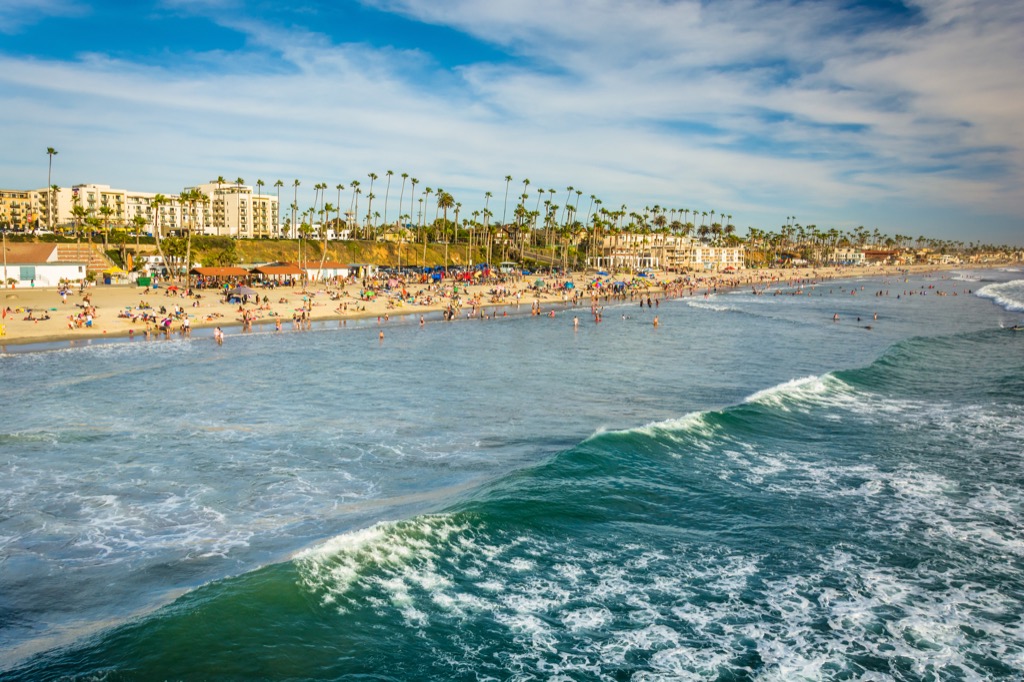
Population: 175,464
Singles (%): 50.6
Number of bars per 100k people: 6.84
Number of restaurants per 100k people: 49.58
Number of entertainment spots per 100k people: 22.23
Singles Scene Score: 32.31
38
Brownsville, TX

Population: 183,823
Singles (%): 51.1
Number of bars per 100k people: 8.16
Number of restaurants per 100k people: 52.77
Number of entertainment spots per 100k people: 16.86
Singles Scene Score: 32.22
Photo via the Brownsville Facebook page
37
Mesa, AZ

Population: 484,587
Singles (%): 52.7
Number of bars per 100k people: 3.71
Number of restaurants per 100k people: 54.27
Number of entertainment spots per 100k people: 17.95
Singles Scene Score: 32.16
36
Salinas, CA
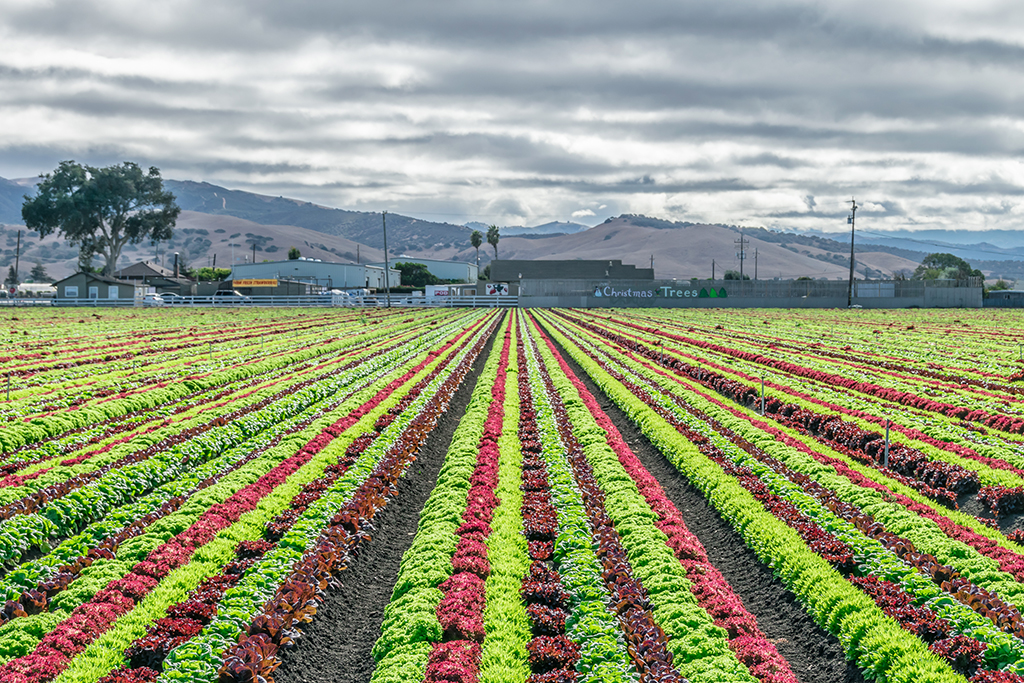
Population: 157,218
Singles (%): 56.6
Number of bars per 100k people: 2.54
Number of restaurants per 100k people: 59.79
Number of entertainment spots per 100k people: 9.54
Singles Scene Score: 32.12
35
San Bernardino, CA

Population: 216,239
Singles (%): 64.7
Number of bars per 100k people: 3.70
Number of restaurants per 100k people: 45.32
Number of entertainment spots per 100k people: 13.41
Singles Scene Score: 31.78
34
Fort Worth, TX
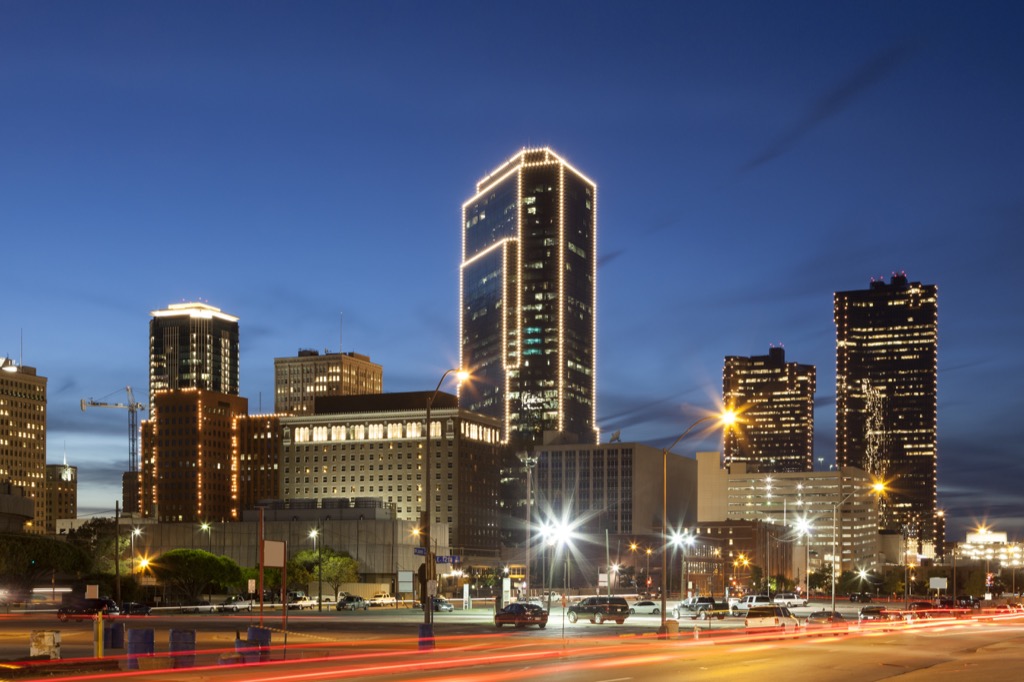
Population: 854,113
Singles (%): 53.8
Number of bars per 100k people: 12.76
Number of restaurants per 100k people: 39.34
Number of entertainment spots per 100k people: 20.72
Singles Scene Score: 31.66
33
Glendale, AZ
Population: 245,895
Singles (%): 52.9
Number of bars per 100k people: 10.98
Number of restaurants per 100k people: 44.33
Number of entertainment spots per 100k people: 17.49
Singles Scene Score: 31.42
32
Laredo, TX

Population: 257,156
Singles (%): 53.4
Number of bars per 100k people: 10.50
Number of restaurants per 100k people: 47.05
Number of entertainment spots per 100k people: 14.39
Singles Scene Score: 31.34
31
Stockton, CA

Population: 307,072
Singles (%): 57.2
Number of bars per 100k people: 5.21
Number of restaurants per 100k people: 47.87
Number of entertainment spots per 100k people: 14.65
Singles Scene Score: 31.23
30
Kansas City, KS

29
Cape Coral, FL
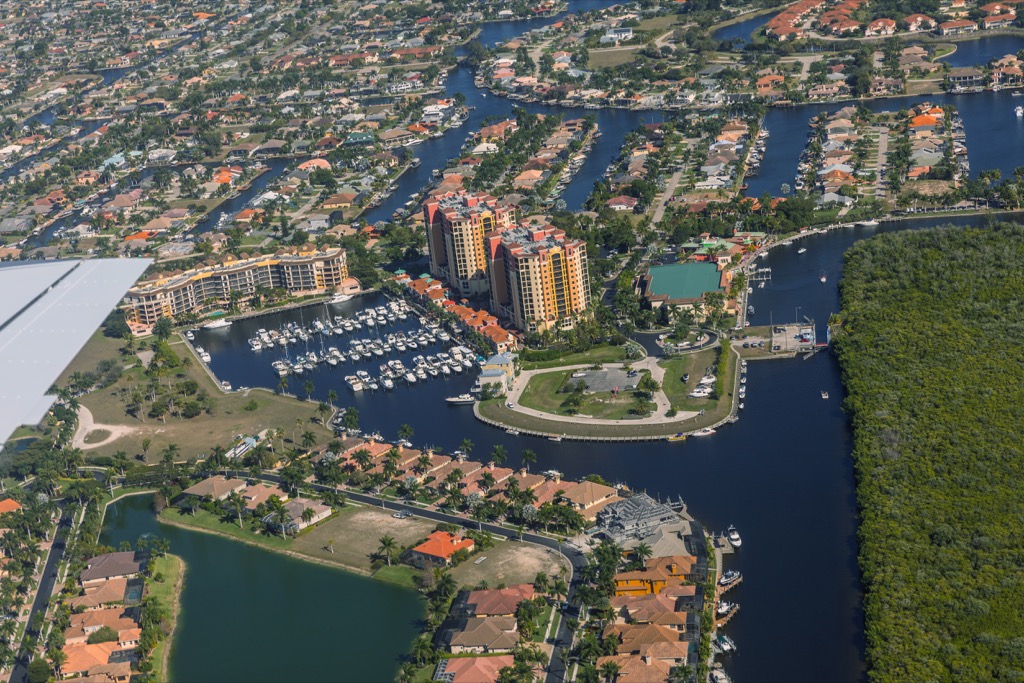
Population: 179,804
Singles (%): 48.8
Number of bars per 100k people: 5.01
Number of restaurants per 100k people: 50.05
Number of entertainment spots per 100k people: 20.58
Singles Scene Score: 31.11
28
Peoria, AZ
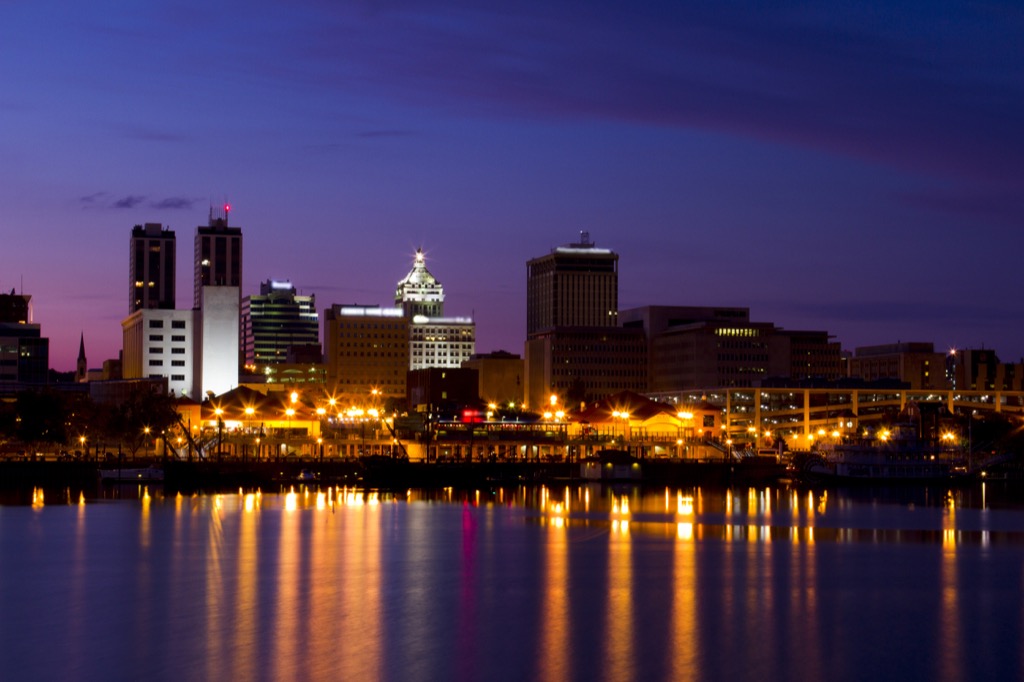
Population: 164,173
Singles (%): 48
Number of bars per 100k people: 4.26
Number of restaurants per 100k people: 49.34
Number of entertainment spots per 100k people: 21.32
Singles Scene Score: 30.73
27
Chula Vista, CA

Population: 267,172
Singles (%): 50.2
Number of bars per 100k people: 6.74
Number of restaurants per 100k people: 47.91
Number of entertainment spots per 100k people: 16.09
Singles Scene Score: 30.24
26
Joliet, IL
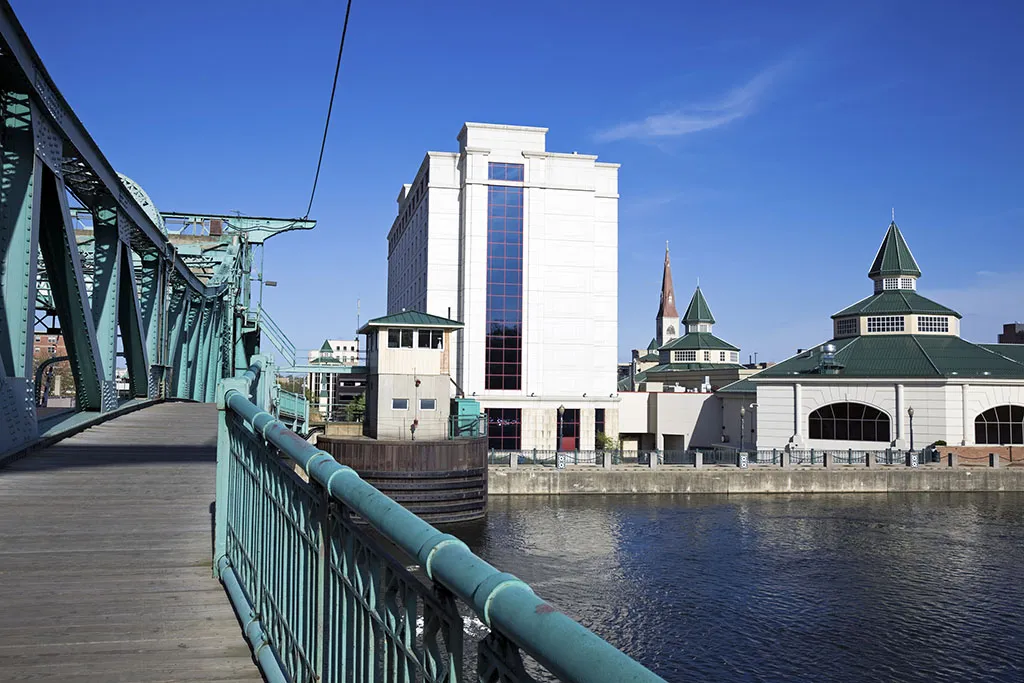
Population: 148,262
Singles (%): 52.1
Number of bars per 100k people: 14.16
Number of restaurants per 100k people: 38.45
Number of entertainment spots per 100k people: 16.19
Singles Scene Score: 30.22
25
Aurora, CO
Population: 361,710
Singles (%): 53.7
Number of bars per 100k people: 7.19
Number of restaurants per 100k people: 46.17
Number of entertainment spots per 100k people: 13.82
Singles Scene Score: 30.22
24
Oxnard, CA

Population: 207,906
Singles (%): 54.3
Number of bars per 100k people: 7.70
Number of restaurants per 100k people: 39.92
Number of entertainment spots per 100k people: 16.35
Singles Scene Score: 29.57
23
Santa Ana, CA
Population: 334,217
Singles (%): 55.5
Number of bars per 100k people: 6.88
Number of restaurants per 100k people: 44.28
Number of entertainment spots per 100k people: 10.77
Singles Scene Score: 29.36
22
Lancaster, CA
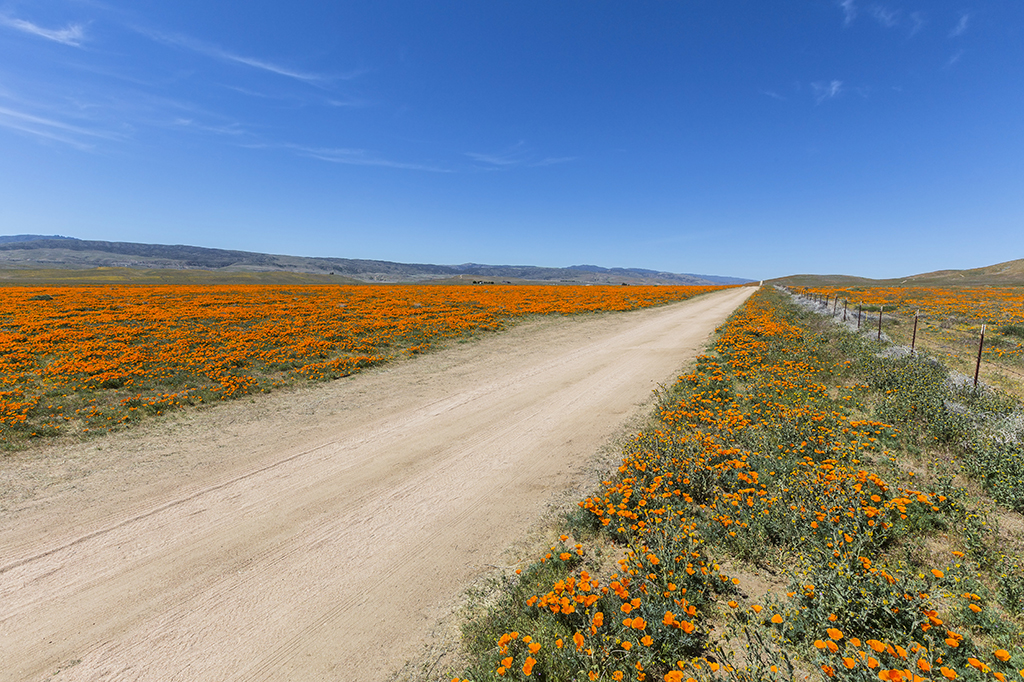
Population: 160,106
Singles (%): 57.6
Number of bars per 100k people: 6.25
Number of restaurants per 100k people: 44.35
Number of entertainment spots per 100k people: 8.74
Singles Scene Score: 29.23
21
Ontario, CA

Population: 173,212
Singles (%): 55.9
Number of bars per 100k people: 2.31
Number of restaurants per 100k people: 46.19
Number of entertainment spots per 100k people: 12.12
Singles Scene Score: 29.13
20
Hialeah, FL

Population: 236,387
Singles (%): 58.7
Number of bars per 100k people: 2.12
Number of restaurants per 100k people: 39.77
Number of entertainment spots per 100k people: 14.81
Singles Scene Score: 28.85
19
Port St. Lucie, FL

Population: 185,132
Singles (%): 48.6
Number of bars per 100k people: 9.72
Number of restaurants per 100k people: 34.57
Number of entertainment spots per 100k people: 21.61
Singles Scene Score: 28.62
18
Mesquite, TX
Population: 143,736
Singles (%): 53.2
Number of bars per 100k people: 0.70
Number of restaurants per 100k people: 42.44
Number of entertainment spots per 100k people: 17.39
Singles Scene Score: 28.43
17
Aurora, IL

Population: 201,110
Singles (%): 44.4
Number of bars per 100k people: 8.95
Number of restaurants per 100k people: 37.29
Number of entertainment spots per 100k people: 21.38
Singles Scene Score: 28.01
16
Killeen, TX
Population: 143,400
Singles (%): 47
Number of bars per 100k people: 11.16
Number of restaurants per 100k people: 36.96
Number of entertainment spots per 100k people: 16.04
Singles Scene Score: 27.79
15
Pomona, CA

Population: 152,494
Singles (%): 59.3
Number of bars per 100k people: 5.90
Number of restaurants per 100k people: 35.41
Number of entertainment spots per 100k people: 10.49
Singles Scene Score: 27.78
14
Gilbert, AZ

Population: 237,133
Singles (%): 52.9
Number of bars per 100k people: 3.37
Number of restaurants per 100k people: 31.63
Number of entertainment spots per 100k people: 21.93
Singles Scene Score: 27.46
13
Frisco, TX

Population: 163,656
Singles (%): 34.2
Number of bars per 100k people: 1.22
Number of restaurants per 100k people: 43.38
Number of entertainment spots per 100k people: 30.55
Singles Scene Score: 27.34
12
Garland, TX

Population: 234,943
Singles (%): 50
Number of bars per 100k people: 2.55
Number of restaurants per 100k people: 40.86
Number of entertainment spots per 100k people: 15.32
Singles Scene Score: 27.18
11
Detroit, MI

Population: 672,795
Singles (%): 45
Number of bars per 100k people: 14.86
Number of restaurants per 100k people: 37.46
Number of entertainment spots per 100k people: 11.30
Singles Scene Score: 27.15
10
Orange, CA
Population: 140,504
Singles (%): 53.9
Number of bars per 100k people: 8.54
Number of restaurants per 100k people: 14.95
Number of entertainment spots per 100k people: 28.47
Singles Scene Score: 26.46
9
Elk Grove, CA

Population: 169,743
Singles (%): 46.2
Number of bars per 100k people: 2.36
Number of restaurants per 100k people: 45.36
Number of entertainment spots per 100k people: 10.60
Singles Scene Score: 26.13
8
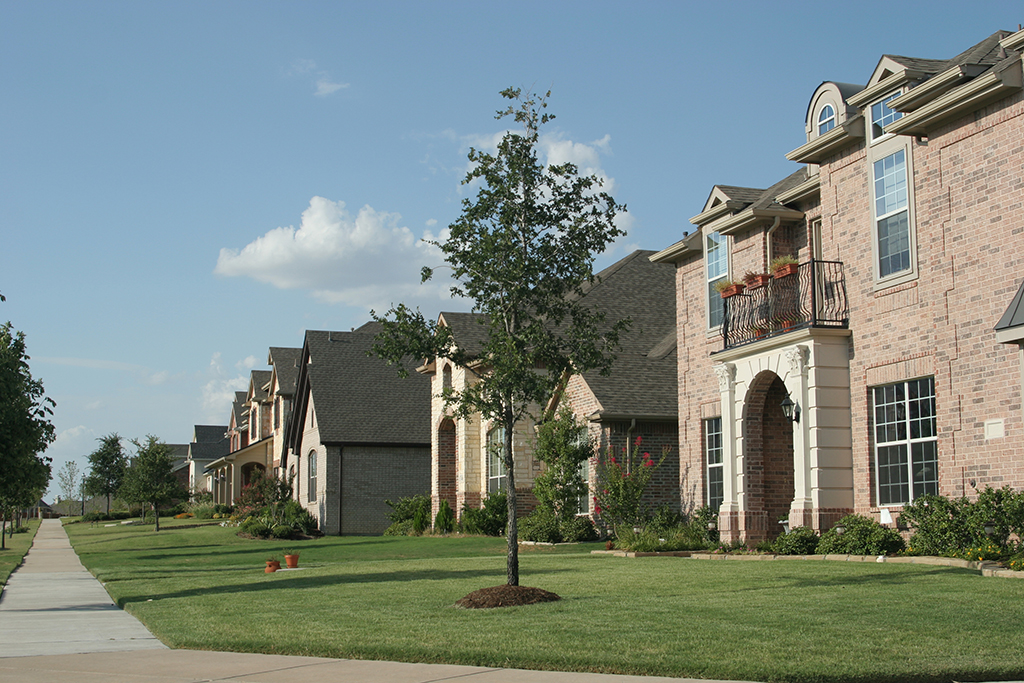
McKinney, TX
Population: 172,298
Singles (%): 41.1
Number of bars per 100k people: 2.32
Number of restaurants per 100k people: 39.47
Number of entertainment spots per 100k people: 19.73
Singles Scene Score: 25.66
7
West Valley City, UT

Population: 136,574
Singles (%): 49.7
Number of bars per 100k people: 3.66
Number of restaurants per 100k people: 33.68
Number of entertainment spots per 100k people: 14.64
Singles Scene Score: 25.42
6
Pasadena, TX

Population: 153,351
Singles (%): 53.3
Number of bars per 100k people: 4.56
Number of restaurants per 100k people: 34.56
Number of entertainment spots per 100k people: 8.48
Singles Scene Score: 25.23
5
Thornton, CO
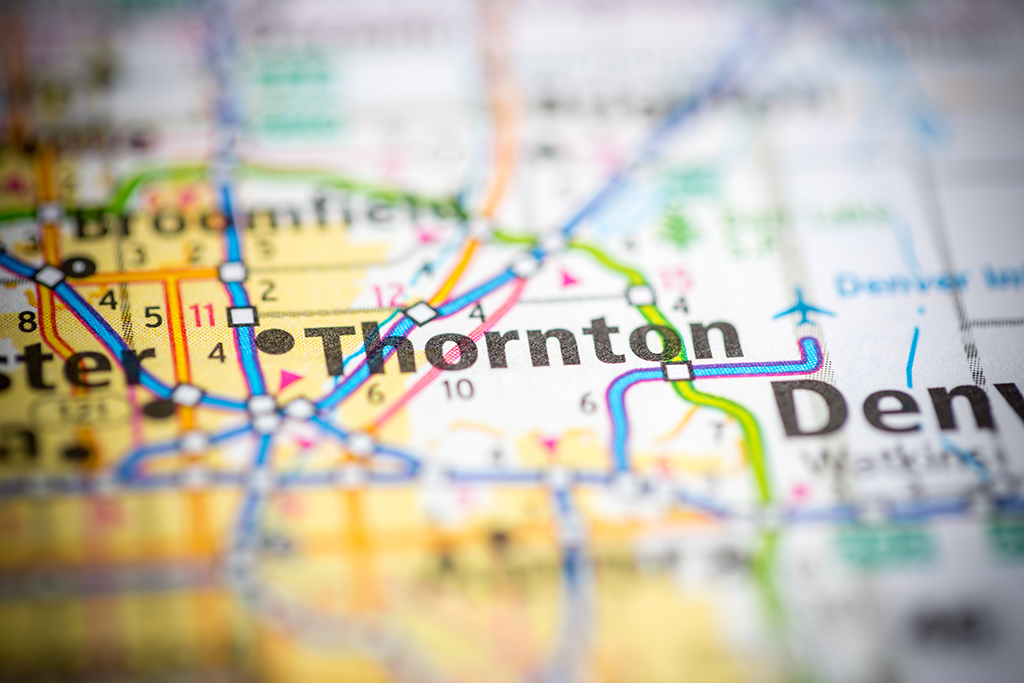
Population: 136,703
Singles (%): 46.2
Number of bars per 100k people: 7.32
Number of restaurants per 100k people: 27.80
Number of entertainment spots per 100k people: 17.56
Singles Scene Score: 24.72
4
Palmdale, CA

Population: 157,356
Singles (%): 54.7
Number of bars per 100k people: 1.27
Number of restaurants per 100k people: 33.68
Number of entertainment spots per 100k people: 8.26
Singles Scene Score: 24.48
3
North Las Vegas, NV

Population: 238,702
Singles (%): 53.8
Number of bars per 100k people: 8.80
Number of restaurants per 100k people: 17.18
Number of entertainment spots per 100k people: 11.73
Singles Scene Score: 22.88
2
Moreno Valley, CA
Population: 205,499
Singles (%): 56.1
Number of bars per 100k people: 0.97
Number of restaurants per 100k people: 26.76
Number of entertainment spots per 100k people: 5.84
Singles Scene Score: 22.42
If you're not as young as you used to be and are losing hope about meeting people the old-fashioned way, try the best dating apps if you're over 40.
1
Fontana, CA

Population: 209,665
Singles (%): 53.6
Number of bars per 100k people: 1.43
Number of restaurants per 100k people: 22.89
Number of entertainment spots per 100k people: 9.06
Singles Scene Score: 21.75
For more amazing advice for living smarter, looking better, and feeling younger, follow us on Facebook now!